Nuclear spirals as feeding channels to the Supermassive Black Hole: the case of the galaxy NGC 6951
Abstract
We report the discovery of gas streaming motions along nuclear spiral arms towards the LINER nucleus of the galaxy NGC 6951. The observations, obtained using the GMOS integral field spectrograph on the Gemini North telescope, yielded maps of the flux distributions and gas kinematics in the H, [N ii]6584 and [S ii]6717,31 emission lines of the inner 7″15″ of the galaxy. This region includes a circumnuclear star-forming ring with radius 500 pc, a nuclear spiral inside the ring and the LINER nucleus. The kinematics of the ionized gas is dominated by rotation, but subtraction of a kinematic model of a rotating exponential disk reveals deviations from circular rotation within the nuclear ring which can be attributed to (1) streaming motions along the nuclear spiral arms and (2) a bipolar outflow which seems to be associated to a nuclear jet. On the basis of the observed streaming velocities and geometry of the spiral arms we estimate a mass inflow rate of ionized gas of M⊙ yr-1, which is of the order of the accretion rate necessary to power the LINER nucleus of NGC 6951. Similar streaming motions towards the nucleus of another galaxy with LINER nucleus – NGC 1097 – have been reported by our group in a previous paper. Taken together, these results support a scenario in which nuclear spirals are channels through which matter is transferred from galactic scales to the nuclear region to feed the supermassive black hole.
1 Introduction
One long-standing problem in the study of nuclear activity in galaxies is to understand how mass is transferred from galactic scales down to nuclear scales to feed the supermassive black hole (hereafter SMBH) inside. Many theoretical studies and simulations (Shlosman et al. 1990; Emsellem et al. 2003; Knapen 2005; Emsellem et al. 2006) have shown that non-axisymmetric potentials efficiently promote gas inflow towards the inner regions (Englmaier & Shlosman 2004). Recent observations have revealed that structures such as small-scale disks or nuclear bars and associated spiral arms are frequently observed in the inner kiloparsec of active galaxies (Erwin & Sparke 1999; Pogge & Martini 2002; Laine et al. 2003).
In a recent work, Lopes et al. (2007) have shown a strong correlation between the presence of nuclear dust structures (filaments, spirals and disks) and activity in galaxies. Nuclear spirals, in particular, are estimated to reside in more than half of active galaxies (Martini et al. 2003). Martini & Pogge (1999) have shown that nuclear spirals are not self-gravitating, and that they are likely to be shocks in nuclear gas disks. Simulations by Maciejewski (2004a,b) demonstrated that, if a central SMBH is present, spiral shocks can extend all the way to the SMBH vicinity and generate gas inflow consistent with the accretion rates inferred in local AGN.
The above studies support the hypothesis that nuclear spirals are a mechanism for fueling the nuclear SMBH, transporting gas from kiloparsec scales down to a few tens of parsecs of the active nucleus (Knapen et al. 2000; Emsellem et al. 2001; Maciejewski et al. 2002; Marconi et al. 2003; Crenshaw et al. 2003; Fathi et al. 2005). This hypothesis has recently been confirmed by our group (Fathi et al. 2006) in the specific case of the LINER/Seyfert 1 galaxy NGC 1097. Using Integral Field Spectroscopy at the Gemini telescope we mapped the velocity field of the ionized gas and detected streaming motions towards the nucleus along nuclear spiral arms.
NGC 1097 is the only case so far in which streaming motions along nuclear spiral arms have been mapped. In order to verify if such spirals are always associated with inward streaming motions it is necessary to map the gas kinematics in more galaxies. With this goal in mind, we have obtained Gemini Integral Field spectroscopic observations of a few more active galaxies with nuclear spirals observed in HST images. The sample was selected from nearby galaxies (z0.005) with intermediate inclinations, to facilitate study of the gas kinematics on linear distance scales of tens of parsecs.
In the present paper we report the results for NGC 6951, a galaxy with Hubble type SAB(rs)bc, at a distance of 24 Mpc (Tully 1988), such that 1 arcsec corresponds to 96 pc at the galaxy. Originally it was argued that NGC 6951 has a LINER type nucleus (Filippenko & Sargent 1985), but more recently it has been suggested that actually its activity is intermediate between LINER and Seyfert (Pérez et al. 2000). NGC 6951 hosts a large scale bar (with total extent of 4 kpc), and at about 5″ (480 pc) from the nucleus, there is a conspicuous star-forming ring, previously observed in H (Márquez & Moles 1993; Pérez et al. 2000) and showing also strong CO and HCN emission (Kohno et al. 1999, Garcia-Burillo et al. 2005, Krips et al. 2007). Continuum radio emission has also been observed from the nucleus and star-forming ring by Saikia et al. (1994), while a higher resolution radio image can be found in Ho & Ulvestad (2001).
Our IFU measurements show that, similarly to NGC 1097, the gas kinematics inside the nuclear ring of NGC 6951, although dominated by circular rotation, shows deviations in the measured radial velocities which can be interpreted as at least partially due to streaming inward motions along nuclear spiral arms. Our results strenghten the case that nuclear spirals are indeed channels to feed the supermassive black hole in active galaxies.
The present paper is organized as follows. In Section 2 we describe the observations and reductions. In Section 3 we present the flux and kinematic measurements. In Section 4 we discuss the results and in Section 5 we present our conclusions.
2 Observations and Reductions
The observations were obtained with the Integral Field Unit of the Gemini Multi-Object Spectrograph (GMOS-IFU, Allington-Smith et al. 2002) at the Gemini North telescope, on the nights of August 31 and September 1, 2006. The observations consisted of three adjacent IFU fields (covering each) resulting in a total angular coverage of around the nucleus. Three exposures of 500 s were obtained for each of the 3 IFU fields, slightly shifted in order to correct for detector defects. Observations of the three IFU fields were obtained consecutively on the same night. The fluxes in adjacent IFU pixels from neighbouring fields were found to be consistent within 10%. Therefore, no shifts or scaling were applied when combining the three fields to obtain the final mosaic.
The longest extent of the three adjacent IFU fields was oriented along position angle (hereafter PA) 140∘, selected to approximately coincide with the major axis of the galaxy, (PA=138∘ according to Márquez & Moles 1993), while the large scale bar is oriented approximately along E–W. Each IFU fiber has a diameter which corresponds to 0.2 ″ in the sky, while the seeing during the observations ranged between 0.4 and 0.5 ″, corresponding to a spatial resolution at the galaxy of 40 pc.
The selected wavelength range was 5600–7000Å, in order to cover the H+[N ii]6548,84 and [S ii]6716,31 emission lines, observed with the grating GMOS R400-G5325 (set to central wavelength 6300 Å), with an instrumental FWHM of 2.9Å, corresponding to a spectral resolution of R ( km s-1).
The data reduction was performed using the specific tasks developed for GMOS data in the gemini.gmos package as well as generic tasks in iraf. The reduction process comprised bias subtraction, flat-fielding, trimming, wavelength calibration, sky subtraction, relative flux calibration, building of the data cubes at a sampling of 0.1 0.1, and finally the alignment and combination of the 9 data cubes. As we have obtained only relative flux calibration (what is called in Gemini “baseline calibrations”), we have normalized the flux levels using the H nuclear flux reported by Perez et al. (2000).
3 Results
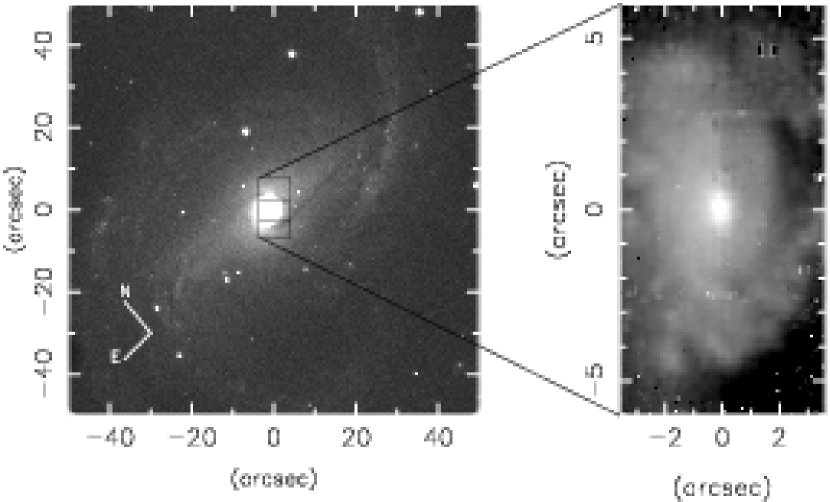
In Figure 1 we show the acquisition image with the location of the three IFU fields, together with an image obtained from the IFU data in the continuum adjacent to the H emission-line. The IFU observations cover the nuclear region out to the star-forming ring, more clearly seen in the H and [N ii] images shown in Fig. 3. The H and [N ii] emission lines could be measured over most of the field, except for a few locations which appear in black in Fig. 3. For the [S ii] emission lines, there are more locations where the lines could not be measured due to the low signal-to-noise ratio in these lines.
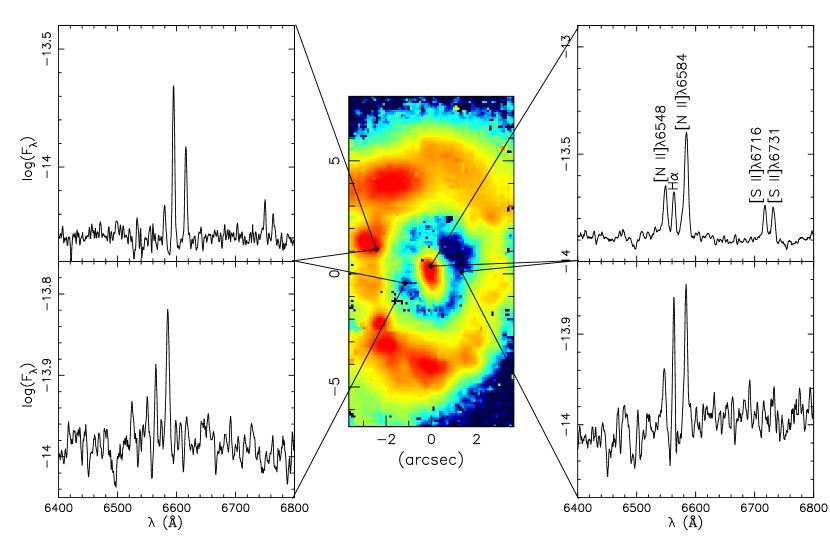
In Figure 2 we show a sample of spectra: one from the nucleus, one from the star-forming ring and two from locations between the nucleus and the ring. The emission-lines present in most spectra are H, [N ii]6548,84 and [S ii]6717,31. The lines [O i]6300,63 were marginally detected only in a few spectra, and were not considered in our analysis due to the poor signal-to-noise ratio (in these lines). The emission-line spectrum from the nucleus is LINER-like ([N ii]6584 stronger than H), as already known from previous works (e.g. Filippenko & Sargent 1985). More recently, Ho, Fillipenko & Sargent (1997) have argued that the nuclear activity is better classified as Seyfert 2, after an analysis of the nuclear spectrum taking into account the effect of the underlying stellar absorption in the fluxes of the Balmer lines. Pérez et al. (2000), after a similar analysis, conclude that the nuclear activity of NGC 6951 is intermediate between LINER and Seyfert 2. Our data are consistent with all these classifications, as our restricted wavelength coverage does not allow the observation of additional line ratios necessary to distinguish between the different types of activity.
The emission-line ratios in the star-forming ring are typical of H ii regions, while in the regions between the nucleus and the ring, the line-ratios are also mostly LINER-like, turning to “H ii-like” as the star-forming ring is approached.
3.1 Line fluxes and excitation of the emitting gas
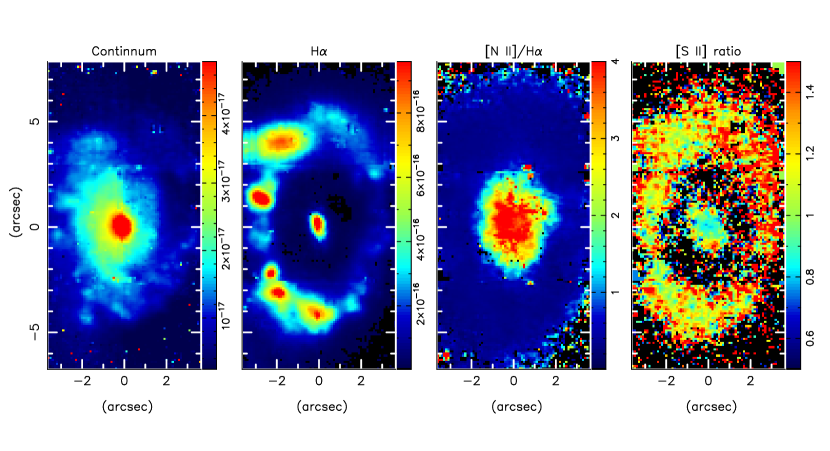
The line fluxes, radial velocities and velocity dispersions were obtained by fitting Gaussians to the emission-lines, which accurately represent the observed line profiles. The H image, obtained from the integrated H flux is shown in Fig. 3, together with the image in the adjacent continuum. Most spectra have signal-to-noise ratios in the H and [N ii] emission lines larger than 50.
The star-forming ring is clearly seen in the H image, formed by several H ii regions which appear as emission-line knots along the ring. The ring is more extended along the major axis of the galaxy (PA140∘), where it reaches 4.5″ from the nucleus (430 pc at the galaxy), while in the perpendicular direction it reaches only 2.5″.
The line ratio map [N ii]/H, obtained from the ratio of the images in [N ii]6584 and H, as well as the [S ii]6717/6731 ratio map are also shown in Fig. 3. Prior to the construction of the map [N ii]/H we have corrected the H line fluxes by an average underlying absorption due to the stellar population with an equivalenth width of 0.75Å. This procedure is necessary in order to avoid unphysical very high ratios of [N ii]/H and is supported by the inspection of a few spectra which reveal that where H emission is very faint the line is indeed obviously filling an absorption. The average value of 0.75Å was adopted from the work of Pérez et al. (2000) who estimated an absorption equivalent width of H of 1Å at the nucleus and 0.5Å at the ring on the basis of the analysis of the stellar population. We thus decided to adopt an average value between that of the nucleus and that of the ring, as the resulting corrected fluxes did not change by more than 20% at the nucleus and 10% at the ring if we change the underlying absorption by 0.25Å.
The highest [N ii]/H line ratios reach values of 4-5 within a 1″ radius from the nucleus, decreasing to 2-3 between 1″ and 2″ and down to 0.3 at the circumnuclear ring.
The ratio [S ii]6717/6731 reaches a minimum value of 0.8, implying a maximum gas density of cm-3 within 1″ from the nucleus (Osterbrock 1989). At the star-forming ring, the [S ii] ratio ranges from 1 to 1.4, with typical values at most locations between 1.1 and 1.2, implying gas densities in the range 250–400 cm-3. At the borders of the ring, the low-density limit value of 1.4 (100 cm-3) is reached. In most locations between the nucleus and the ring, the signal-to-noise ratio was too low to get a reliable value for the [S ii] ratio. In many location where it could be measured, it was in the low-density limit. In order to investigate this further, we have binned 9 spectra together (which corresponds to 0.3 0.3 arcsec2, and thus approximately to the angular resolution of the data) in several locations and got ratios in the range 1.2[S ii]6717/67311.4, thus somewhat above the low-density limit, implying ionized gas densities of 100 cm-3, which we will adopt as the typical value for this region.
3.2 Kinematics
The central wavelengths of the Gaussian curves fitted to the emission-lines were used to obtain the gas radial velocities, while the full widths at half maxima (FWHM) were used to obtain the gas velocity dispersions (FWHM/2.355). The accuracy of the velocity measurements is 10 km s-1. The radial velocity field obtained from H is shown in the top left panel of Fig. 4. It is dominated by rotation, as evidenced by its similarity to the classical “spider diagram” (Binney & Merrifield 1998). (The pixels for which we could not measure the kinematics due to low signal-to-noise ratio in the emission lines are shown in black in the figure.)
There are, nevertheless, clear deviations from simple rotation in the radial velocity field. In order to isolate these deviations, we have fitted an exponential thin disk kinematic model to the H radial velocity data, assuming that the density profile is exponential and its kinematics is circular rotation (Freeman 1970; Binney & Tremaine 1987). The procedure is similar to the one we have adopted in modelling the circumnuclear gas kinematics of NGC 1097 (Fathi et al. 2005; Fathi et al. 2006).
The velocity field corresponding to the best fit is shown in the top right panel of Fig. 4. The fit to the model gives a systemic velocity of 145020 km s-1, a deprojected maximum velocity amplitude of 22010 km s-1, a disk scale length of 4.1″0.3 (390 pc at the galaxy) and a position angle for the line of nodes of PA=125∘10∘. We have adopted a disk inclination of ∘, a value derived from photometry (Márquez & Moles 1993), because the inclination is not well constrained in our multi-parameter space fitting procedure.
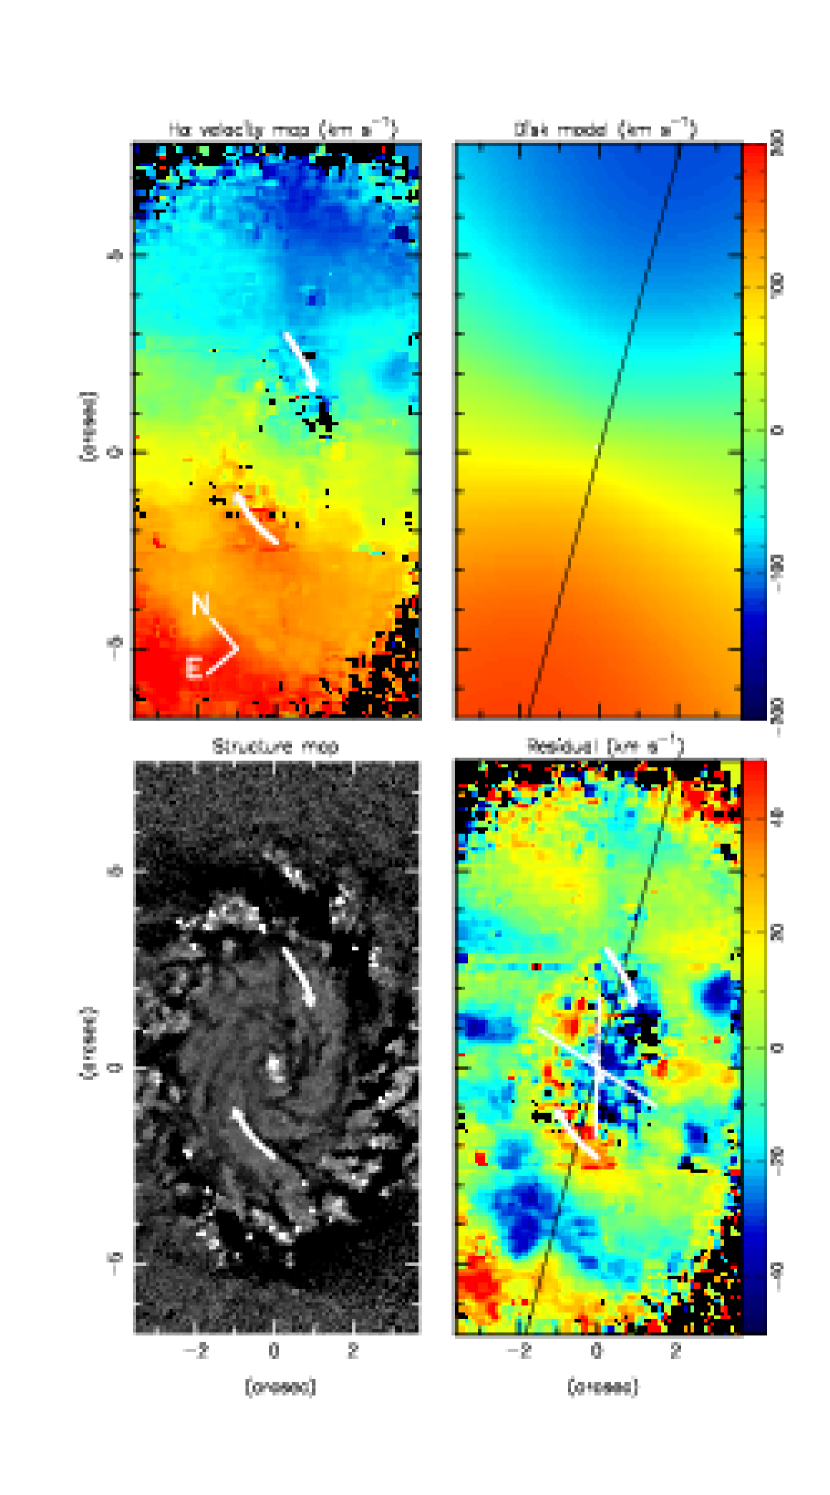
A comparison between the measured radial velocity field and the disk model reveals deviations from simple rotation. These deviations are observed along the star-forming ring as well as inside the ring, where, in particular, we have identified two features resembling partial spiral arms marked by two white curved lines with arrows in Fig. 4. In order to investigate if these deviations correspond to real features in the galaxy, we have constructed a structure map (Pogge & Martini 2002) using an HST image of the nuclear region of NGC 6951 obtained through the filter F606W (HST proposal 8597, PI M. Regan). The structure map is useful to enhance the contrast in the images, thus showing more clearly both dark structures – regions obscured by dust, as well as bright regions such as H ii regions, a compact bright nucleus or star clusters. The structure map is shown in the bottom left panel of Fig. 4, where we have drawn the same white lines of the top left panel, showing that the partial spiral arms follow the dusty spiral structure seen in the structure map. Although there are more spiral arms in the structure map than the two we see in the velocity residual map, this difference can be understood as due to the poorer angular resolution of the IFU data (0.4″) compared to that of the HST (0.05″), which precludes us from establishing a more detailed correspondence. In the bottom right panel of Fig. 4 we show the residuals between the observed and the model velocity field, where the white lines correspond again to the partial arm structures. The top arm (hereafter called W arm) corresponds to a blueshifted region in the residual map, while the bottom arm (hereafter E arm) corresponds to a redshifted region. There are aditional blue- and redshift residuals in the star forming ring as well as close to the nucleus. The aditional velocity residuals close to the nucleus in Fig. 4 are approximately delimited by the borders of a “bi-cone”, sketched in white in the figure, which corresponds to regions in which we see an increase in the values of the velocity dispersion, as discussed below.
The gas velocity dispersion () maps in H and [N ii] are shown in Fig. 5. The instrumental is 50 km s-1, thus it can be concluded that many values, particularly for H, are at the resolution limit of the instrument. The low values obtained for H in some regions are due to the fact that, in the region between the nucleus and the star-forming ring H emission is strongly affected by the underlying stellar absorption (discussed above), which makes the observed emission line weaker and narrower. On the other hand, the [N ii] profile provides a reliable measure of because it is free of the contamination by stellar absorption. Most values range between 60 and 80 km s-1 but there are larger values reaching 140 km s-1 in two blobs within 1″ from the nucleus to the S-SE and N-NW.
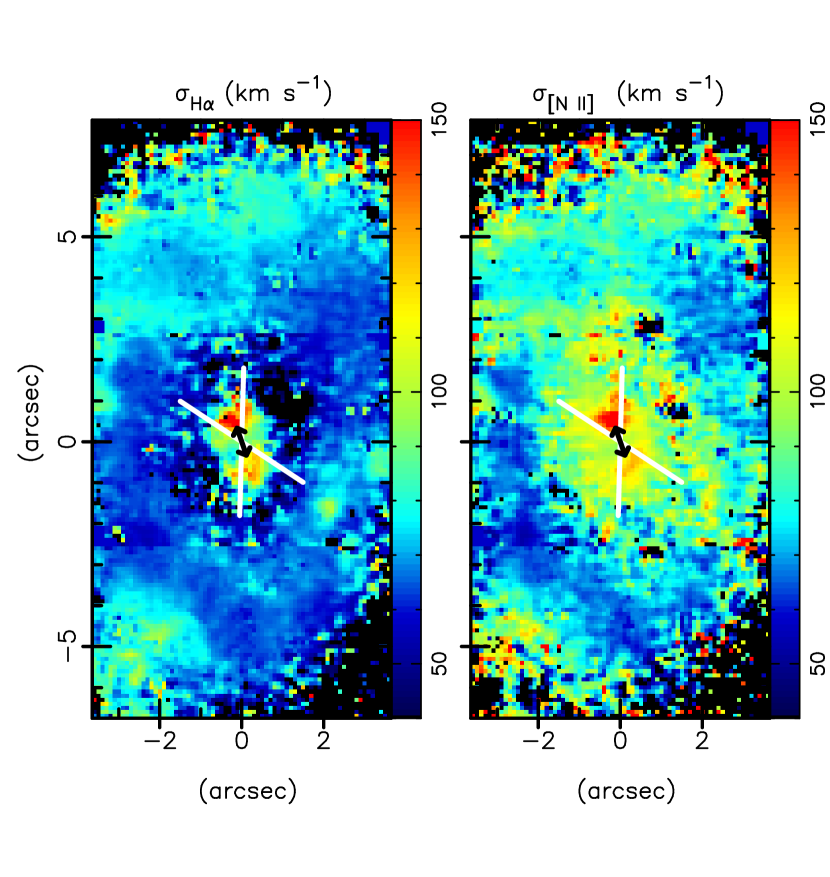
What could be the origin of these enhancements in ? Our experience with previous IFU observations (of other targets; e.g. Riffel et al. 2006; Barbosa et al. 2007), reveal that increases in in the gas surrounding AGN are usually related to the presence of a passing radio jet. We searched the literature for a possible nuclear radio jet and found that VLA observations by Saikia et al. (2002) of the inner region of NGC 6951 indeed suggest the presence of a resolved nuclear radio source presenting an angular size of 0.70.2 arcsec2 along PA=156∘. We show a representation of this small radio source as a bar with arrows in Fig. 5 as well as in the bottom right panel of Fig. 4. Notice that the extent and orientation of this radio structure coincide with those of a bright similarly elongated nuclear structure seen in the structure map (bottom left panel of Fig. 4). As the F606W filter used to obtain the HST image includes H, this coincidence suggests that we are resolving enhanced H emission associated with the radio structure in this image.
It can be seen that the estimated extent of the radio source fits well in between the two regions of enhanced values in Fig. 5. We have sketched (in white in the figure) the borders of a bi-cone which includes the regions of largest values. We notice that the corresponding locations in Fig. 4 approximately delimitate also a redshifted H emitting region to the N–NW and a blue-shifted region to the S–SE observed in the residual H velocity map (bottom right panel). The observed increase in along the bi-cone and the presence of associated blue- and reshifts suggests that these two structures are due to an outflow driven by the radio jet. The delineated bi-cone in Figs. 4 and 5 approximately separates the regions affected by the outflow from the regions affected by the residual motion along the spiral arms.
4 Discussion
4.1 Excitation
An extensive photometric and spectroscopic study of the galaxy NGC 6951 has been presented by Pérez et al. (2000, hereafter P00). They adopt the disk major axis PA=138∘ and have obtained longslit spectra (slit width of 1 arcsecond) along this PA as well as along PA=48∘ (minor axis) and PA=84∘.
P00 quote line ratio values of [N ii]/H larger than unity within the inner 2″, reaching 5 at the nucleus, in agreement with our results. They present data within the nuclear region at a sampling of 0.5″ (although the seeing was 1.2″ during their observations). P00 report electron density values increasing from N300 cm-3 at the ring to 1000 cm-3 at the nucleus, also in agreement with our results.
In order to further investigate the excitation, we have plotted in Fig. 6 the ratio [N ii]/H vs. the velocity dispersion obtained from the width of the [N ii]6584 emission-line . We have separated the data from the ring and from the region inside the ring using the H image to identify the region dominated by the ring. In order to do this, we have fitted two ellipses: one to the inner border of the ring and another to the outer border. Along the longest extent of the ring (approximately along the vertical axis of the figures), the inner border is located at 2.8″ from the nucleus and the outer border at 6.8″, while along the shortest extent of the ring the inner border is at 2.0″ and the outer border at 3.6″.
It can be seen that the behavior of the two regions is clearly different: while for the ring most values of [N ii]/H are in the range 0.3–0.4, typical of H ii regions and show just a weak correlation with , in the region inside the ring the [N ii]/H values are much higher and present a strong correlation with . This behavior has been observed previously in other galaxies (e.g. Keppel et al. 1991; Sokolowski et al. 1991; Storchi-Bergmann et al. 1996), meaning that the gas excitation is related to its kinematics, and suggest in particular that at least part of the ionization is produced by shocks as shocks do enhance the [N ii]/H ratio (Viegas & Contini 1994; Sutherland et al. 1993), as well as broaden the emission-lines. The presence of shocks in the vicinity of the nucleus is particularly evident in Fig. 5, where we have shown that two regions which have the highest observed values are located at the ends of the nuclear radio structure, and can be interpreted as gas from the interstellar medium of the galaxy shocked by a radio jet.

4.2 The nuclear spiral
Garcia-Burillo et al. (2005, hereafter GB05) have obtained molecular CO radio images of the inner region of NGC 6951, showing that most of the CO emission is concentrated in “two winding nuclear spiral arms which end up as a pseudo-ring at 350 pc from the nucleus”, with an estimated molecular gas mass of M⊙. This nuclear spiral seen in molecular gas corresponds in fact to the H ring, whose strongest H emission seems to be a bit external to the strongest molecular gas emission.
GB05 also report the observation of “an unresolved nuclear complex” within 50 pc from the nucleus, estimating its mass to be a few M⊙. The presence of a relatively large molecular gas mass at the nucleus is supported also by the recent mm-interferometric observations by Krips et al. (2007) who have found compact HCN emission at the nucleus and estimate an even larger mass for the corresponding molecular complex, of 2–10M⊙. These observations support the recent inflow of molecular gas to the nuclear region.
Besides the nuclear complex, GB05 have also “tentatively detected” (their words) low level CO emission bridging the gap between the nuclear source and the N part of the ring, with an estimated molecular mass of M⊙. GB05 argue that this structure could be the molecular counterpart of the filamentary spiral structure identified in a J–H color map of NGC 6951 obtained from HST images. Their J–H map (Fig. 4a in GB05) is very similar to the structure map we show in the lower left panel of Fig. 4. A comparison of this structure map with both our H velocity map (upper left panel of Fig. 4) and Fig. 4 of GB05 shows that their “molecular bridge” seems to partially coincide with the W arm structure seen in our kinematic map, in particular with the “inner end” of our partial W arm. A close look shows that the molecular bridge seems to be associated with the darker regions of the structure map closer to the nucleus (an thus with the dust structure) while our W partial arm is better coincident with the brighter portions of the structure map, a bit more distant from the nucleus. A possible interpretation is that we are seeing two parts of a spiral arm: a more external one, traced by H emission, and a more internal one, seen only in molecular gas emission, probably due to the absence – or faintness – of ionized gas emission.
4.3 Kinematics
The rotation pattern in the H radial velocity field (Fig. 4) shows that the SE side of the galaxy is receding while the NW side is approaching. Under the assumption that the spiral arms are trailing, and that the approaching side of the bar piles up the dust in front of it, it can be concluded that the near side of the galaxy is the SW, and the far side is the NE. The deviations from circular rotation along the two partial spiral arms in the inner 2–3″ from the nucleus – blueshifted residuals along the W arm and redshifted residuals along the E arm – can thus be interpreted as streaming motions along nuclear spiral arms towards the nucleus.
Nevertheless, the residuals in this inner region extend beyond the region covered by the E and W arms drawn in Fig. 4: in particular, there are additional blueshifts observed to the S–SE of the nucleus and redshifts observed to the N–NW, which seem to be a continuation of the E and W arms. Nevertheless, at 1″N–NW and S–SE of the nucleus, they are not consistent with streaming motions towards the nucleus. We conclude that these residuals are in fact outflows due to the interaction of the radio source at the nucleus (Saikia et al. 2002) with the circumnuclear ISM of the galaxy.
This hypothesis is supported by the increase in the velocity dispersion of the gas from 70 km s-1 to 140 km s-1 along the position angle of the radio structure (PA=156∘), approximately within a region delineated by two white lines representing the borders of a bi-cone in Fig. 5. From the location of this bi-cone in Fig. 4, we conclude that the residual blueshifts at 1″N-NW and redshifts at 1″S-SE of the nucleus are observed in the regions corresponding to those with enhanced and can be interpreted as outflows related to the radio source.
The residuals from circular motion in the inner 3″ thus include two components: (1) streaming motions towards the nucleus along spiral arms and (2) an outflow due to the interaction of a radio source with the circumnuclear ISM of the galaxy. From the relative intensity of the continuum observed in the structure map in the location of the radio structure, which is brighter to the side to which the residuals are blueshifts, we suggest that the near side of the jet is projected against the near side of the galaxy, which is possible only if its angle relative to the galaxy plane is smaller than 48∘, for the adopted inclination of the galaxy of 42∘.
In the regions corresponding to the ring, there are also radial velocity residuals relative to the circular rotation which could be due to outflows from the starbursts along the ring and/or deviations due to the accumulation of the gas in the Inner Lindblad Ressonance.
The kinematics we have obtained for the nuclear region of NGC 6951 can be compared with that obtained in previous works, in particular by P00, who have studied the large scale kinematics from long-slit spectroscopy along three position angles (over a radius of up to 100″ from the nucleus): one along the photometric major axis (138∘), one along the perpendicular direction (48∘) and one along PA=84∘. On the basis of the kinematics along these three PAs, P00 obtain a systemic velocity of 4 km s-1 and an amplitude of the rotation curve of 200 km s, after de-projection (see, for example, Fig. 13 of P00). These parameters are similar to our values of 20 km s-1 and amplitude km s-1 of the rotation curve. These paramenters are also similar to those previously obtained by Márques & Moles (1993) on the basis of longslit spectra along the major and minor axes of the galaxy, in spite of the fact that our kinematic data is two-dimensional but covers a much smaller radial extent (3.5″ ). This difference in angular coverage may explain the difference between the major axis orientation obtained in previous studies and the one derived from our kinematic modelling of 125 10 ∘.
P00 report a “peculiar structure” in the velocity field along the minor axis (PA=48∘), which they argue could be due to a nuclear outflow or to a structure related to the “internal Inner Lindblad Ressonance (iILR)”. They adopt the second hyppothesis, suggesting counter rotation of an inner disk, which they argue could be related to the iILR, calculated to occur at 180 pc (2″). They argue that this would fit into a scenario of disk nested within disks. Our data, with a complete 2D coverage, favors best the nuclear outflow hypothesis, but in combination with streaming motions along nuclear spirals.
4.4 The origin of the nuclear spiral
GB05 have used near-IR HST images of the nuclear region – where they found a stellar oval – in combination with the CO observations, in order to estimate whether torques produced by the non-axisymmetric stellar potential would be efficient enough to drain the gas angular momentum allowing its inflow to the nuclear region. GB05 conclude that the inflow is efficient only down to the star forming ring, approximately. Inside the ring, the torques are positive and cannot drive gas inflow. As molecular gas is observed much closer to the nucleus, GB05 conclude that, inside the ring, other mechanisms should be responsible to drive the AGN fueling, such as viscous torques.
Englmaier & Shlosman (2000) have used 2D numerical simulations to show that nuclear gaseous spirals are generated as as result of the gas response to the gravitational potential of a galactic disk with a large scale stellar bar. Both NGC 6951 and NGC 1097 (Fathi et al. 2006) present similar large scale stellar bars, which could thus play a role in the formation of the nuclear spirals.
More recently, Maciejewski (2004) has considered the effect of a SMBH in nuclear gaseous spirals. The fact that the SMBH does play a role is supported by the ubiquitous presence of nuclear spirals in Seyfert galaxies (Martini & Pogge 1999; Pogge & Martini 2002), and, in particular, by the strong correlation of their presence with the nuclear activity (Lopes et al. 2007). Maciejewski concludes that, if the asymmetry is strong, spiral shocks are produced, and the central SMBH can allow the spiral shocks to extend all the way to its immediate vicinity, generating gas inflow of up to 0.03 M⊙ yr-1. The cases of NGC 6951 presented here and NGC 1097 presented by Fathi et al. (2006) seem to support the models of Maciejewski (2004a,b).
4.5 Estimating the mass accretion flow
We can use the residual velocities observed along the nuclear spiral to estimate the rate of mass flowing to the nucleus. In order to do that, we assume that the mass flows along two nuclear spiral arms. The cross section of these arms can be estimated assuming an opening angle of 20∘ subtended by the spiral arms at 100 pc from the nucleus. This opening angle corresponds to a radius for an assumed circular cross section of the spiral arm calculated as:
| (1) |
The flux of matter crossing the circular cross section can be calculated as:
| (2) |
where is the electron density, is the streaming velocity of the gas towards the nucleus, is the number of spiral arms, is the mass of the proton, and is the filling factor. The filling factor was estimated from:
| (3) |
where is the H luminosity emitted by a volume and 3.534 erg cm-3 s-1 (Osterbrock 1989). In the region covered by the partial spiral arms we obtain an average flux per pixel (of angular size 0.1″ 0.1″) of 4.8 erg cm-2 s-1. In order to calculate the H luminosity in the region covered by a partial arm, we adopt an area of 2″ 1″ which corresponds to 200 pixels. We thus obtain = 200 4.8 erg cm-2 s Mpc)2=6.62 1038 erg s-1. Adopting an approximate volume for the region (from Fig. 4) of 2″ 1″ 1″, or = 2000 (9.6 pc)3, we obtain 0.004.
The velocity residuals in the region of the partial nuclear arms, which we have interpreted as streaming motions, range from 20 km s-1 to 50 km s-1 (Fig. 4). Assuming that these streaming motions occur in the plane of the galaxy, we need to correct these values for the inclination of the galaxy ∘. The resulting average velocity for the streaming motions is = 40 km s-1. For cm-3 (Fig. 3), km s-1 and , we obtain the value for the flux of matter along the nuclear spirals of g s-1 0.004 8 M⊙ yr-1.
We note that the above calculation is only a rough estimate, as it depends on uncertain parameters, such as the geometry of the flow. Under the assumption that the gas moving along the spiral is reaching the nucleus, we can compare the above calculated rate of ionized gas flow to the accretion rate necessary to reproduce the luminosity of the LINER nucleus of NGC 6951, calculated as follows. The nuclear luminosity can be estimated from the H luminosity of L(H) erg s-1 (from the nuclear flux and reddening quoted by P00) using the approximation that the bolometric luminosity is 100 (H erg s-1 (Ho 1999; Ho et al. 2001). This estimate is consistent also with the upper limit on the X-ray luminosity of this galaxy, erg s-1 (Fabbiano et al. 1992; Ho 1999). The mass accretion rate can then be estimated as:
| (4) |
where is the efficiency of conversion of the rest mass energy of the accreted material into radiation. For a “standard” geometrically thin, optically thick accretion disk, 0.1 (e.g. Frank et al. 2002), but for LINERs it has been concluded that the accretion disk is geometrically thick, and optically thin (Ho 2005; Nemmen et al. 2006, Yuan 2007). This kind of accretion flow is known as RIAF (Radiatively Inefficient Accretion Flow; Narayan 2005), and has a typical value for 0.01. We use this value to derive an accretion rate of g s-1, or 2.8 M⊙ yr-1. Comparing this accretion rate with the mass flow of ionized gas along the nuclear spirals derived above , we conclude that 3 . Thus the flow of ionized gas along the spiral arms is of the order of the one necessary to feed the AGN in NGC 6951.
We should nevertheless point out that this flow is most probably a lower limit to the actual inward flow of matter, as we are observing only the ionized gas, which may be just the “tip of the iceberg”. Neutral and molecular gas may also be flowing in, as suggested by the 107 M⊙ of molecular gas mass detected at the nucleus by GB05 and Krips et al. (2007).
We now compare the above results obtained for NGC 6951 with those obtained for NGC 1097. Storchi-Bergmann (2007) has calculated the mass flow rate along the nuclear spirals of NGC 1097 on the basis of similar IFU observations, but for a filling factor f=1. If we adopt a more realistic value of 10-3, it can be concluded that the mass flow rate of ionized gas is again similar to the accretion rate necessary to power the LINER nucleus of NGC 1097. Similarly to the case of NGC 6951, the total mass flow is probably larger, and could include neutral and molecular gas. A larger mass flow rate would be consistent with the presence of a young starburst (age106 yr) with mass 106 M⊙ discovered in the nuclear HST-STIS UV nuclear spectrum of NGC 1097 and estimated to be closer than 9 pc from the nucleus (Storchi-Bergmann et al. 2005). The gas flowing to the nuclear region is thus not only feeding the nucleus but has also accumulated enough mass to give origin to a circumnuclear starburst in the last 106 yrs. The association of recent star-formation with nuclear activity has been claimed in many recent studies (e.g. Cid Fernandes et al. 2001, Storchi-Bergmann et al. 2001) and its association in particular with dust structures in early-type galaxies has been also supported by the recent work of Ferrarese et al. (2006).
5 Concluding Remarks
We have presented IFU-GMOS observations of the ionized gas in the inner region of the galaxy NGC 6951 which evidence the presence of streaming motions along nuclear spiral arms towards its LINER nucleus. The streaming motions are observed over an extent of 200 pc along two partial spiral arms down to 100 pc from the nucleus.
This is so far only the second galaxy in which such streaming motions have been mapped, the first being NGC 1097 also by our group (Fathi et al. 2006). The relevance of this result stems from the fact that the presence of dusty nuclear structures correlates strongly with nuclear activity (Lopes et al. 2007), what suggests that these structures are associated with the actual fuel on its way in to feed the nuclear SMBH.
Nevertheless, until recently, there were no kinematic measurements which showed that these spirals do carry gas inwards. Such kinematic measurements are difficult to obtain due to the fact that the gas kinematics of the nuclear region of active galaxies is usually dominated by outflows from the narrow-line region. Most kinematic studies do reveal outflows and no inflows (e.g. Crenshaw & Kraemer 2007 and references therein).
In order to observe colder gas that can fall inwards it is necessary to obtain gas kinematics around nuclei with low levels of activity, such that the outflows are small, if present. This seems to be the case of NGC 6951: a LINER nucleus, with a small jet, such that it was possible to disentangle the outlow related to the jet from streaming motions along nuclear spirals. Additional observational constraints to observe such motions around a galaxy nucleus include a favorable orientation of the galaxy to allow the measurement of the kinematics and strong enough gas emission to allow such measurements up to several hundred parsecs from the nucleus, so that we can constrain the disk rotation and on top of it measure the residuals from circular motion.
With the present results for NGC 6951 we can now say that there are two galaxies with confirmed inward streaming motions along nuclear spirals – NGC 1097 and NGC 6951 – giving strong support to the hypothesis that these spirals are indeed channels through which the matter flows inwards to feed the SMBH.
The kinematic measurements and an estimated geometry derived from the observations has allowed us to estimate the ionized gas mass flow rate along the nuclear spirals of NGC 1097 and NGC 6951. We obtain values which are similar to the accretion rate necessary to power the AGN. The total mass flow rate is most probably larger, including neutral and molecular gas. In the case of NGC 6951, molecular gas has been recently observed both at the star forming ring and inside the ring. In the case of NGC 1097, the young nuclear starburst found by Storchi-Bergmann et al. (2005) supports also a larger flow of matter to the nucleus in the last 106 yrs. Thus it may be that the inflows observed along nuclear spiral arms not only feed nuclear SMBH but at the same time contribute to the growth of the bulge via star formation. As a result, both the stellar component of the galaxy and its SMBH at the nucleus grow after each activity cycle, in agreement with the scenario implied by the M relation (e.g. Tremaine et al. 2002).
References
- (1) Allington-Smith, J. et al. 2002, PASP, 114, 892
- (2) Barbosa, F. K. B. et al. 2007, in preparation
- (3) Binney, J. & Merrifield, M. 1998, Galactic Astronomy, Princeton Series in Astrophysics, Princeton Univ. Press, Princeton, New Jersey
- (4) Cid Fernandes, R., Heckman, T., Schmitt, H., González Delgado, R. & Storchi-Bergmann, T. 2001, MNRAS, 558, 81
- (5) Crenshaw, D. M., Kraemer, S. B., Gabel, J. R. 2003, AJ, 126, 1690.
- (6) Crenshaw, D. M., Kraemer, S. B. 2007, ApJ, in press [astro-ph/0612446]
- (7) Emsellem, E., Fathi, K., Wozniak, H., Ferruit, P., Mundell, C. & Shinnerer, E. 2006, MNRAS, 365, 367
- (8) Emsellem, E., Goudfrooij, P., Ferruit, P. 2003, MNRAS, 345, 1297.
- (9) Emsellem, E., et al. 2001, A&A, 368, 52
- (10) Englmaier, P., Shlosman, I. 2000, ApJ, 528, 677
- (11) Englmaier, P., Shlosman, I. 2004, ApJ, 617, L115
- (12) Erwin, P., Sparke, L. S. 1999, ASPC, 182, 243
- (13) Fabbiano, G., Kim, D.-W. and Trinchieri, G. 1992, ApJS, 80, 531
- (14) Fathi, K., van de Ven, G., Peletier, R. F., Emsellem, E., Falcón-Barroso, J., Cappellari, M. & de Zeeuw, T. 2005, MNRAS, 364, 773
- (15) Fathi K., Storchi-Bergmann, T., Riffel, R. A., Winge, C., Axon, D. J., Robinson, A., Capetti, & Marconi, A. 2006, ApJ, 641, L25
- (16) Ferrarese, L. et al. 2006, ApJS, 164, 334
- (17) Filippenko, A. V. & Sargent, W.L.W. 1985, ApJS, 57, 503
- (18) Frank, J., King, A. R. & Raine, D. J. 2002, in Accretion Power in Astrophysics (3rd ed., Cambridge Univ. Press)
- (19) Freeman, K. 1970, ApJ, 160, 811
- (20) Garcia-Burillo, S. et al. 2005, A&A, 441, 1011
- (21) Ho, L. C. 1999, ApJ, 516, 672
- (22) Ho, L. C. et al. 2001, ApJ, 549, L51
- (23) Keppel, J. W. et al. 1991, ApJ, 374, 507
- (24) Knapen, J. H. et al. 2000, ApJ, 528, 219.
- (25) Knapen, J. H. 2005, ApSS, 295, 85.
- (26) Kohno, K. et al. 1999, ASP Conference Proceedings, vol 217, eds. J. G. Mangum & S. J. E. Radford
- (27) Krips, M. et al. 2007, A&A, in press (astro-ph/0701403)
- (28) Laine, S. et al. 2003, AJ, 126, 2717.
- (29) Lopes, R. S., Storchi-Bergmann, T., Martini, P. & Saraiva, M. F., 2007, ApJ, 655, 718
- (30) Maciejewski, W. 2004a, MNRAS, 354, 883
- (31) Maciejewski, W. 2004b, MNRAS, 354, 892.
- (32) Maciejewski, W., Teuben, P. J., Sparke, L. S., Stone, J. M. 2002, MNRAS, 329, 502.
- (33) Marconi A., Axon D.J. et al. 2003, ApJ, 586, 868
- (34) Márquez, I. & Moles, M. 1993, AJ, 105, 2090
- (35) Martini, P., Regan, M. W., Mulchaey, J. S., Pogge, R. W. 2003, ApJ, 589, 77
- (36) Martini, P., Pogge, R. W. 1999, ApJ, 569, 624
- (37) Narayan, R., 2005, in From X-ray Binaries to Quasars: Black Hole Accretion on All Mass Scales, ed. T. J. Maccarone, R. P. Fender & L. C. Ho (Dordrecht: Kluwer)
- (38) Nemmen, R. S., Storchi-Bergmann, T., Yuan, F., Terashima, Y. & Wilson, A. S. 2006, ApJ, 643, 652
- (39) Osterbrock, D., Astrophyscis of Gaseous Nebulae and Active Galactic Nuclei, University Science Books
- (40) Pérez, E. et al. 2000, A&A, 353, 893
- (41) Pogge, R. W., Martini, P. 2002, ApJ, 569, 624
- (42) Riffel, R., Storchi-Bergmann, T., Winge, C. & Barbosa, F. K. B. 2006, MNRAS, 373, 2
- (43) Saikia, D. J., Ohookun, B., Pedlar, A. & Kohno, K. 2002, A&A, 383, 98
- (44) Saikia, D. J., Pedlar, A., Unger, S. W., Axon, D. J. 1994, MNRAS, 270, 46
- (45) Shlosman, I., Begelman, M. C., Frank, J. 1990, Nature, 345, 679.
- (46) Storchi-Bergmann, T. 2007, Proceedings of the IAU Symposium 238, Black Holes: from Stars to Galaxies – across the Range of Masses (Prague 2006), eds. V. Karas & G. Matt, in preparation.
- (47) Storchi-Bergmann, T., Wilson, A. S, & Baldwin, J. A. 1996, ApJ, 460, 252
- (48) Storchi-Bergmann, T., Gonz ez Delgado, R. M.; Schmitt, H. R.; Cid Fernandes, R., Heckman, T. 2001, ApJ, 559, 147
- (49) Storchi-Bergmann, T., Nemmen, R. S., Spinelli, P. F., Eracleous, M, Wilson, A. S., Filippenko, A. V. & Livio, M. 2005, ApJ, 624, L13
- (50) Sokolowski, J., Bland-Hawthorn, J. & Cecil, G. 1991, ApJ, 375, 583
- (51) Sutherland, R. S., Bicknell, G. V. & Dopita, M. 1993, ApJ, 414, 110
- (52) Tremaine, S. et al. 2002, ApJ, 574, 740
- (53) Tully, R. B 1988, Nearby Galaxies Catalogue, Cambridge University Press
- (54) Viegas, S. M. & Contini, M. 1994, ApJ, 428, 113
- (55) Yuan, F. 2007, in The Central Engine of Active Galactic Nuclei, ed. L. C. Ho & J.-M. Wang (San Francisco: ASP) (astro-ph/0701638)