Alkali Line Profiles in Ultracool White Dwarfs
Abstract
We present PHOENIX atmosphere models for metal-rich cool white dwarfs using improved line shapes for the Na I and K I resonance doublets. Profiles for collisional broadening due to H2 and He based on the adiabatic representation show strong deviations from Van der Waals interaction at short distances. Comparison with observed spectra that show extremely broadened Na I lines indicates that a He-rich atmospheric composition is required to explain the line strengths and spectral energy distributions. Our current synthetic spectra, using an expansion in powers of density to the third order optimised for brown dwarf atmosphere conditions, significantly underestimate the observed absorption in the far wings, even predicting smaller total line strength than a Lorentzian profile. This is shown to be due to the handling of multiple perturber interactions becoming inadequate for the extreme densities of the coolest white dwarfs. The density expansion would have to be extended at least to the 7th order for an accurate treatment of such conditions and might break down altogether in the densest objects. The results of a direct calculation of the unified profile should therefore be used for model atmospheres of cool metal-rich white dwarfs. Qualitative comparison of the full adiabatic profile to the spectrum of WD2356209 indicates good agreement with the observed line shape. Observations of the coolest white dwarfs may therefore serve as a laboratory for testing the physics of the deeper atmospheres and interiors of brown dwarfs and giant planets.
1 Institut für Astrophysik, Georg-August-Universität,
Friedrich-Hund-Platz 1, 37077 Göttingen, Germany
2Institut d’Astrophysique de Paris, CNRS,
98bis Boulevard Arago, 75014 Paris, France
3 Hamburger Sternwarte, Gojenbergsweg 112, 21029 Hamburg, Germany
4 Université de Lyon, 69003 Lyon, France
5 Ecole Normale Supérieure de
Lyon, 46 allée d’Italie, 69007 Lyon, France
6 CNRS, UMR 5574, Centre de Recherche Astrophysique de Lyon,
Université Lyon 1, 69622 Villeurbanne, France
1. Introduction
Observations of the oldest and coldest white dwarfs following the study of Oppenheimer et al. (2001) have revealed two stars showing very unusual wide and deep absorption at 5000 – 6000 Å. In WD2356209 this spectroscopic feature is accompanied by a unusual combination of blue and extremely red colours (Salim et al. 2004). A second star with this absorption feature has been identified in Data Release 2 of the Sloan Digital Sky Survey: SDSS J 13 30 01.13+64 35 23.8 (hereafter SDSS J1330+6435 Harris et al. 2003), which also shows indications of an additional strong absorption around 4000 Å. These spectra bear intriguing resemblance to the strongly broadened Na I and K I resonance doublets observed in cool brown dwarfs of late L or T spectral type (Tsuji et al. 1999; Burrows et al. 2000). Collisional broadening of the Na I lines in a metal-enriched, extremely dense white dwarf atmosphere thus lent itself as an explanation for these observations.
In addition to the Na I line the spectrum of WD2356209 shows some absorption features indicating the possible presence of other opacity sources. In a previous analysis we have attempted to model these features with molecular bands expected to form in a cool hydrogen-rich environment (Homeier et al. 2005). In particular, chemical equilibrium models predict MgH and CaH absorption around 5000 and 7000 Å, respectively, for effective temperatures below approximately 5000 K. However and resolution of the spectra would not allow the identification of these bands with certainty. On the other hand strong arguments exist in favour of a helium-rich composition, the most important ones being the generally higher densities in the highly transparent cool helium atmospheres, which would easily provide the extreme perturber densities evident in the line profile, and much shorter diffusion timescales in hydrogen atmospheres (Dupuis et al. 1993), making the presence of significant amounts of heavier elements practically impossible without a continuous source of enrichment.
Yet under these premises a helium-dominated atmosphere containing a smaller fraction of hydrogen-rich material could still provide a viable explanation of the observed spectra. Koester et al. (2005) have analysed an, albeit hotter, WD of such composition and found its combination of hydrogen lines with an unusually strong Balmer decrement and Ca, Mg and Fe lines best explained with the admixture of ca. 10-2.8 solar composition material to a helium atmosphere. Such a model also obviates the need for removing the hydrogen from the accreted material e. g. by means of the propeller mechanism (Wesemael & Truran 1982).
2. Spectral Models
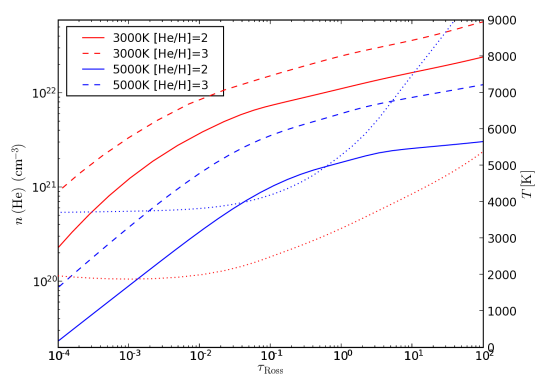
Stellar atmosphere models were calculated using the PHOENIX code (Hauschildt & Baron 1999), in its static, 1D LTE setup. Formation of molecules in full chemical equilibrium is included by the equation of state of Allard et al. (2001) as described in Homeier et al. (2005), though in the white dwarf models chemistry is dominated by only a few hydrogen compounds. This EOS does not take into account, on the other hand, non-ideal-gas effects relevant at extreme densities. But densities in the line formation region mostly do not exceed the limit of 1022 cm-3 (cf. Fig. 3), where a fluid-like state is approached and corrections for non-ideality must be included (Kowalski et al. 2005).
Profiles of the alkali metal resonance lines for perturbations due to neutral He and H2 are calculated as the Fourier transform of the autocorrelation function of the dipole moment within the adiabatic theory, as detailed in Allard et al. (2003, 2005). In the PHOENIX implementation the line opacity is calculated by splitting the profile into a core component, which is describing the interactions at long distance with a Lorentzian line shape, and the far wings for close interactions that can produce detunings up to several 1000 Å. The latter is computed in the low density limit using an expansion of the autocorrelation function in powers of density, which for the present models has been developed to the third order and evaluated at a perturber density of 1020 cm-3. This method, successfully applied under the conditions of brown dwarf atmospheres, possibly compromises results at higher density ranges, where multiple perturber interactions become important even at close distances.
2.1. Comparison with Observation
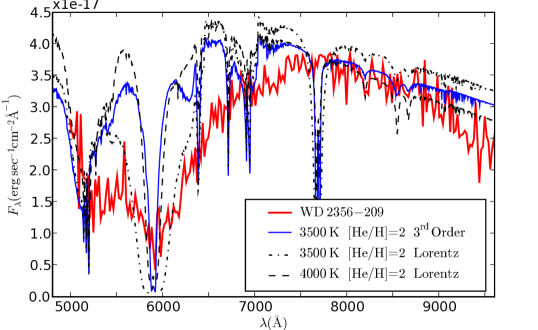
Figure 1 shows the optical spectrum of WD2356209 in comparison to three of our models. In all cases shown here, the logarithmic ratio of He/H number densities is set to 2, i. e. 1 % hydrogen with a corresponding amount of heavy elements at solar-composition ratios added to the helium atmosphere .
A comparison of the WD2356209 spectrum with hydrogen/helium LTE atmospheres is presented in Fig. 1. The strong dependence of the alkali lines on temperature, becoming quickly weaker with increasing , is evident. For these models the spectrum becomes increasingly difficult to reproduce at temperatures above 4000 K, as the the width of the Na I doublet would require unrealistically high Na abundances, even up to the solar value. Such high metallicities would also conflict with the observed limits on molecular bands such as MgH and CaH and the K I doublet at 7700 Å, all of which should be seen quite clearly if a solar abundance pattern is assumed.
2.2. Influence of the Line Profiles
The synthetic spectra using line profiles calculated in the impact approximation, thus including multiple-perturber interactions and yielding a Lorentzian lineshape, show that this simpler model can better reproduce the total strength and width of the Na I line, though the shape appears very poorly matched. One might therefore suspect that the expansion of the autocorrelation function has to be extended to higher powers of density for a correct implementation of the unified profile. As illustrated in Figure 2 the perturber density in the line-forming region of an ultracool WD atmosphere can indeed exceed considerably the value of 10 for which the present version of the far wing profiles was evaluated.
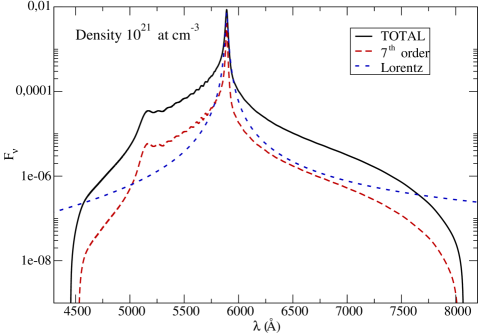
This is confirmed by directly comparing the line strengths for higher densities. However Figure 3 shows that at a He density of 10 even the 7th order of the expansion falls short of the correct line strength in the wings at 100 – 2000 Å by almost an order of magnitude. This plot also illustrates how the unified profile approaches the impact approximation close to the line core as discussed by Allard et al. (2006). At larger separations, i. e. for closer interactions, the deviations become severe, though the latter model at most wavelengths still matches more closely the correct line strength than the density expansion, especially in the red wing. At a few 100 Å separation we find the third order expansion to underestimate the absorption by a factor of more than 10, the 7th order still by about 4, but the Lorentzian profile by only 1 3. We can thus appreciate why the latter produces relatively better agreement with the observation.
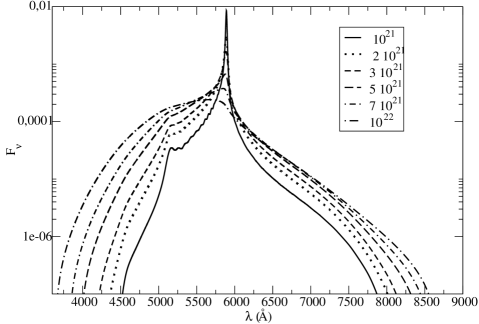
In Figure 4 we follow the further transformation of the line profile when proceeding to yet higher densities. Ultimately a merging of the line core and the satellite to the blue of the original line position emerges, increasing the opacity around 5000 Å by another factor of 10, while the red wing tends to asymptotically constant absorption which is actually fairly closely matched by the Lorentz profile (not shown). With these simulations we may now identify much, if not all, absorption shortward of the Na I line centre with the blue wing of the resonance line itself. Noting the sharp drop-off of opacity below 5000 Å we can also expect that not much of the profile is formed at He densities above 2 . It is tempting to trace the local flux minimum near 5000 Å to the contribution of the satellite feature at higher layers, which is still well defined up to 10, but an unambiguous identification should require both a full model atmosphere calculation incorporating these high density line shapes and observations at higher .
3. Discussion
We conclude that WD2356209 shows the effects of collisional damping at significantly higher perturber densities than encountered in the atmospheres of brown dwarfs. Detailed modelling of this object pushes broadening theory to new limits and thus provides a more stringent test of our calculations. This should advance our understanding of the physical conditions in ultracool, compact objects in general, and improve atmosphere models for brown dwarfs and other low-mass objects as well. Although these do not show such extreme broadening in the observable spectrum, the alkali lines provide significant opacity in the deeper layers of their atmospheres, thereby affecting the thermal structure at the convective boundary and possibly their cooling rate (I. Baraffe, priv. comm.). Study of ultracool white dwarfs like WD2356209 or SDSS J1330+6435 could thereby prove a test case for modelling the evolution of low-mass stars, brown dwarfs and giant planets.
Acknowledgments.
D. H. acknowledges support for attending the 15th European White Dwarf workshop, where this contribution was presented, under a travel grant from the Deutsche Forschungsgemeinschaft (DFG) under number KON 1082/2006, HO 2305/3-1. Atmosphere models presented in this work are based in part on calculations performed at the Gesellschaft für Wissenschaftliche Datenverarbeitung Göttingen.
References
- Allard et al. (2001) Allard, F., Hauschildt, P., Alexander, D., Tamanai, A., & Schweitzer, A. 2001, ApJ, 556, 357
- Allard et al. (2003) Allard, N. F., Allard, F., Hauschildt, P. H., Kielkopf, J. F., & Machin, L. 2003, A&A, 411, L473
- Allard et al. (2006) Allard, N. F., Allard, F., Johnas, C., & Kielkopf, J. 2006, submitted to A&A
- Allard et al. (2005) Allard, N. F., Allard, F., & Kielkopf, J. F. 2005, A&A, 440, 1195
- Allard et al. (1999) Allard, N. F., Royer, A., Kielkopf, J., & Feautrier, N. 1999, Phys.Rev.A, 60, 1021
- Burrows et al. (2000) Burrows, A., Marley, M. S., & Sharp, C. M. 2000, ApJ, 531, 438
- Dupuis et al. (1993) Dupuis, J., Fontaine, G., & Wesemael, F. 1993, ApJS, 87, 345
- Harris et al. (2003) Harris, H. C., Liebert, J., Kleinman, S. J., et al. 2003, AJ, 126, 1023
- Hauschildt & Baron (1999) Hauschildt, P. H. & Baron, E. 1999, J. Comp. Applied Math., 109, 41
- Homeier et al. (2005) Homeier, D., Allard, N., Allard, F., et al. 2005, in: ASP Conf. Ser. 334: 14th European Workshop on White Dwarfs, eds. D. Koester & S. Moehler (San Francisco), 209
- Koester et al. (2005) Koester, D., Napiwotzki, R., Voss, B., Homeier, D., & Reimers, D. 2005, A&A, 439, 317
- Kowalski et al. (2005) Kowalski, P. M., Saumon, D., & Mazevet, S. 2005, ASP Conf. Ser. 334, 203
- Oppenheimer et al. (2001) Oppenheimer, B. R., Hambly, N. C., Digby, A. P., Hodgkin, S. T., & Saumon, D. 2001, Science, 292, 698
- Salim et al. (2004) Salim, S., Rich, R. M., Hansen, B. M., et al. 2004, ApJ, 601, 1075
- Tsuji et al. (1999) Tsuji, T., Ohnaka, K., & Aoki, W. 1999, ApJ, 520, L119
- Wesemael & Truran (1982) Wesemael, F. & Truran, J. W. 1982, ApJ, 260, 807