Formation of Mn i lines in the solar atmosphere††thanks: Research supported by the International Max Planck Research School (IMPRS), Munich, Germany
Abstract
Context. We present a detailed NLTE analysis of 39 Mn i lines in the solar spectrum. The influence of NLTE effects on the line formation and element abundance is investigated.
Aims. Our goal is the derivation of solar values for manganese lines, which will later be used in differential abundance analyses of metal-poor stars.
Methods. The method of spectrum synthesis is employed, which is based on a solar model atmosphere with initially specified element abundances. A manganese abundance of dex is used with the theoretical line-blanketed model atmosphere. Statistical equilibrium calculations are carried out for the model atom, which comprises 245 and 213 levels for Mn i and Mn ii, respectively. Photoionization cross-sections are assumed hydrogenic.
Results. For line synthesis van der Waals broadening is calculated according to Anstee O’Mara’s formalism. It is shown that hyperfine structure of the Mn lines also has strong broadening effects, and that manganese is prone to NLTE effects in the solar atmosphere. The nature of the NLTE effects and the validity of the LTE approach are discussed in detail. The role of photoionization and collisional interaction is investigated.
Conclusions. Maximum NLTE corrections of +0.1 dex with respect to LTE profiles are found. We propose an absolute solar abundance of 5.36 dex. The main source of errors in the abundance calculations is uncertain oscillator strengths.
Key Words.:
Atomic data – Line: profiles – Sun: abundancesM. Bergemann, e-mail: mbergema@usm.lmu.de
1 Introduction
Manganese belongs to the iron-group elements, which have very complex but interesting atomic structure. Since lines in the synthetic spectrum of a star are based on the adopted model atom and the transitions included, the analysis becomes more and more complicated for elements with increasing number of levels and electrons. Construction of the model atom, usually done within a few days, becomes a matter of several months. It is necessary not only to collect all existing data and compare them, but also to assess their plausibility and necessity for the aims of current research.
These difficulties are, however, compensated by a beautiful pattern of lines in the spectrum, which results from fine and hyperfine transitions in ions of such elements. The Mn i lines are split into several components; this is a result of interaction of the electromagnetic field produced by the electrons with the magnetic momentum of the nucleus. The large hyperfine structure (HFS) of the lines overwhelms all other sources of line broadening. The width of a single Doppler line at 8400 Å in the solar atmosphere is 28 mÅ versus 40 mÅ of a HFS broadened line. Without question, it has to be accurately taken into account, otherwise serious errors appear in the calculation of element abundances (Abt Abt52 (1952); Prochaska & McWilliam Proch00 (2000); del Peloso et al. delPel05 (2005); Vitas & Vince VV03 (2003)).
It is interesting to study the manganese abundance in stars of different populations. In metal-poor stars the manganese abundance was found to be correlated with metallicity. A progressive deficiency of Mn relative to iron was first reported by Helfer et al. (Helfer59 (1959)) and later confirmed in analyses of other authors (Wheeler et al. Wheeler89 (1989); Gratton Gratton89 (1989); Nissen et al. Nissen00 (2000); Prochaska McWilliam Proch00 (2000)), right up to the most recent investigation of Sobeck et al. (Sobeck05 (2005)). This element is not produced in quasi-static nuclear burning processes; instead, it is accumulated from supernova explosions. Therefore, the variation of the abundance pattern of manganese with metallicity may indicate when and which stars (SN Ia, SN II), and which production processes of heavy elements started to contribute to the chemical enrichment of the Galaxy.
Aside from global implications for studies of stellar nucleosynthesis, manganese is an indicator of NLTE conditions in a stellar atmosphere. Mn does not contribute to stellar opacity, as compared to iron, and it does not significantly add to the pool of free electrons. More than 95% of manganese is ionized. Thus, Mn i can be regarded as a trace ion in a stellar atmosphere and studied under the NLTE assumption, which is necessary to describe lines formed high in the photosphere (Mihalas Athay Mihalas73 (1973)). Departures from LTE for the resonance line at 5394 in the Sun have been already found by Vitas & Vince (VV05 (2005)), although the nature of the NLTE effects was not investigated. Nissen et al. (Nissen00 (2000)) proposed that Mn abundances might be subject to NLTE effects due to overionization of Mn i caused by a strong radiation field.
The goal of the current analysis is to investigate in detail departures from LTE in and assess the plausibility of previous element abundance estimates for the Sun. There is an unresolved inconsistency between the abundance of Mn in the solar atmosphere (5.39 0.03) (Booth et al. 1984b ) and in CI Chondrites (5.50 0.03) (Lodders Lodders03 (2003)). It is not yet clear whether to attribute this to an incorrect allowance for HFS and NLTE effects in the calculation of the solar Mn abundance. The fit of photospheric and meteoritic abundances of the reference element Si is also very important in this context.
In Sect. 2 we give a short account of the method used and the full atomic model of Mn i including the choice of interaction processes. For the purpose of identifying the important levels and transitions, this section also presents two reduced models. Section 3 explores the resulting departure coefficients, line source functions, and the nature of the deviations from LTE. It also introduces their variation with photoionization and collision cross-sections. In Sect. 4 we dicuss the synthesis of the Mn i lines with due reference to HFS and NLTE results. The resulting solar manganese abundance is discussed.
2 NLTE calculations
2.1 Method
In our current atomic model the following processes are taken into account: photon absorption in line transitions, photoionization, excitation and ionization by collisions with free electrons, and neutral hydrogen atoms. All processes include their reverse reactions; in particular, bound-bound radiative transitions are assumed to follow complete frequency redistribution. It is known that under certain circumstances other interaction processes can also play a role, e.g. autoionization transitions, charge-transfer reactions or di-electronic recombination. No information about these processes is available for manganese, and in particular, autoionization resonances could well contribute to the depopulation of some Mn i levels.
In this work NLTE atomic populations were computed with a revised version of the program DETAIL (Butler Giddings Butler85 (1985)), which solves the radiative transfer and statistical equilibrium equations by the method of accelerated lambda iteration. We use a theoretical line-blanketed model of the solar photosphere MAFAGS-ODF, calculated with the MAFAGS code (Fuhrmann et al. F97 (1997)). This model atmosphere uses opacity distribution functions (ODF) taken from Kurucz (Kurucz92 (1992)). The resulting atmospheric stratifications of temperature and pressure are similar to those given by other comparable models (see comparison in Grupp Grupp04 (2004), Fig. 15). As is the case with all other line-blanketed atmospheric models of this type so far, we have not attempted to model the solar chromosphere.
2.2 Models of the Mn i atom
2.2.1 The reference model
In our reference model the manganese atom is constructed with 245 levels for Mn i and 213 levels for Mn ii, respectively. The system is closed with the ground state of Mn iii. The energies for these levels are taken from Sugar & Corliss (Sugar85 (1985)). We include all levels with for Mn i, for Mn ii, and with energies of 0.03 and 1.11 eV below the respective ionization limits. Such a relatively complete model should provide a very close coupling of the upper atomic levels to the next ion ground state. The number of lines treated in NLTE is 1261 for Mn i and 1548 for Mn ii.
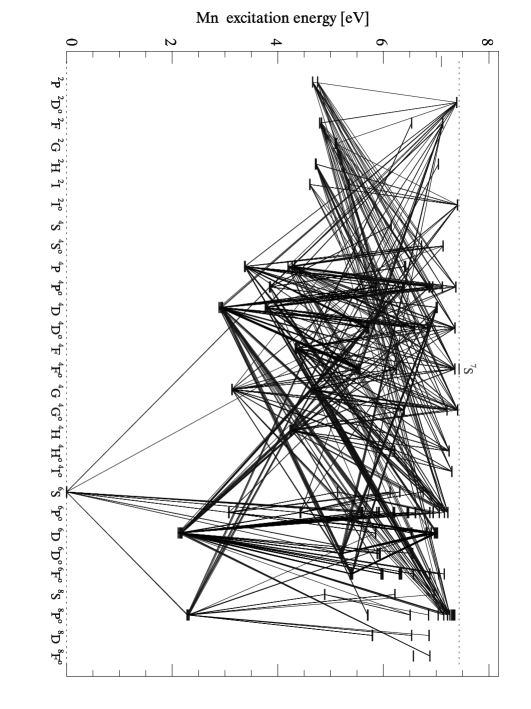
Wavelengths and oscillator strengths are all taken from Kurucz’s database (Kurucz Bell Kurucz95 (1995)). We note here that most of the lines do not require data that are more precise (in fact it will turn out that the available experimental f-values are not better than those provided by calculations). In a few cases of strong line blending in the terrestrial UV, we have tried to make sure that the calculated wavelengths are at the observed positions. Hyperfine splitting of the lines is not included in the statistical equilibrium calculations, since there is no reason to believe that the relative populations of these levels deviate from thermal. Moreover, for the uppermost terms above 7 eV the fine structure is not maintained. These terms are represented by a single level with a weighted mean of statistical weights and ionization frequencies of their fine structure levels. A complete grotrian diagram for Mn i is available online. The majority of radiative transitions in Mn i occurs between low excitation metastable and high excitation levels. Also, transitions starting from the metastable levels produce most of the lines, which we use in the spectrum analysis. Quite different from Fe i, the intercombination lines do not seem to form a tight coupling of the multiplets. Except for the calculation of the ionization equilibrium, the multiplets could therefore be calculated for themselves ignoring any multiplet interaction.
For bound-free radiative transitions we have to use hydrogen-like photoionization cross-sections (Mihalas Mihalas78 (1978)) because calculated data from the Opacity Project are not yet available. In our current analysis this may be the most uncertain representation. We conclude this in analogy to the Fe i atom, for which we found that the calculated photoionization cross-sections of Bautista (Baut97 (1997)) are orders of magnitude larger than hydrogenic approximations (Gehren et al. 2001a ).
Rates of transitions due to inelastic collisions with H i atoms are calculated according to Drawin’s formula (Drawin68 (1968), Drawin69 (1969)) in the version of Steenbock & Holweger (Steen84 (1984)). Drawin’s cross-sections are usually multiplied by a scaling factor , which often takes values much smaller than unity (see the review by Asplund Asplund05 (2005)). Thus, we decided to scale the rates of bound-bound and bound-free transitions by a factor of 0.05 in our reference model. For allowed transitions, the cross-sections for collisional excitation with electrons are calculated from the formula of van Regemorter (Reg62 (1962)). Forbidden transitions due to collisions with electrons are computed from the formula of Allen (Allen73 (1973)).
2.2.2 Reduced models
Our procedure of reducing the complexity of the model atom lies in a consecutive exclusion of those atomic levels that are suspected to cause the secondary NLTE effects, such as photon pumping or radiative recombination. These levels are identified in Sect. 3.1. The purpose is to find a model that represents the idealized case of the manganese atom, where deviations from LTE in level populations are exclusively due to one primary process. We will also be able to establish a minimum model that gives similar results as the reference one. As a by-product the time of computation could be significantly decreased.
As high-excitation levels provide an effective coupling to the continuum by means of collisions, it is tempting to exclude them in order to minimize the collisional interaction of Mn i and Mn ii. A first reduced model of Mn i thus includes all 145 levels with an excitation potential of less than 6.42 eV ( eV). The Mn i levels with and all levels of Mn ii, except the ground state, were excluded from the calculations.
Since the increase to 1 eV of the energy gap between both ions is not enough to ensure the dominance of radiative processes, and it does not lead to perceptible changes in the distribution of level populations (see next section), a second reduced model was calculated with only 65 levels () for Mn i, and an excitation potential of the uppermost level of 5.23 eV. Both types of reduced models in practice eliminate the complete doublet system except for the metastable states.
Whereas the above reduced model atoms are defined with respect to the excitation energies of the contributing levels, other models may exclude single multiplet systems, such as the doublet or the octet system. Note that statistical equilibrium requires a valid representation of such levels in order to calculate the ionization equilibrium. In the case of the doublet system it seems that it can be completely ignored because it contains only a few levels and all of them are highly excited. Also, there are no useful doublet lines in the solar spectrum. This is different with the octet system, which is also only loosely coupled to quartets and sextets. However, a significant fraction of the Mn i atoms is found here, in addition to some interesting solar lines.
Although we find that the number of levels (and lines) in both Mn i and Mn ii can be significantly reduced without changing the formation of the most important solar manganese lines, we have calculated all final results with the complete reference model from Sect. 2.2.1. The reduced models are therefore only used for direct investigation of critical processes.
3 Results
3.1 NLTE level populations
Departure coefficients for Mn i levels, calculated under different model assumptions, are presented in Figs. 1 and 2, where Fig. 1a shows the deviations from LTE for the reference atom. Each term is represented by one level because of the close coupling among the fine-structure levels. In order not to overload the figure, we have only entered a few selected levels which are typical for their depth dependence. As an example, the relative population of the ground state is very similar to that of the other metastable terms, , , and . The thick curves refer to levels of relatively low excitation; they are confronted with a number of highly-excited levels that show a very different behaviour. These levels deviate from the low-excitation levels following a trend that predicts more thermal or even superthermal populations the higher the excitation energies are.


In the deepest layers, for all levels (see Fig. 1a). Deviations from LTE develop between . At these depths the atmosphere becomes optically thin below the ionization thresholds of some low-lying levels, such as (), (), (), and (). The detailed balance is broken because processes of radiative ionization start dominating over recombinations, which depend on the local temperature. Depopulation of these levels is followed by a depopulation of the Mn i ground state. This is powered by strong collisional processes, which couple to the excited levels (essentially the metastable ones) and maintain the relative balance among them out to .
Radiation in the stronger lines also contributes to the redistribution in the atomic level populations. Line pumping takes action when the optical depth drops below unity in the wings of lines that belong to multiplets 21, 22 and 23 ( ). A strong non-local UV radiation field, , increases the photoexcitation rates, which are not compensated by the inverse rates of de-excitation. Hence, at the depths of line formation, below , populations of the upper levels for these transitions (, , ) are amplified relative to the ground state and adjacent low excitation levels. The line source functions are larger than .
The photon suction (Bruls et al. Bruls92 (1992)) effectively operates in the strong lines of multiplets 27 (transitions from to ) and 16 ( to ). This process can be understood as a successive radiative de-excitation of an atom through transitions with high probability in atmospheric layers where the mean intensity falls below , resulting in a net downward rate. This leads to a perceptible depopulation of the upper levels and , although the corresponding overpopulation of the lower levels is rather small.
Levels with an excitation energy above 6.5 eV are more closely linked to the continuum by means of collisions. For the majority of these high-excitation Mn i levels the processes of recombination will dominate instead, which is evident from their negative net ionization rates. The reason is that at large depths in the IR spectrum is smaller than . Lack of ionizing photons will result in an increased net recombination. Hence the levels will be slightly overpopulated, most of them remaining in detailed balance with .
3.2 Nature of the NLTE effects
It is clear from the analysis given in the previous section that there are several processes that take part in establishing the occupation numbers of Mn i and Mn ii levels. To identify the major cause of the non-equilibrium populations, we perform NLTE calculations applying various scaling factors to photoionization and collision cross-sections. In addition, we investigate how the completeness of the model atom affects the results.
3.2.1 Standard models


The reference atomic model of Mn i, as described in Sect. 2.2.1, was constructed with hydrogenic photoionization cross-sections and cross-sections for inelastic collisions with H i (both for b-b and b-f transitions) based on Drawin’s formula, but scaled by a factor . Comparison of the collision rates (H) and (e) shows that in the solar atmosphere for Mn i rates of collisions with electrons are on average greater by one order of magnitude. In order to test the influence of inelastic collisions with hydrogen, we carried out additional calculations for scaling factors from to (Fig. 1a-c). Naturally, with increasing rates of collisional excitations and ionizations by H i atoms departures get closer to unity, although perfect thermalization is not achieved with values for as low as 5.
The influence of photoionization was studied likewise, i.e., by means of performing NLTE calculations for various scaling factors to the cross-sections. For test purposes we have chosen to scale the Mn i cross-sections by factors , 300 and 5000. A plot of the resulting departure coefficients is presented in Fig. 1d-f. Absence of photoionization (Fig. 1d) does not restore LTE, as we could expect if the major and only NLTE mechanism were the overionization. Moreover, the results for zero photoionization cross-sections are virtually indistinguishable from those of the reference model (), while leads to slightly stronger deviations of from unity (Fig. 1e). When are increased by a factor of 5000 (Fig. 1f) the overionization is amplified and all Mn i levels are noticeably affected.
3.2.2 Reduced models
We consider reduced model atoms that are discussed in detail in this section. In Fig. 2 we show departure coefficients for two reduced models, one with 145 levels of Mn i and an excitation potential of the uppermost level of 6.42 eV ( eV), and one with 65 Mn i levels limited to 5.23 eV. For both models only the Mn ii ground state was considered. Note that due to the model reduction some of the high-excitation levels in Fig. 1 are no longer present.
Fig. 2a and b display the departure coefficients for the 146 level atom. As a result of a reduced recombination efficiency the remaining high-excitation levels (not shown here) are slightly less overpopulated, when compared to the NLTE populations calculated with the full atomic model. Fig. 2b shows calculated with zero photoionization. Most of the low-excitation levels are still underpopulated due to pumping processes combined with an efficient collisional coupling to the Mn ii ground state. It is only for the 66 level model atom that the domination of photoionization can be seen. Fig. 2c and d demonstrate the loss of the hydrogen collision efficiency in coupling to the Mn ii ground state. Here, removal of photoionization with drives the lower level populations towards LTE, at least in the line formation region. In the absence of photoionization the photon suction along the lines now results in an overpopulation of low-excitation Mn i levels that is balanced by net collisional ionization. Neglecting electron collisions (Fig. 2e and f) results in an even weaker coupling of the levels.
| No. | Mult. | Lower | Upper | Error | Source111References: (1) Booth et al. 1984a ; (2) Greenlee & Whaling Green79 (1979); (3) Blackwell & Collins Black72 (1972); (4) Woodgate Wood66 (1966); (5) Kurucz Kurucz88 (1988) | ||||||||
|---|---|---|---|---|---|---|---|---|---|---|---|---|---|
| [Å] | [eV] | level | level | [mÅ] | |||||||||
| 1 | 4055.513* | 5 | 4 | 2.13 | 136. | –0.070 | 0.1 | –0.15 | 0.0 | 5.250 | 1 | ||
| 2 | 4058.911* | 5 | 3 | 2.17 | 101. | –0.446 | 0.1 | –0.05 | 0.0 | 4.974 | 1 | ||
| 3 | 4070.264 | 5 | 3 | 2.19 | 70. | –0.950 | 0.1 | –0.06 | 0.06 | 4.460 | 3 | ||
| 4 | 4257.641 | 23 | 3 | 2.94 | 62. | –0.700 | 0.18 | 0.11 | 0.095 | 4.880 | 4 | ||
| 5 | 4436.342 | 22 | 3 | 2.91 | 71.3 | –0.288 | 0.04 | –0.21 | 0.07 | 4.972 | 1 | ||
| 6 | 4451.581 | 22 | 3 | 2.88 | 93. | 0.278 | 0.04 | –0.3 | 0.0 | 5.448 | 1 | ||
| 7 | 4453.001 | 22 | 2 | 2.93 | 53.5 | –0.490 | 0.04 | –0.165 | 0.08 | 4.815 | 1 | ||
| 8 | 4455.288 | 28 | 3 | 3.07 | 73. | –0.246 | 0.00 | 0.05 | 5.224 | 5 | |||
| 9 | 4457.010* | 28 | 3 | 3.06 | 50. | –0.555 | 0.1 | –0.185 | 0.06 | 4.730 | 1 | ||
| 10 | 4470.143 | 22 | 2 | 2.93 | 53.5 | –0.444 | 0.04 | –0.23 | 0.07 | 4.796 | 1 | ||
| 11 | 4490.067 | 22 | 2 | 2.94 | 56. | –0.522 | 0.04 | –0.16 | 0.065 | 4.788 | 1 | ||
| 12 | 4498.901 | 22 | 2 | 2.93 | 57. | –0.343 | 0.04 | –0.37 | 0.06 | 4.757 | 1 | ||
| 13 | 4502.220 | 22 | 2 | 2.91 | 59. | –0.345 | 0.04 | –0.37 | 0.05 | 4.755 | 1 | ||
| 14 | 4671.667* | 21 | 5 | 2.88 | 12.8 | –1.670 | 0.1 | –0.13 | 0.08 | 3.670 | 2 | ||
| 15 | 4709.705 | 21 | 4 | 2.88 | 72. | –0.340 | 0.04 | –0.35 | 0.06 | 4.780 | 1 | ||
| 16 | 4739.088 | 21 | 4 | 2.93 | 62. | –0.490 | 0.04 | –0.24 | 0.07 | 4.740 | 1 | ||
| 17 | 4754.021* | 16 | 5 | 2.27 | 146. | –0.086 | 0.04 | –0.16 | –0.04 | 5.224 | 1 | ||
| 18 | 4761.508 | 21 | 4 | 2.94 | 73. | –0.138 | 0.04 | –0.18 | 0.07 | 5.152 | 1 | ||
| 19 | 4762.358 | 21 | 5 | 2.88 | 108. | 0.425 | 0.04 | –0.36 | 0.0 | 5.535 | 1 | ||
| 20 | 4765.851 | 21 | 3 | 2.93 | 81. | –0.080 | 0.1 | –0.17 | 0.05 | 5.220 | 1 | ||
| 21 | 4766.413 | 21 | 4 | 2.91 | 98.5 | 0.100 | 0.1 | –0.23 | 0.0 | 5.340 | 2 | ||
| 22 | 4783.389* | 16 | 5 | 2.29 | 148. | 0.042 | 0.04 | –0.32 | 0.0 | 5.192 | 1 | ||
| 23 | 4823.460* | 16 | 6 | 2.31 | 149. | 0.144 | 0.04 | –0.32 | –0.03 | 5.294 | 1 | ||
| 24 | 5004.894 | 20 | 4 | 2.91 | 13.7 | –1.630 | 0.1 | –0.12 | 0.08 | 3.720 | 2 | ||
| 25 | 5117.913* | 32 | 3 | 3.12 | 24.2 | –1.140 | 0.1 | –0.05 | 0.08 | 4.280 | 2 | ||
| 26 | 5255.287* | 32 | 6 | 3.12 | 41.5 | –0.763 | 0.04 | –0.2 | 0.08 | 4.507 | 1 | ||
| 27 | 5394.619* | 1 | 6 | 0 | 79.5 | –3.503 | 0.1 | –0.115 | 0.105 | 1.852 | 1 | ||
| 28 | 5407.331* | 4 | 10 | 2.13 | 53. | –1.743 | 0.1 | –0.125 | 0.085 | 3.602 | 1 | ||
| 29 | 5420.265* | 4 | 9 | 2.13 | 85. | –1.462 | 0.1 | –0.06 | 0.09 | 3.948 | 1 | ||
| 30 | 5432.512* | 1 | 5 | 0 | 48. | –3.795 | 0.1 | –0.12 | 0.11 | 1.555 | 1 | ||
| 31 | 5470.560 | 4 | 8 | 2.15 | 57.5 | –1.702 | –0.04 | 0.085 | 3.728 | 5 | |||
| 32 | 5516.697* | 4 | 8 | 2.17 | 44. | –1.847 | 0.1 | –0.02 | 0.085 | 3.603 | 1 | ||
| 33 | 5537.692 | 4 | 5 | 2.18 | 36. | –2.017 | –0.02 | 0.085 | 3.433 | 5 | |||
| 34 | 6013.465 | 27 | 6 | 3.06 | 87. | –0.251 | 0.1 | –0.285 | –0.015 | 4.934 | 1 | ||
| 35 | 6016.586 | 27 | 6 | 3.06 | 97.8 | –0.216 | –0.145 | –0.05 | 5.109 | 5 | |||
| 36 | 6021.727 | 27 | 6 | 3.06 | 96.8 | 0.034 | 0.1 | –0.27 | –0.07 | 5.234 | 1 | ||
| 37 | 8700.877 | 49 | 10 | 4.41 | 11. | –0.477 | –0.058 | 0.1 | 4.935 | 5 | |||
| 38 | 8703.559 | 49 | 11 | 4.41 | 15.5 | –0.328 | –0.057 | 0.1 | 5.085 | 5 | |||
| 39 | 8740.705 | 49 | 13 | 4.42 | 26. | –0.055 | –0.09 | 0.09 | 5.325 | 5 |
3.2.3 Discussion
The behaviour of Mn level populations, strongly deviating from LTE, can not be explained simply in terms of photoionization or collisions, as was succesfully done for other elements submitted to an NLTE analysis. Our results show that hydrogenic b-f radiative cross-sections for the Mn i levels of 3 to 4 eV excitation are too small to ensure the dominance of photoionization, which is the main NLTE effect for many metal-group elements. These levels usually dominate the ionization balance in such ions because in the atmospheres of solar-type stars their photoionization edges lie in regions where the radiation field is intense enough and the radiative rates prevail over collisional rates. For instance, the Opacity Project calculations (Bautista Baut97 (1997)) give evidence for neutral iron cross-sections, which are 10 to 1000 times larger than the hydrogenic ones. This could explain the nearly identical behaviour of Mn departure coefficents for and . Kramers’ approximation for Mn i gives a lower limit for the cross-sections, which is comparable in its influence on populations to the absence of photoionization. Thus, a very large enhancement to is required in order to force the dominance of this process in establishing the occupation numbers of Mn i and Mn ii levels.
The complexity of the Mn i atomic system with its large number of levels produces some additional complications for NLTE calculations. There are many doubly excited (DE) configurations, which, in contrast to those of single excitation (SE), can not be treated in hydrogenic approximation. The use of Kramers’ formula with principal quantum number for all atomic levels is an obvious simplification: DE and SE configurations of neighbouring excitation energies but different will have strongly differing photoionization cross-sections, which scale with inverse fifth power of the principal quantum number. Furthermore, the b-f collision cross-sections, calculated using the radiative b-f cross-sections, will differ for these neighbouring levels by some orders of magnitude. The latter is important for the high-excitation levels whose b-f collision rates compensate radiative b-f rates from the low-excitation levels and in this way establish the statistical equilibrium of the model atom. As seen on Fig. 2c and d exclusion of the upper levels with 1 – 2 eV energy separation from the continuum, leads to a reduced recombination efficiency, and the Mn i atom could be identified as a member of the photoionization-dominated category.
One of the possible approaches is to use the effective principal quantum numbers of the levels. We have performed NLTE calculations for the photoionization cross-sections computed from Kramers’ formula with . The switch from principal to effective quantum numbers did not change the results significantly except that the uppermost levels are now coupled more tightly to the Mn ii ground state at the line formation depths. Also, the whole atomic system became more sensitive to the enhancement of photoionization cross-sections, but levels that produce the lines of interest in our research were not affected. This solution may be more appropriate for very complex atomic systems, such as Mn, but at the same time it emphasizes the inadequacy of the hydrogenic approximation. This is, however, nothing new; it was also shown by Nahar & Pradhan (Nahar04 (2004)) that photoionization of excited levels of a non-hydrogenic ion may not be treated in hydrogenic approximation. As there is currently no alternative to the latter, we decided to preserve the hydrogenic photoionization cross-sections.
The incompleteness of the available data for the transitions in the Mn model atom presents another problem. There are more than 500 experimental levels reported for Mn i, 180 being above the lowest ionization limit (Johansson & Cowley Johan88 (1988)). Although the system of atomic levels seems to be complete, the case is somewhat different for the allowed transitions between them. In particular, there is no data in Kurucz’s database (Kurucz & Bell Kurucz95 (1995)), which we use in our analysis, for transitions that link the uppermost levels and levels of intermediate energies. Unfortunately, it is exactly these transitions that should couple the bulk of the overpopulated levels to the remaining underpopulated levels in our model.
In order to check the results obtained with the DETAIL code, we performed statistical equilibrium calculations for Mn using the independent NONLTE3 code, based on the method of complete linearization (Sakhibullin Sakh83 (1983)). The NONLTE3 atomic level populations are in close agreement with those from the DETAIL code. Hence, we do not associate the behaviour of the Mn atomic system with program errors. We suggest that the Mn i ion represents a complex mixed-domination case, where inelastic collisions with electrons and hydrogen atoms counteract photoionization and decouple the atomic system.
4 Synthesis of Mn i lines
Spectrum synthesis is employed to determine the abundance of Mn in the solar atmosphere. We use our line analysis code SIU, which generates synthetic NLTE line profiles for computed level departure coefficients . For all elements, except Mn, we assume LTE.


The solar spectrum is calculated using the MAFAGS-ODF solar model atmosphere with K, an initial manganese abundance222Note that the atmospheric model of the Sun does not depend on the manganese abundance. of dex, and a constant microturbulence velocity km s-1. The profiles are broadened by a rotation velocity km s-1, and by a macroturbulence velocity km s-1. The observed spectrum is taken from the Kitt Peak Solar Flux Atlas (Kurucz et al. Kurucz84 (1984)). For the abundance analysis we originally selected 39 Mn i lines that satisfy the following conditions: they are relatively free from blends, and laboratory data for hyperfine splitting and oscillator strengths are available. Relative intensities of the HFS components are calculated according to the tables of White & Eliason (WE33 (1933)). Magnetic dipole splitting constants, , and electric quadrupole splitting constants, , of the corresponding levels are given in the online table. Van der Waals’ damping constants are computed according to Anstee O’Mara’s (Anstee95 (1995)) formalism; a correction of is applied in order to fit the wings of strong lines. We use oscillator strengths from various sources giving preference to measured values. All input parameters necessary to perform spectrum synthesis for the lines of interest are given in Table 1. Line profiles are computed under both LTE and NLTE assumptions; they are fitted to the observed profiles by means of manganese abundance variations. The logarithmic abundance differences of the fits with respect to the initial manganese abundance, , are reproduced in Table 1 (Col. 11). In this paper we refer to this parameter as abundance correction. The difference in abundances required to fit LTE and NLTE profiles is referred to as the NLTE correction (); it is given in Col. 12 of Table 1 for each line.
4.1 Line profiles
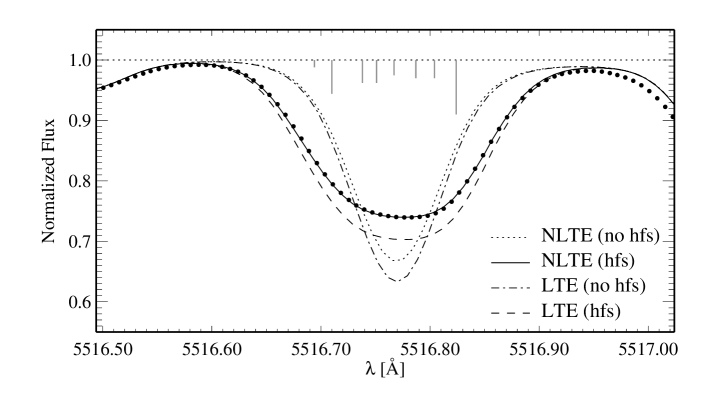
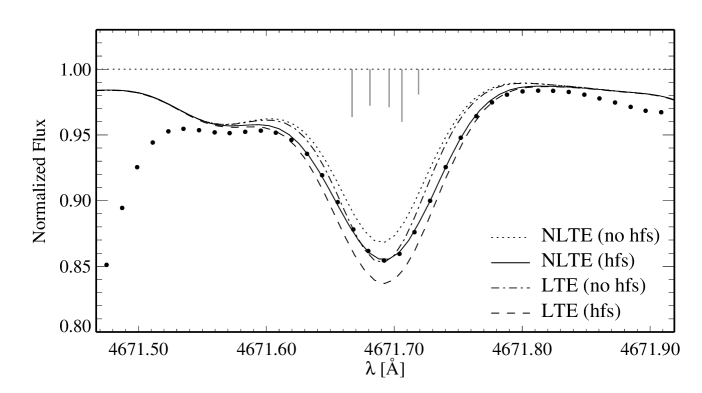
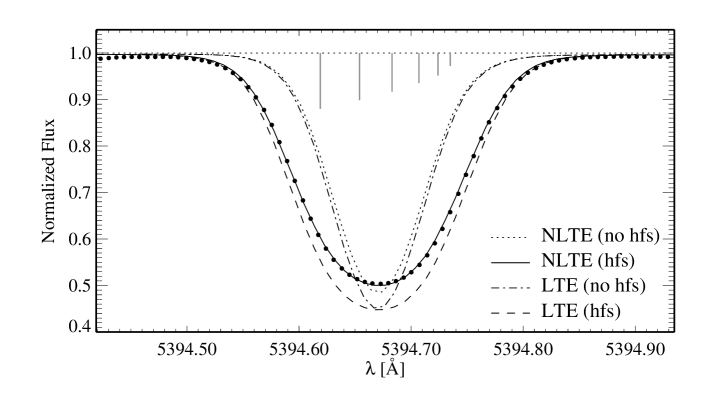
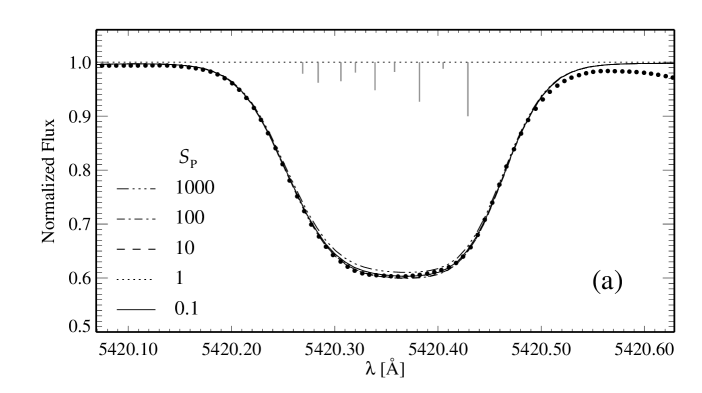
The computed profiles for selected lines are given in Fig. 3 together with the solar spectrum. For comparison we show profiles under LTE and NLTE conditions, with and without HFS. The examples on the left and on the right panel are representatives of two groups of lines that we were able to distinguish in the analysis.
The first group contains those lines, mainly weak with that are formed deep in the photosphere, in the layers with a strong gradient of the local temperature . The formation of lines under NLTE takes place at higher when compared to the case of LTE. As over the entire line formation depth, the line source function is larger than its LTE value, . Consequently, NLTE corrections will be positive due to decreased absorption over the entire line profile. In this case, both LTE and NLTE profiles will fit the observed lines, provided a certain abundance correction is performed. Of course, abundances obtained from the LTE profile fitting will be erroneous.
Stronger lines are formed within very large depth ranges. At the depths of line core formation the upper levels are depopulated more efficiently than the lower ones, . The source function drops below its LTE value, , which is driven by photon escape in the line wings. In the lower atmosphere, behaviour of the source function is inverted, i.e., . Accordingly, for the strongest lines (e.g., ) we observe an amplified absorption in the core and a decreased absorption in the wings relative to LTE. It is important that profiles computed under the LTE approach can not fit the observed lines due to their different profile shapes.
It is noteworthy that we succeeded to fit all lines in the list with a single value of microturbulence velocity . Although it is well-known that this parameter approximates a depth-dependent velocity field in the solar atmosphere, we decided to preserve a constant km s-1. Certainly, this assumption does not always give the best result: lines of intermediate strength require different values of the microturbulent velocity to fit the core and the wings simultaneously. We have not tried to adjust this value. Our analysis of the solar lines is mainly aimed at derivation of atomic and atmospheric data to be used in metal-poor stars, where only a single depth-independent value of can be recovered. Other asymmetries in the observed lines, such as red wing deficit or core skewness (as seen on all lines in the right panel), are a reflection of atmospheric inhomogeneities, which we can not take into account with our static plane-parallel models.
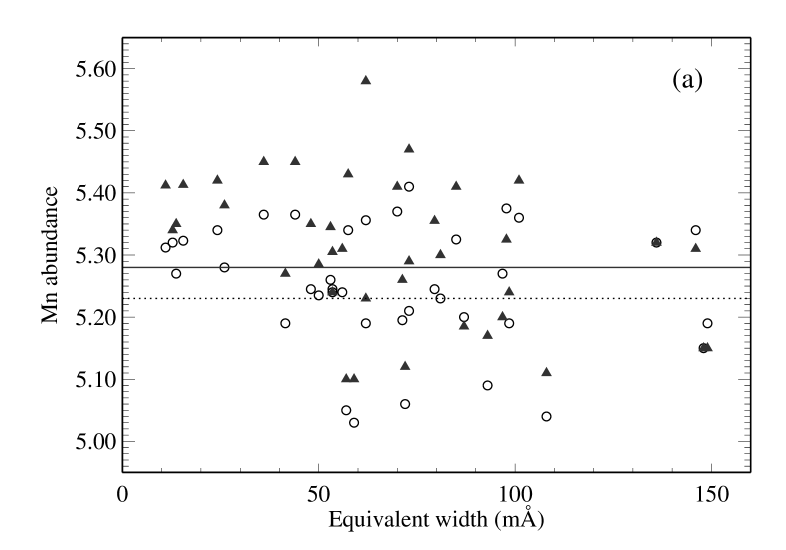
4.2 Solar abundance of Mn and oscillator strengths
The method of spectrum synthesis yields the product of the oscillator strength for a transition and the abundance of the element, . This parameter, as well as NLTE correction , and abundance correction , are given in Cols. 13, 12, and 11 of Table 1, respectively. Figure 4a shows NLTE and LTE abundances for all lines as a function of their equivalent widths. It is seen that the absolute abundances determined assuming LTE are lower than those derived with NLTE level populations. We find the weighted333All mean abundances in this paper are weighted according to the uncertainties in the -values for all lines; higher weights are assigned to lines with smaller errors mean NLTE and LTE abundances dex and dex. The standard deviations are quoted as errors.


It is important to note that there is no single set of measured oscillator strengths for all lines in our list. Data from five sources were used, and this undoubtedly reduces the precision of our results, leading to a large standard deviation of the mean abundance. As a test, we calculated the mean for each set of -values (Table 2). The result is a large spread of abundances from 5.23 to 5.46 dex, which is due to strongly discriminate oscillator strengths for the same lines measured by different authors. Indeed, for the majority of lines in our list the mean difference (Oxford – Kurucz) = 0.096 dex, (Oxford – Becker) = 0.09 dex. There is, surprisingly, much better agreement between the absolute oscillator strengths of Becker et al. (Becker80 (1980)) and Kurucz (Kurucz88 (1988)): the mean difference (Oxford – Becker) = 0.047 dex. We have, nevertheless, serious doubts about the accuracy of all measurements: the errors, quoted by the authors (0.04 to 0.1 dex), are much smaller than the actual differences between the -values from these sources.
Only 14 lines in our list (marked in the Table 1 with an asterisk) have consistent measured oscillator strengths. When only those lines are used, we obtain dex. When two obvious “outsiders” with dex from multiplet 16 are ignored, the abundance of manganese increases to dex. Despite its large standard deviation, this value based on only 12 lines is more reliable than the one calculated with all lines from our sample.
| Source of | Method | accuracy | |||
|---|---|---|---|---|---|
| [dex] | |||||
| 17 | 1 | beam foil | 25 | 5.35 | 0.07 |
| 20 | 2 | beam foil | 50 | 5.46 | 0.2 |
| 19 | 3 | laser excitation | 5.30 | 0.08 | |
| 25 | 4 | total absorption | 10 | 5.23 | 0.10 |
| 39 | 5 | calculations | 5.37 | 0.08 | |
| 39 | all | 5.28 | 0.11 |
| Mult. | |||||||
|---|---|---|---|---|---|---|---|
| [eV] | [dex] | ||||||
| 1 | 2 | 0.0 | –31.4 | 5.35 | 0 | 0.07 | |
| 4 | 5 | 2.14 | –31.41 | 5.42* | 0.04 | 0.14 | |
| 5 | 3 | 2.15 | –31.0 | 5.38 | 0.06 | 0.1 | |
| 16 | 3 | 2.3 | –30.8 | 5.20 | 0.09 | –0.08 | |
| 20 | 1 | 2.91 | –30.83 | 5.35 | 0.07 | ||
| 21 | 7 | 2.9 | –30.74 | 5.21* | 0.09 | –0.07 | |
| 22 | 7 | 2.92 | –30.67 | 5.21 | 0.10 | –0.07 | |
| 23 | 1 | 2.94 | –30.4 | 5.58 | 0.2 | ||
| 27 | 3 | 3.06 | –30.64 | 5.25* | 0.08 | –0.02 | |
| 28 | 2 | 3.07 | –30.7 | 5.40* | 0.13 | 0.12 | |
| 32 | 2 | 3.12 | –30.73 | 5.31* | 0.11 | 0.03 | |
| 49 | 3 | 4.42 | –31.6 | 5.40 | 0.02 | 0.12 |
As can be seen from Table 1, there is a large line-to-line spread of abundances. To investigate this we calculated mean abundances and standard deviations for each multiplet (Table 3). The abundances obtained with oscillator strengths from different sources are marked with an asterisk in the abundance column; these values are also weighted according to the errors in oscillator strengths. A plot of is shown in Fig. 4b. There is a large difference between for multiplets with eV and all other lines. It is interesting that a similar irregularity was noted by Blackwell et al. (Black82 (1982)) and Simmons & Blackwell (Simmons82 (1982)) from the analysis of Fe i lines in the solar spectrum. Lines with excitation energies 2.18 …2.2 eV gave lower abundances than lines with smaller or larger . Inaccurate damping parameters (Unsöld formula) or a vague dependence on the multiplicity of a term were suggested as the cause.
The only common feature between our analysis and the iron results is the use of oscillator strengths measured by the Oxford group. These laboratory data cover 61% of all lines in our list; in particular, abundances for multiplets 16 and 22 are calculated solely with values from Booth et al. (1984a ). Standard deviations for these multiplet abundances are no larger than in other multiplets, although Fig. 4c shows a weak correlation of abundances with the oscillator strengths, where the correlation coefficient is equal to –0.7. On this plot, abundances calculated using Booth et al.’s (1984a ) data are compared with those calculated with Kurucz’s data. The linear regression curves are shown for both sets. However, the observed behaviour could be a random variation misinterpreted for a trend, or it may be the consequence of incorrectly chosen damping parameters.
In order to test the influence of the Van der Waals damping we carried out spectrum synthesis calculations adjusting for each multiplet. The correction of this parameter was found from the requirement of obtaining equal abundances for weak and strong lines of a common multiplet; for all investigated multiplets averaged to –0.7 dex relative to the Anstee & O’Mara data, which is close to values predicted by the Unsöld formula. However, only the lines of intermediate multiplet numbers demonstrated a weak sensitivity to the Van der Waals damping (Fig. 4b): (16) dex, (21) dex, (22) dex, (27) dex. This is insufficient to explain the discrepancy of 0.2 dex between the abundances from lines of these multiplets and the others. Besides, it is not always possible to discern the influence of and on the line profiles. This is demonstrated in Fig. 5, where three combinations of both parameters, i.e., smaller abundance and larger damping, or larger abundance and smaller damping, lead to equally good fits. The difference between the profiles is visible only in the blend on the blue line wing. In our final estimate of the solar Mn abundance we decided to keep the Anstee & O’Mara damping parameters, even though they require a significantly smaller abundance for particular lines.

The discrepancy between the abundances (both NLTE and LTE) from different multiplets is hard to explain. We do not believe that errors in damping could be as large as this, neither with confidence can we attribute this to errors in the oscillator strengths. It is interesting that a similar result was obtained for Mn i lines by the other authors. Lines that give a strong underabundance in our analysis also have smaller relative to the average value in the work of Becker et al. (Becker80 (1980)). Booth et al. (1984b ) also distinguished two groups of lines based on the lower excitation potential: the 0 eV lines, which show considerably higher abundance, and those between 2 – 3 eV with lower abundances, but are sensitive to damping enhancement. To resolve this inconsistency we need new quality measurements of oscillator strengths and, perhaps, a depth-dependent microturbulence or a 3D hydrodynamical model.

Unfortunately, we can not solve the main problem: there is a strong inconsistency between the solar photospheric abundance of Mn and a meteoritic value of dex (Lodders Lodders03 (2003)). Quite on the contrary to the expectations, every subsequent analysis with more precise atomic data and model assumptions gives progressively decreasing . Generally, high values that are consistent with the meteoritic abundance (e.g., Greenlee Whaling Green79 (1979); Becker et al. Becker80 (1980)) result from erroneous oscillator strengths, neglect of HFS, an LTE approach (our work is the first NLTE analysis), and/or unaccounted blends. For instance, Greenlee Whaling (Green79 (1979)) used only six lines with , assuming that there are no unrecognized blends in the solar spectrum and neglecting HFS. Yet, we have found that four of these six lines contain blends, we therefore ignored them for our analysis. The most recent and commonly used LTE abundance of Mn ( dex) is that of Booth et al. (1984b ). It is also rather low, hence the authors suggested that NLTE effects could be the cause of methodical errors. Indeed, NLTE effects of Mn i in the Sun are significant, but they only increase the existing discrepancy. Even if only the weak lines with are used, which are relatively insensitive to the keystones of the abundance analysis (damping, model structure, HFS, microturbulence), we obtain a weighted NLTE abundance of 5.37 0.06 dex. The incorrect abundance of the reference element Si may be the cause. Some authors compare the abundance of manganese with that of iron. The recent NLTE estimate is dex (Gehren et al. 2001b ). If we adopt this value, a ratio Fe/Mn = 148 is derived; it is significantly larger than Fe/Mn = 89 in CI chondrites (Cameron Cameron73 (1973)). Perhaps, as suggested by Booth et al. (1984b ), the chemical composition of CI meteorites does not fully represent the composition of the proto-Sun.
To investigate the ionization equilibrium of manganese, we have tried to determine the abundance from Mn ii lines. Martinson et al. (Martinson77 (1977)) claim that Mn ii lines can be used to obtain the same photospheric solar abundance as found from Mn i lines. From equivalent width measurements of 9 lines of ionized manganese these authors have calculated dex. We have checked the solar spectrum of Mn ii and found that no lines are suitable for any of the abundance determination methods. All lines strong enough to be discerned in the solar spectrum are located in the near-UV, and are heavily blended, which complicates the continuum placement. We have, nevertheless, synthesized these lines under the assumption of LTE: all lines of interest have saturated cores, i.e. the variation of the abundance within 0.2 dex affects only the strength of the wings. Thus, due to the presence of strong blends in the line wings, no conclusion can be made about the true abundance. For the line at 3488 the effect of HFS was investigated (see Fig. 6). Data for the levels involved in this transition were taken from Holt et al. (Holt99 (1999)). Hyperfine structure broadens the profile and leads to a better fit of the inner wings provided the microturbulence is reduced to km s-1. Its effect is very significant: a line profile calculated with no HFS and dex is equal to a profile with 2 HFS components and dex. Hence, abundances for the Mn ii lines calculated without accounting for HFS can easily be overestimated by 0.2 dex. Our results bring into perspective the conclusions of Martinson et al. (Martinson77 (1977)) : the neglect of HFS in their calculations is, most likely, responsible for an overestimated abundance of manganese. At the same time, the comparison of abundances derived from two ionization stages of manganese turns out to be an unreliable technique. It should be performed with caution.
4.3 Uncertain parameters
4.3.1 Photoionization and collisions with H i atoms
We performed NLTE calculations with various scaling factors for photoionization and collision cross-sections. The effect on the departure coefficients is described in detail in Sect. 3.2. Here we show how changing these parameters affects the line profiles and the resulting abundances.
The behaviour of profiles for different scaling factors to hydrogenic photoionization cross-sections is shown in Fig. 7a. The difference in the profiles is only marginal: maximum abundance corrections amount to -0.04 dex with increasing from 0 to 1000. This effect was confirmed with twelve lines. We conclude that the photoionization cross-sections are not crucial in abundance calculations as long as very large enhancements (by a few orders of magnitude) to hydrogenic cross-sections are avoided.

A similar test was performed for collisions with H i atoms, the parameter usually considered the most uncertain in NLTE calculations. Scaling factors and were applied to b-b and b-f cross-sections computed from Drawin’s formula. The NLTE profiles of the line at 6016 are presented for five different assumptions in Fig. 7b. As expected, with increasing rates of collisional excitation and ionization by H i atoms, the NLTE profile approaches LTE. However, the actual correction to the abundance is rather small: for ten lines investigated it does not exceed 0.06 dex for . Neglect of hydrogen collisions (not shown here) requires a reduction of the abundance by 0.01 dex. According to the results of Belyaev & Barklem (Belyaev03 (2003)), Drawin’s formula () strongly overestimates the rate of transitions due to collisions with H i. Therefore, this scaling factor is already too large, and we conclude that the magnitude of uncertainty concerned with the choice of is not much larger than 0.05 dex.
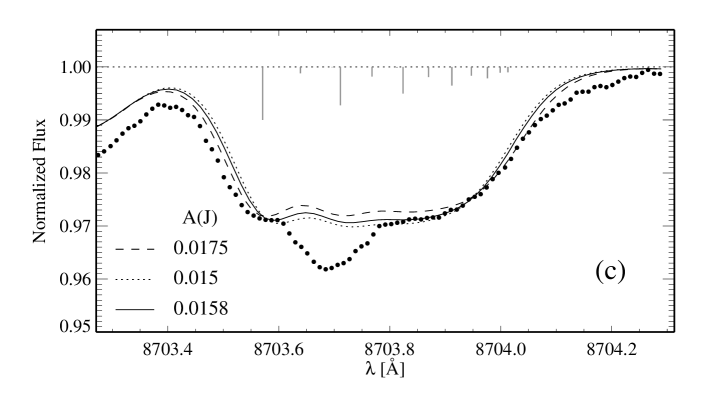
4.3.2 Hyperfine splitting data
The sensitivity of lines to uncertainties in the hyperfine splitting data was investigated (Fig. 7c). It is seen that differences in the 8703 line profiles computed for cm-1, cm-1, and cm-1 are rather small. These differences correspond to an abundance correction of 0.02 dex. A notable change in the profile is found only when is modified by more than 4 mK ( cm-1). However, the precision of measurements that we use is very high; the average error is 0.5 mK. We have tested other lines, including those with saturated cores, varying the value for the corresponding levels by 2 mK. In this case, the relative shift of the components leads to dex. We conclude that due to the much stronger influence of the other parameters (, ), uncertainties in HFS data do not affect the resulting abundances. However, correcting the value may in a few cases help to obtain a better fit to the observed spectral lines.
The influence of HFS on line formation depths is interesting. The effect of including HFS on the position and width of formation layer for the weak resonance line 5394 was investigated by Vitas (Vitas05 (2005)). The main result was that the line was formed higher in the photosphere when HFS was not taken into account. We have tested this observation on a sample of lines with different and values; their depths of formation computed with and without HFS are given in Table 4. These are average depths of NLTE line formation calculated with the contribution function to the total emergent radiation according to Achmad et al. (Achmad91 (1991)).
| [Å] | , [] | HFS | no HFS | wing | , K |
|---|---|---|---|---|---|
| 5394.67 | 78 | -0.7 | -1.4 | -0.18 | 420 |
| 5432.51 | 48 | -0.57 | -0.86 | -0.19 | 259 |
| 4055.54 | 136 | -2.43 | -2.68 | 0.05 | 57 |
| 4058.93 | 101 | -1.88 | -2.14 | 0.05 | 63 |
| 4070.28 | 70 | -0.88 | -1.10 | 0.05 | 135 |
| 6013.50 | 87 | -1.03 | -1.41 | -0.26 | 190 |
| 6016.64 | 98 | -1.18 | -1.51 | -0.26 | 137 |
| 6021.80 | 97 | -1.68 | -1.84 | -0.26 | 46 |
Both for strong and weak lines the depth of core formation decreased when hyperfine splitting was neglected in line synthesis. The corresponding shift in local temperatures is given in the last column. We note that the formation of weaker lines takes place at significantly higher . For instance, the resonance line at 5394.67 with 6 HFS components is formed in the layer with K, rather than in the layer with K (depth of formation for the same line with a single component). This result shows that weak lines are to a greater degree affected by inclusion of HFS in line synthesis, compared to stronger lines.
5 Conclusions
The NLTE formation of Mn i lines in the solar atmosphere is rather complex. Our results indicate that manganese belongs to a class of mixed domination atoms, where several channels compete in establishing non-equilibrium level populations. However, in our model neither of the processes can be regarded as a dominating type: in particular, the absence of photoionizations does not restore an LTE distribution of populations. We suggest that the photoionization inefficiency is the simple result of too low cross-section approximations. Whether with or without quantum defect, the hydrogenic approximations deliver values roughly factors of 100 to 1000 lower than seen in comparable atoms for which better calculations are available (Fe, Si).
The depopulation of the Mn i ground state and low excitation levels in the absence of photoionization can be understood as follows: radiative transitions with strong optical pumping effects cause an overpopulation of the high-excitation levels with respect to the low-excitation levels. Due to the strong collisional coupling of the high-excitation levels with the Mn ii ground state, which is in LTE, the departure coefficients of these levels will be close to unity; consequently the departure coefficients of the low-excitation levels will drop significantly below unity. In the absence of the high-excitation levels, Mn i behaves as a photoionization-type ion. Disregarding inelastic collisions with electrons results in a weaker coupling of the levels to each other and a stronger deviation of line source functions from .
All levels that are involved in transitions of interest are underpopulated relative to LTE. Hence the NLTE assumption generally leads to an increase of the Mn i depth of line formation that forces a weakening of the lines. However, for every particular line the ratio of the upper and lower level population, determined by an interplay of the above-defined NLTE processes, modulates the behaviour of the wings and cores, and hence the value and sign of NLTE corrections. For the weak and intermediate strength lines (), NLTE and LTE assumptions give a similarly good fit to the observations, provided a certain abundance correction is performed. The NLTE corrections for these lines are positive and amount to 0.1 dex. Formation of the stronger lines () is characterized by an amplified absorption in the core and a decreased absorption in the wings, compared to LTE. NLTE corrections for strong lines are scattered around zero or negative.
The LTE analysis of Mn i has two pitfalls: the strong lines can not be reproduced due to different profile shapes, and abundances of the weak lines under LTE are overestimated. For this reason we do not recommend the commonly used solar LTE abundance dex, obtained by Booth et al. (1984b ). Instead, an NLTE abundance of 5.36 0.1 dex, determined from 12 lines of with relatively reliable oscillator strengths in the current analysis, is suggested. We consider abundances from other lines in our list as unreliable due to (1) high sensitivity of particular lines to (for multiplet 16 dex for ) and (2) inconsistent oscillator strengths between different sources. This result increases the discordance with the abundance of Mn in CI meteorites of 5.50 0.03 dex (Lodders Lodders03 (2003)).
The atomic parameters influence neither the line profiles nor the derived abundances significantly. The assumption of hydrogenic photoionization cross-sections leads to an overestimation of the abundance by 0.04 dex in comparison to the case when the enhancement factor of 1000 is applied. Despite the importance of the HFS, no significant errors associated with the choice of HFS data are expected in the analysis. The 0.5 mK accuracy of measurements produces an uncertainty of 0.01 dex in the abundance. Anstee O’Mara’s damping constants for stronger lines in some multiplets lead to abundances that are smaller than those obtained from the weaker lines. Adjustment of values inside each multiplet increases the average abundance by 0.03 dex. However, the discrepancy of 0.2 dex between the abundances from lines of multiplets 16, 21 and 22 and all other multiplets still remains. We can not with confidence attribute this to errors in damping or in the oscillator strengths. Two findings provide evidence for the latter: (1) correlation of abundances with the Oxford oscillator strengths and (2) similar regularity found by Simmons Blackwell et al. (Simmons82 (1982)) and Blackwell et al. (Black82 (1982)) in the analysis of solar Fe i lines with Oxford values. Collisions with neutral hydrogen atoms are able to thermalize the levels only if an enhancement factor , with respect to Drawin’s cross-sections, is applied. For the smaller enhancement factors, although the differences between NLTE and LTE profiles decrease, the abundance corrections do not exceed 0.05 dex. Total neglect of collisions with hydrogen requires a reduction of the abundance by 0.01 dex.
The main source of errors in this work is the uncertainties of measured oscillator strengths, which are inaccurate within a range of 0.04 to 0.1 dex. However, only the product of abundance and oscillator strengths will be used for studies of manganese in metal-poor stars, where deviations from LTE are expected to be large.
Acknowledgements.
MB acknowledges with gratitude the Max-Planck Institute for Extraterrestrial Physics (Germany) and IMPRS-Marie Curie Training Site for her PhD fellowship. MB thanks L. I. Mashonkina for valuable comments and discussions.References
- (1) Abt, A. 1952, ApJ, vol. 115, 199
- (2) Achmad, L., de Jager, C., Nieuwenhuijzen, H. 1991, A&A, vol. 250, 445
- (3) Allen, C. W. 1973, Astrophysical Quantities, 3rd ed., Athlone Press, London
- (4) Anstee, S. D., O’Mara, B. J. 1995, MNRAS, vol. 276, 859
- (5) Asplund, M. 2005, ARA&A, vol. 43, 481
- (6) Başar, G., Başar, G., Acar, G., Öztürk, I. K., Kröger, S. 2003, Phys. Scr., vol. 67, 476
- (7) Bautista, M.A. 1997, A&AS 122, 167
- (8) Becker, U., Kwiatkowski, M., Teppner, U., Zimmermann, P. 1980, J. Phys. B: Atom. Molec. Phys., vol. 13, 2505
- (9) Belyaev, A. K., Barklem, P. S. 2003, Phys. Rev. A, vol. 68, id. 062703
- (10) Blackwell, D. E., Collins, B. S. 1972, MNRAS, vol. 157, 255
- (11) Blackwell, D. E., Shallis, M. J., Simmons, G. J., 1982, MNRAS, vol. 199, 33
- (12) Blackwell-Whitehead, R. J., Pickering, J. C., Pearse, O., Nave, G. 2005, ApJS, vol. 157, 402
- (13) Booth, A. J., Blackwell, D. E., Petford, A. D., Shallis, M. J. 1984a, MNRAS, vol. 208, 147
- (14) Booth, A. J., Blackwell, D. E., Shallis, M. J. 1984b, MNRAS, vol. 209, 77
- (15) Brodzinski, T., Kronfeldt, H.-D., Kropp, J. R., Winkler, R. 1987, Z. Phys. D, vol. 7, 161
- (16) Bruls, J. H. M. J., Rutten, R. J., Shchukina, N. G. 1992, A&A, vol. 265, 237
- (17) Butler, K., Giddings, J. 1985, Newsletter on Analysis of Astronomical Spectra No. 9, University of London
- (18) Cameron, A. G. W. 1973, Space Sci. Rev., vol. 15, 121
- (19) Davis, S. J., Wright, J. J., Balling, L. C. 1971, Phys. Rev. A, vol. 3, 1220
- (20) del Peloso, E. F., Cunha, K., da Silva, L., Porto de Mello, G. F. 2005, A&A, vol. 441, 1149
- (21) Dembczyński, J., Ertmer, W., Johann, U., Penselin, S., Stinner, P. 1979, Z. Phys. A, vol. 291, 207
- (22) Drawin, H. W. 1968, Z. Physik, vol. 211, 404
- (23) Drawin, H.W. 1969, Z. Physik, vol. 225, 470
- (24) Fuhrmann, K., Pfeiffer M., Frank C., Reetz J., & Gehren T. 1997, A&A, 323, 909
- (25) Gehren, T., Butler, K., Mashonkina, L., Reetz, J., Shi, J. 2001a, A&A, vol. 366, 981
- (26) Gehren, T., Korn, A. J., Shi, J. 2001b, A&A, vol. 380, 645
- (27) Gratton, R. G. 1989, A&A, vol. 208, 171
- (28) Greenlee, T. R., Whaling, W. 1979, J. Quant. Spectrosc. Radiat. Transfer, vol. 21, 55
- (29) Grupp, F. 2004, A&A 420, 289
- (30) Handrich, E., Steudel, A., Walther, H. 1969, Phys.Lett. A, vol. 29, 486
- (31) Helfer, H. L., Wallerstein, G., Greenstein, J. L. 1959, ApJ, vol. 129, 700
- (32) Holt, R. A., Scholl, T. J., Rosner, S. D. 1999, MNRAS, vol. 306, 107
- (33) Holweger, H. 1979, in Les Eléments et leurs Isotopes dans l’Univers, 22nd Liège Symp., Liège, p. 117
- (34) Holweger, H., Mueller, E. A. 1974, Sol. Phys., vol. 39, 19
- (35) Johann, U., Dembczyński, J., Ertmer, W. 1981, Z. Phys. A, vol. 303, 7
- (36) Johansson, S., Cowley, C. R. 1988, J. Opt. Soc. Am. B, vol. 5, 2264
- (37) Kaulakys, B. 1985, J. Phys. B 18, L167
- (38) Kaulakys, B. 1986, Sov. Phys. JETP 64, 229
- (39) Kurucz, R. L., Bell, B. 1995, Atomic Line Data, Kurucz CD-ROM No. 23., Cambridge, Mass.: Smithsonian Astrophysical Observatory
- (40) Kurucz, R. L., Furenlid, I., Brault, J., Testerman, L. 1984, Solar Flux Atlas from 296 to 1300 nm. In Nat. Solar Obs. Atlas, Sunspot, New Mexico
- (41) Kurucz, R. L. 1992, Rev. Mexicana Astron. Astrofis., vol. 23, 45
- (42) Kurucz, R.L. 1988, Trans. IAU, XXB, M. McNally, ed., Dordrecht: Kluwer, p. 168
- (43) Lefèbvre, P.-H., Garnir, H.-P., Biémont, E. 2003, A&A, vol. 404, 1153
- (44) Lodders, K. 2003, ApJ, vol. 591, 1220
- (45) Luc, P., Gerstenkorn, S. 1972, A&A, vol. 18, 209
- (46) Martin, G. A., Fuhr, J. R., Wiese, W. L. 1988, J. Phys. Chem. Ref. Data, vol. 17, suppl. 3
- (47) Martinson, I., Curtis, L. J., Smith, P. L., Biémont, E. 1977, Physica Scripta, vol. 16, 35
- (48) Mashonkina, L. I., Gehren, T., Bikmaev, I. F. 1999, A&A, 343, 519
- (49) Mäckle, R., Griffin, R., Griffin, R., Holweger, H. 1975, A&AS, vol. 19, 303
- (50) Mihalas, D., Athay, R. G. 1973, ARA&A, vol. 11, 187
- (51) Mihalas, D. 1978, Stellar Atmospheres, 2nd ed., W. H. Freeman & Company, San Francisco, USA
- (52) Nahar, S. N., Pradhan, A. K. 2004, Radiation Physics and Chemistry, vol. 70, 323
- (53) Nissen, P. E., Chen, Y. Q., Schuster, W. J., Zhao, G. 2000, A&A, vol. 353, 722
- (54) Prochaska, J. X., McWilliam, A. 2000, ApJ, vol. 537, L57
- (55) Sakhibullin, N. A. 1983, Trudi Kazan gor. obs., 48, 9
- (56) Severino, G., Caccin, B., Gomez, M. T. 1993, Mem. Soc. Astron. Italiana, vol. 64, 565
- (57) Simmons, G. J., Blackwell, D. E. 1982, A&A, vol. 112, 209
- (58) Sobeck, J. S., Simmerer, J. A., Fulbright, J. P., et al. 2005, in ASP Conf. Ser. 336, Cosmic Abundances as Records of Stellar Evolution and Nucleosynthesis in honor of David L. Lambert, ed. T. G. Barnes III & F. N. Bash, p. 363
- (59) Steenbock, W., Holweger, H. 1984, A&A, 130, 319
- (60) Sugar, J., Corliss, C. 1985, J. Phys. Chem. Ref. Data, vol. 14, suppl. 2
- (61) Unsöld, A. 1955, Physik der Sternatmosphären, 2nd ed., Springer, Berlin
- (62) van Regemorter, H. 1962, ApJ, 136, 906
- (63) Vitas, N., Vince, I. 2003, Serb. Astron. J., vol. 167, 35
- (64) Vitas, N., Vince, I. 2005, Mem. Soc. Astron. Italiana, vol. 76, 1064
- (65) Vitas, N. 2005, Mem. Soc. Astron. Italiana, vol. 7, 164
- (66) Wheeler, J. C., Sneden, C., Truran, J. W., Jr., ARA&A, vol. 27, 279
- (67) White, H.E., Eliason, A.Y. 1933, Phys. Rev. 44, 753
- (68) Woodgate, B. 1966, MNRAS, vol. 134, 287
| No. | level | source | No. | level | source444References: (1) Davis et al. Davis71 (1971); (2) Dembczyńsky et al. Demb79 (1979); (3) Brodzinski et al. Brodz87 (1987); (4) Blackwell-Whitehead et al. Bl-Wh05 (2005); (5) Handrich et al. Handrich69 (1969); (6) Johann et al. Johann81 (1981); (7) Luc & Gerstenkorn Luc72 (1972); (8) Lefèbvre et al. Lefebvre03 (2003); (9) Başar et al. Basar03 (2003) | ||||||||
| 1 | 5 | 0.000 | -2.4 | 0.0 | 1 | 34 | 11 | 5.370 | 6. | 0.0 | 8 | ||
| 2 | 9 | 2.110 | 17. | 4.4 | 2 | 35 | 9 | 5.384 | 5.2 | 0.0 | 8 | ||
| 3 | 7 | 2.140 | 15.3 | 0.7 | 2 | 36 | 7 | 5.396 | 4.6 | 0.0 | 8 | ||
| 4 | 5 | 2.160 | 14.6 | –1.5 | 2 | 37 | 5 | 5.405 | 5.8 | 0.0 | 8 | ||
| 5 | 3 | 2.180 | 15.7 | –2.2 | 2 | 38 | 3 | 5.411 | 9.1 | 0.0 | 8 | ||
| 6 | 1 | 2.190 | 29.4 | 0.0 | 2 | 39 | 9 | 5.490 | 4.4 | 0.0 | 4 | ||
| 7 | 5 | 2.280 | 19.1 | 0.9 | 3 | 40 | 7 | 5.520 | 5.7 | 0.0 | 4 | ||
| 8 | 7 | 2.300 | 18.2 | –3.4 | 3 | 41 | 5 | 5.540 | 9.5 | 0.0 | 4 | ||
| 9 | 9 | 2.320 | 15.2 | 1.6 | 3 | 42 | 3 | 5.560 | 22.3 | 0.0 | 4 | ||
| 10 | 7 | 2.890 | –5.4 | 0.0 | 4 | 43 | 7 | 5.578 | 9.4 | 0.0 | 4 | ||
| 11 | 5 | 2.920 | –4.6 | 0.0 | 4 | 44 | 5 | 5.599 | 9.7 | 0.0 | 4 | ||
| 12 | 3 | 2.940 | 1.7 | 0.0 | 4 | 45 | 3 | 5.611 | 12.5 | 0.0 | 4 | ||
| 13 | 1 | 2.950 | 50.6 | 0.0 | 4 | 46 | 7 | 5.670 | 1.5 | 0.0 | 9 | ||
| 14 | 3 | 3.070 | 19.1 | 0.4 | 5 | 47 | 5 | 5.700 | 2.7 | 0.0 | 9 | ||
| 15 | 5 | 3.070 | 15.6 | –2.5 | 5 | 48 | 3 | 5.710 | 6.4 | 0.0 | 9 | ||
| 16 | 7 | 3.080 | 14.3 | 2.1 | 5 | 49 | 1 | 5.730 | 35. | 0.0 | 9 | ||
| 17 | 11 | 3.133 | 13.5 | 0.0 | 6 | 50 | 3 | 5.791 | 38.4 | 0.0 | 4 | ||
| 18 | 9 | 3.135 | 13.2 | 0.0 | 6 | 51 | 5 | 5.791 | 24. | 0.0 | 4 | ||
| 19 | 7 | 3.135 | 14.6 | 0.0 | 6 | 52 | 7 | 5.791 | 17.6 | 0.0 | 4 | ||
| 20 | 5 | 3.134 | 19.9 | 0.0 | 6 | 53 | 9 | 5.791 | 15.7 | 0.0 | 4 | ||
| 21 | 5 | 3.840 | –20.3 | 2.5 | 3 | 54 | 11 | 5.792 | 14.5 | 0.0 | 4 | ||
| 22 | 3 | 3.850 | –27.1 | –1.3 | 3 | 55 | 5 | 5.820 | –1. | 0.0 | 4 | ||
| 23 | 1 | 3.860 | –71.1 | 0.0 | 3 | 56 | 3 | 5.850 | –10. | 0.0 | 4 | ||
| 24 | 3 | 4.430 | –32.4 | 0.6 | 7 | 57 | 1 | 5.870 | –32.5 | 0.0 | 4 | ||
| 25 | 5 | 4.430 | –18. | –2.3 | 7 | 58 | 9 | 5.850 | 15.5 | 0.0 | 7 | ||
| 26 | 7 | 4.440 | –13. | –6.2 | 7 | 59 | 7 | 5.850 | 15.8 | 0.0 | 7 | ||
| 27 | 7 | 4.890 | 24.6 | 1.6 | 3 | 60 | 5 | 5.850 | 17.6 | 0.0 | 7 | ||
| 28 | 5 | 5.130 | 27. | 0.0 | 3 | 61 | 3 | 5.860 | 22.8 | 0.0 | 7 | ||
| 29 | 9 | 5.180 | 2.9 | 0.0 | 4 | 62 | 1 | 5.860 | 61.6 | 0.0 | 7 | ||
| 30 | 7 | 5.200 | 1.3 | 0.0 | 4 | 63 | 5 | 7.024 | –20.6 | 0.0 | 8 | ||
| 31 | 5 | 5.210 | –0.9 | 0.0 | 4 | 64 | 3 | 7.119 | –50.5 | 0.0 | 8 | ||
| 32 | 3 | 5.230 | –5. | 0.0 | 4 | 65 | 5 | 6.311 | 23.2 | 0.0 | 8 | ||
| 33 | 1 | 5.230 | –27.4 | 0.0 | 4 |