XMM-Newton temperature maps for five intermediate redshift clusters of galaxies
Abstract
We have analyzed XMM-Newton archive data for five clusters of galaxies (redshifts 0.223 to 0.313) covering a wide range of dynamical states, from relaxed objects to clusters undergoing several mergers. We present here temperature maps of the X-ray gas together with a preliminary interpretation of the formation history of these clusters.
keywords:
Clusters of galaxies , X-rays1 Introduction
There is clear evidence that clusters of galaxies are young structures, as predicted by the hierarchical scenario of CDM cosmology (e.g. Kauffmann & White, 1993; West et al., 1995). The study of cluster formation is paramount to our understanding of structure formation in the universe and clusters can effectively be used as cosmological probes (e.g., to measure the dark energy equation of state).
XMM-Newton now allows us to map with unprecedented sensitivity several physical parameters of the X-ray gas in clusters of galaxies. Temperature maps have revealed that even when the X-ray emission appears smooth, evidence for past or present merging events can be found; they are therefore precious tools to trace the individual histories of cluster formation and evolution.
We have analyzed XMM-Newton MOS1, MOS2 and pn data for a sample of five medium redshift (–0.313, corresponding to a mean lookback time of Gyr) clusters covering a range of merging histories, derived temperature maps for the X-ray gas and discuss merging scenarios for these clusters.
2 The data and temperature maps
| Cluster | Obs. nb | Initial exp. time (s) | Clean exp. time (s) | redshift |
|---|---|---|---|---|
| MOS1/MOS2/PN | MOS1/MOS2/PN | |||
| Cl 2137-2353 | 0008830101 | 21833/21834/17567 | 9714/ 9716/ 6039 | 0.313 |
| Abell 68 | 0084230201 | 29243/29259/22295 | 23750/22365/15573 | 0.255 |
| Abell 2390 | 0111270101 | 22223/22227/17985 | 9381/ 8861/ 6337 | 0.228 |
| Abell 1763 | 0084230901 | 25881/25898/19451 | 11996/12335/ 8444 | 0.223 |
| Abell 2744 | 0042340101 | 17390/17420/11581 | 13673/13627/ 9174 | 0.306 |
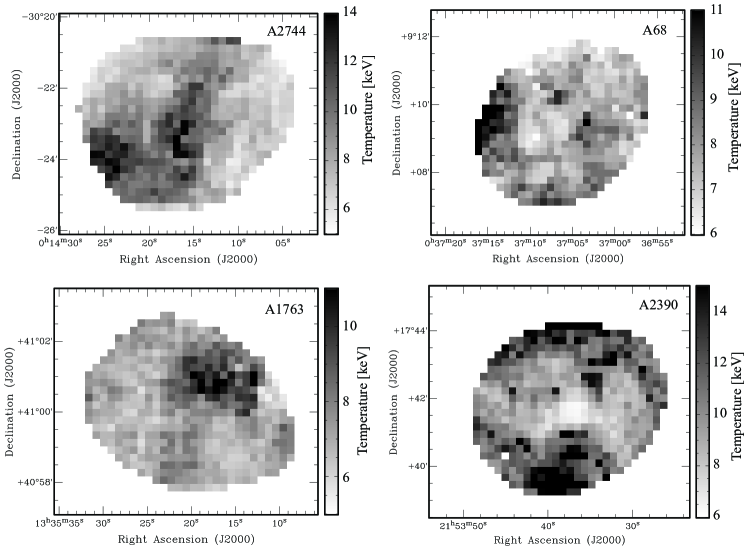
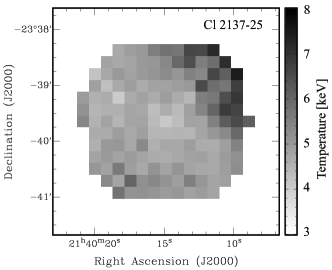
The data obtained with XMM-Newton (EPIC MOS1, MOS2 and pn) are summarized in Table 1. They were all retrieved from the XMM-Newton archive. The data were reduced in a standard way, and temperature maps were computed following the procedure described by Durret et al. (2005), with a main improvement which is the inclusion of pn data to MOS1 and MOS2 data. The event files are rebinned with a pixel size of arcsec2 and for each pixel in the grid we compute the RMF and ARF matrixes and fit a mekal plasma model using xspec version 11.2. We set a minimum count number of 900 counts per pixel after background subtraction. The hydrogen column density was always left free to vary (except for Abell 1763). The corresponding temperature maps are shown in Figs. 1 and 2. Typical relative errors, , for each pixel are 10–15% at significance level.
3 Discussion
The temperature map of Abell 68 appears quite constant throughout the cluster, with a mean temperature and metallicity of the X-ray gas of keV and Z0 for a hydrogen absorption . A hotter region observed towards the east edge of the map could possibly indicate a merger coming in from this direction. Little is known about this cluster, so we cannot reach firm conclusions on what is happening.
Abell 2390 has a mean temperature and metallicity of keV and Z0 for . The X-ray temperature of Abell 2390 is notably cooler in the center, with a large and somewhat hotter zone in the north region and a much hotter and more concentrated zone in the south, suggesting the previous existence of one or two mergers in the north south direction (possibly one coming from the north and one from the south).
Abell 1763 has a mean temperature and metallicity of keV and Z0 for (the absorption had to be fixed to its Galactic value, otherwise the X-ray spectra were impossible to fit). The X-ray temperature map is quite uniform, with a hotter region ( keV) towards the north west, suggesting a merger along the south east to north west direction.
Abell 2744 is a complicated cluster undergoing several mergers, as derived from XMM-Newton (Zhang et al. 2004, Finoguenov et al. 2005) and optical (Boschin et al. 2006) data. Its X-ray gas has a mean temperature and metallicity of keV and Z0 for . The temperature map reveals a hot elongated region crossing the cluster from north to south, and of a second hot region towards the south east, and the gas is rather hotter in the central region, in agreement with Finoguenov et al. (2005). The two hotter regions can be interpreted in a scenario of two successive major mergers, both coming from the south east, the central one being observed after the core passage, as suggested by Boschin et al. (2006). This agrees with the general picture proposed by Kempner & David (2004) but implies a more advanced merging phase than that derived by these authors.
Finally, Cl 2137-2353, has a mean temperature and metallicity of the X-ray gas of keV and Z0 (solar) for . The temperature map reveals a very homogeneous temperature throughout the cluster, except for a somewhat hotter region towards the north west. Therefore there is no clear evidence for any type of merging in this object.
4 Conclusions
Even clusters with a relatively relaxed appearance can be undergoing, or have undergone recently, one or several merging events, as revealed by X-ray temperature maps. Metallicity maps as well as optical (imaging and spectroscopy) and radio data, together with the comparison with numerical simulations, are now needed to disentangle the effects of mergers and characterize better the history of formation of these clusters.
Acknowledgements
We acknowledge financial support from the CAPES/COFECUB and CNES.
References
- [1] Boschin W., Girardi M., Spolaor M., Barrena R. 2006, A&A 449, 461
- [2] Durret F., Lima Neto G.B. & Forman W. 2005, A&A 432, 809, “An XMM-Newton view of the cluster of galaxies Abell 85”
- [3] Finoguenov A., Böhringer H. & Zhang Y.-Y. 2005, A&A 442, 827
- [4] Kauffmann G. & White S. D. M., 1993, MNRAS 261, 921
- [5] Kempner J.C. & David L.P. 2004, MNRAS 349, 385
- [6] West M.J., Jones C. & Forman W., 1995, ApJ Lett. 451, L5
- [7] Zhang Y.-Y., Finoguenov A., Böhringer H. et al. 2004, A&A 413, 49