Dewetting of a solid monolayer
Abstract
We report on the dewetting of a monolayer on a solid substrate, where mass transport occurs via surface diffusion. For a wide range of parameters, a labyrinthine pattern of bilayer islands is formed. An irreversible regime and a thermodynamic regime are identified. In both regimes, the velocity of a dewetting front, the wavelength of the bilayer island pattern, and the rate of nucleation of dewetted zones are obtained. We also point out the existence of a scaling behavior, which is analyzed by means of a geometrical model.
pacs:
PACS numbers: 68.43.Jk, 61.30.Hn, 81.10.AjLiquid films, once spread on a substrate, may break-up into droplets to lower the surface energy. Such a process is called dewetting. As for liquids, thin solid films may break-up into droplets. However two main differences may be pointed out. Firstly, solids exhibit strong surface anisotropy whereas liquids are usually isotropic. Secondly, mass transport mainly occurs via surface diffusion on solids at small scales, while it is mediated by hydrodynamics in liquids.
Dewetting of solid layers with sub-micron thicknesses was observed in recent experimental studies Jiran ; Yang2005 ; Krause . Spontaneous breakup of the film into dots can be analyzed within the frame of continuum models including an effective wetting potential, with surface energyGolovin , and elastic effectsGolovin2 . Moreover, the nonlinear dynamics of the edges of these layers Yang2005 ; wong ; barbe may also lead to the periodic formation of holes behind the dewetting rim.
For even thinner films, such as 1nm thick Ag on SiThuermer , one expects the discreteness of the underlying crystalline lattice to come to the fore. In order to investigate these effects, we study the dewetting of the thinnest possible layer: a monolayer. In order to focus on the basic processes, we discard effects related to substrate roughness, elastic interactions, or alloying. We focus on the case where dewetting occurs via the nucleation of holes, subsequently invading the whole film. This occurs in a well defined temperature window: if the temperature were too low the surface would be frozen; if it were too high –above the roughening transition– the film would be unstable and would break up into a microscopically disordered pattern.
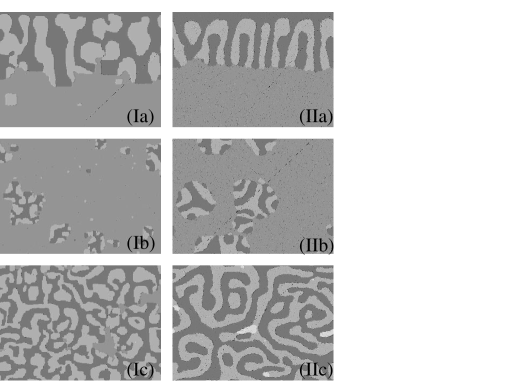
We show that monolayer dewetting proceeds differently from thicker layers dewetting. As shown on Fig.1, monolayers initially lead to a labyrinthine pattern of bilayer islands, which then slowly thicken into 3-layer, and then 4-layers islands, etc. Two different regimes for monolayer dewetting, henceforth denoted as regimes I and II, are analyzed. While both regimes exhibit the same temporal scaling behavior, their microscopic dynamics is qualitatively different.
We employ Kinetic Monte Carlo (KMC) simulations in order to mimic experiments with a minimum number of ingredients. We use a Solid on Solid model on a 2D square lattice, with lattice unit , and local height . The substrate surface, at , is perfectly flat and frozen. Epilayer atoms hop to nearest neighbor sites with the rates when , and when , with
| (1) |
where is a constant frequency, is the temperature (in units with ), is the number of in-plane nearest neighbors, is the bond energy, and is the adsorbate-substrate interface energy. When is large, the adsorbate minimizes the total energy by creating high islands with steep sides 111At low temperatures, the equilibrium island shape has a height a square base of lateral size , with .. When , the adsorbate wets the surface. We use periodic boundary conditions, and lattice sizes ranging from to . The initial condition is either: (IC1) a complete monolayer with everywhere, or (IC2) a monolayer with uncovered substrate () in a straight stripe (of width 10a). In all cases, the dewetting front invades the whole substrate, leaving a labyrinth of bilayer islands with a width in a denuded zone behind. In IC2, with small enough and , the dewetting front starts from the existing monatomic step and invades the monolayer at constant velocity , while in the other cases, holes are nucleated and closed fronts expand in the film.
Regime I is observed for low , and moderate . On a mono-atomic step which separates two bilayer islands, the density of kinks is then very low so that most of the time, there is no kink. Step motion then starts with the detachment of an atom with , at the rate , followed by a fast kink-zipping process, during which atoms at kink sites detach at a rate . 222The equilibrium concentration with islands on top of the monolayer is . Thus, the attachment rate of atoms to kinks is , the kink atom detachment rate. Therefore, backward kink motion is negligible. Since the step undergoes a total displacement at each zipping, the velocity is equal to the total detachment rate from a step segment of length
| (2) |
Since is small, islands grow in a irreversible fashion once a dimer is formed on the second layer. The rate of formation of dimers confined between two islands in a area is , where is the adatom density, and is the diffusion constant on the second layer. Such a mean field expression of is valid up to logarithmic corrections politi . Adatoms are produced in bursts during zipping processes, which last during a time , and . The probability of dimer formation during the zipping process is therefore: . For self-consistency, islands must be formed after the step has moved over a distance , so that , leading to
| (3) |
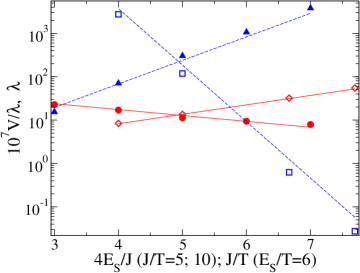
As seen in Fig.2, Eqs.(2) and (3) are in agreement with KMC simulations.
In regime II, temperature is higher, and mass exchange between mobile atoms and steps is fast, so that mass transport is limited by diffusion. Since the typical distance between the edge of the monolayer and the edge of the 2D islands on top of it is , one has
| (4) |
where is the concentration of adatoms on top of the monolayer in equilibrium with the atomic step separating and . From detailed balance, , and .
The separation is determined by the standard nucleation theory, valid at high temperatures. The Gibbs energy of a circular nucleus of radius is the same for islands or holes:
| (5) |
where is the line tension. Since for , nuclei with grow irreversibly. The island nucleation process in the vicinity of the dewetting front starts with a concentration in a typical area , and ends with in equilibrium with the newly formed island of radius . Mass conservation then imposes that , so that:
| (6) |
This relation is also valid for holes (we start from , and end with , and a hole of radius ). The island-hole nucleation symmetry is an important difference with the low temperature case. In simulations on Fig.1 IIa and 1 IIb, we indeed observe that both 2D islands and holes form in the vicinity of the dewetting front.
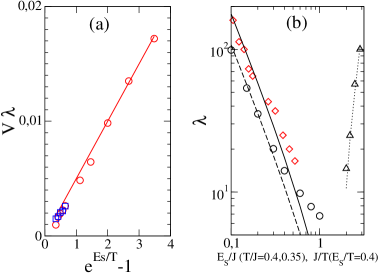
The front velocity and the island width obtained by simulations with IC2 agree well with theoretical expectation Eq. (4) and (6), as shown in Fig.3, at small . For large , holes will be nucleated in the bulk of a monolayer and evaluation of and is hindered. Therefore, we have also performed simulations where the motion of atoms with is forbidden. This prevents the formation of holes in the film. Fig.3 shows that simulation results with and without holes are in agreement with Eqs.(4) and (6). For the calculation of , we have used the expression of from the Ising model Rottman .
Having a fairly complete description of the motion of the dewetting front in regimes I and II, we shall now proceed with the analysis of nucleation and growth of Dewetted Zones (DZ) by means of a simple geometric model. In this model, DZs are nucleated with the rate and expand isotropically in the monolayer. The periphery of a DZ is initially a circle expanding with the constant velocity , which was determined above. While they grow, DZs will meet. The sum of the perimeters of the DZs if they did not see each other (i.e. the sum of the lengths of the circles) obeys
| (7) |
where is the number of DZs. Moreover, new DZs can only form outside pre-existing DZs, so that
| (8) |
where is the total area, and is the total area of the DZs. Because of the overlap of the growing DZs, the length of the frontier between the DZs and the monolayer is smaller than . In a mean field picture, we assume that , so that
| (9) |
Instead of analyzing the full solution of (7,8,9), we shall focus on the behavior of the uncoverage (the fraction of the substrate surface which is not covered). At short times, one finds:
| (10) |
and at long times . The saturation time , which separates these two regimes, may be defined as the time where is maximum. We find:
| (11) |
where . The time may be interpreted as the time needed for the dewetting process to invade the whole monolayer.
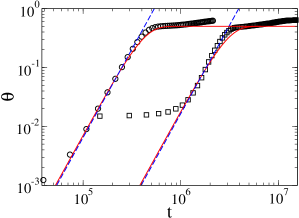
As shown on Fig.4, the -scaling behavior of is in agreement with the simulations, except for very short times, where originates from the thermal roughening of the monolayer. In the following, we shall see how from the simulations compares with Eq.(11). To do so, we need to derive the expression of .
In regime I, we resort to rate equations to describe the nucleation process. A hole of size N is denoted as a N-hole. The initial 1-hole concentration essentially results from adatom-pair formation, at rate , and annihilation, at the rate , so that
| (12) |
Let us denote the rate at which a -hole transforms into a ()-hole. The rates of size-decreasing transitions are related to the attachment of a mobile atom: . Other rates results from the detachment of a 3-neighbors atom: , or 2-neighbors atoms: . We only consider compact square 4-holes, because they are the most stable 4-holes unpublished . As a consequence, we also only consider -shaped 3-holes, which are the ones leading to square 4-holes. Assuming a steady-state, and following the standard Becker-Döring analysis, we obtain the hole formation rate:
| (13) |
which leads to
| (14) |
when . This regime correspond to a critical size of . Using Eqs.(2,3,14) in Eq.(11) leads to:
| (15) |
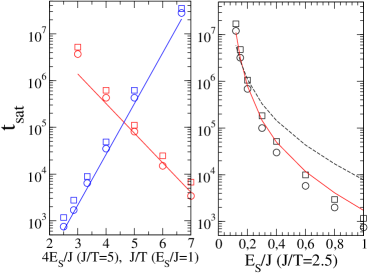
Fig.5a shows the agreement of Eq.(15) with the simulations. When , the critical size will be larger than 4, leading to deviations from (15)unpublished .
In regime II, the thermodynamic theory of nucleation applies Saito , and the formation rate of holes reads:
| (16) |
where is the value of at the critical island size , and , with , is the rate at which atoms attach to the hole when , and is the monolayer density. The concentration in the vicinity of the holes at the critical size should be at equilibrium, i.e. , so that . Thus, Eq.(16) leads to:
| (17) |
Upon substitution in Eq(11), and using (4,6) we find:
| (18) |
We have performed simulations at . From the Ising modelRottman , we find . The line tension at such high temperatures must be corrected in order to account for the non-ideal character of the 2D gas of adatoms around the cluster. Using the results of Ref.sethna , we find: 333The results of Ref.sethna are obtained in a strictly 2D model. The thermal roughness of the layer, which is reinforced when , is neglected here. Following Ref.sethna , one essentially needs to add a multiplicative factor to . Therefore, this should not strongly affect the temperature dependence of Eq.(6).. The high temperature limit is obtained when , i.e. when . The simulation results with reported on Fig.5 indeed agree with Eq.(18) for small .
Orders of magnitude may be obtained for the case of Au/graphite. Using Bahn2001 , Smith2006 , and a diffusion barrier Anton1998 , we find that we are in regime II, with min, and a at . Moreover, the dewetting of a nanometer-thick Ag/Si(111) Thuermer , lead to patterns similar to those obtained here in regime II, suggesting that our finding may be relevant for films with a small number of atomic layers. Quantitative experimental analysis of the dewetting process in various systems is still lacking though.
We have focused on the formation of the bilayer islands because this process determines the break-up time , and the initial lengthscale . The subsequent dynamics combines processes which have been separately studied in the literature: layer-by-layer thickening of the islandstosh , coupled to their sinteringevans-liu and Ostwald ripening. We hope to report along these lines in the future.
We acknowledge support from nanomorphogénèse ANR-PNANO grant, and from the computing facilities at CIMENT, Grenoble. YS acknowledges support from JSPS.
References
- (1) E. Jiran, C.V. Thompson, Thin Solid Film 208 23 (1992).
- (2) Bin Yang et al Phys. Rev. B 72235413 (2005).
- (3) B. Krause et al, J. Chem. Phys. 119 3429 (2003).
- (4) A. A. Golovin et al, Phys. Rev. B 70, 235342 (2004).
- (5) A. A. Golovin, S. H. Davis, P. W. Voorhees, Phys. Rev. E 68, 056203 (2003).
- (6) Wong et al Acta Mater 48 1719 (2000).
- (7) E. Dornel et al Phys. Rev. B 73 115427 (2006).
- (8) K. Thürmer, E. D. Williams, J. E. Reutt-Robey, Phys. Rev. B 68, 155423 (2003).
- (9) C. Castellano, P. Politi, Phys. Rev. Lett. 87, 056102 (2001).
- (10) C. Rottman, M. Wortis, Phys. Rev. B 24, 6274 (1981).
- (11) O. Pierre-Louis, A. Chame, Y. Saito, unpublished.
- (12) Saito, Statistical Physics of Crystal Growth, World Scientific, Singapore, (1996).
- (13) B. Krishnamachari et al, Phys. Rev. B 54, 8899 (1996).
- (14) R. Bahn, K. Jacobsen, Phys. Rev. Lett. 87, 266101 (2001).
- (15) R. Smith et al, Phys. Rev. B 73, 125429 (2006).
- (16) R. Anton, I. Schneidereit, Phys. Rev. B 58, 13874 (1998).
- (17) K. Thürmer et al, Phys. Rev. Lett. 87, 186102 (2001).
- (18) Da-Jiang Liu, J. W. Evans, Phys. Rev. B 66, 165407 (2002).