Strangulation in Galaxy Groups
Abstract
We use a cosmological chemodynamical simulation to study how the group environment impacts the star formation properties of disk galaxies. The simulated group has a total mass of M 8 1012 M⊙ and a total X-ray luminosity of LX 1041 erg s-1. Our simulation suggests that ram pressure is not sufficient in this group to remove the cold disk gas from a Vrot 150 km s-1 galaxy. However, the majority of the hot gas in the galaxy is stripped over a timescale of approximately 1 Gyr. Since the cooling of the hot gas component provides a source for new cold gas, the stripping of the hot component effectively cuts off the supply of cold gas. This in turn leads to a quenching of star formation. The galaxy maintains the disk component after the cold gas is consumed, which may lead to a galaxy similar to an S0. Our self-consistent simulation suggests that this strangulation mechanism works even in low mass groups, providing an explanation for the lower star formation rates in group galaxies relative to galaxies in the field.
Subject headings:
galaxies: kinematics and dynamics —galaxies: evolution —galaxies: stellar content —methods: numerical1. Introduction
Understanding the role environment plays in determining the star formation properties of galaxies remains one of the most important issues in galaxy evolution. Since the work of Hubble & Humason (1931), many studies have shown that clusters of galaxies contain a higher fraction of early-type galaxies (e.g., Oemler, 1974; Dressler, 1980) and fewer star forming galaxies (e.g., Balogh et al., 1997; Goto et al., 2003) than the field. Several physical mechanisms have been proposed to explain this trend. The most promising mechanisms fall into one of three broad categories: (1) mergers and interactions with other galaxies (e.g., Holmberg, 1941; Toomre & Toomre, 1972; White, 1978) and/or the cluster potential (e.g., Byrd & Valtonen, 1990; Moore et al., 1996; Bekki, 1999); (2) ram-pressure and/or viscous stripping of the cold gas (e.g., Gunn & Gott, 1972; Nulsen, 1982; Farouki & Shapiro, 1980; Fujita & Nagashima, 1999; Abadi et al., 1999; Quilis et al., 2000); (3) “strangulation” in which the warm and hot gas in the halo is stripped cutting off the supply of cold gas (e.g., Larson et al., 1980; Balogh et al., 2000; Bekki et al., 2002).
Recent observations suggest that star formation is also suppressed in some groups of galaxies (e.g., Zabludoff & Mulchaey, 1998; Wilman et al., 2005; Weinmann et al., 2006). While galaxy interactions and mergers are often assumed to play a dominant role in driving galaxy evolution in galaxy groups (e.g., Hickson et al., 1977; Carnevali et al., 1981; Ishizawa et al., 1983; Barnes, 1989), the recent observations of both X-ray and HI tails in nearby groups (e.g., Davis et al., 1997; Sivakoff et al., 2004; Machacek et al., 2005; Rasmussen et al., 2006; Bureau & Carignan, 2002) suggests other mechanisms may also be important. Unfortunately, most studies have concentrated on rich galaxy clusters, and much less is known about the mechanisms important in lower mass groups (e.g., Fujita, 2004; Roediger & Hensler, 2005; Hester, 2006; McCarthy et al., 2007). In this Letter we use a self-consistent cosmological chemodynamical simulation to demonstrate that strangulation can effectively suppress star formation in low mass groups.

| the group at | the target galaxy at | |||||||||
|---|---|---|---|---|---|---|---|---|---|---|
| aaThe definition of Kitayama & Suto (1996) | bbThe X-ray luminosity in energy range between 0.01-100 keV from the extrapolation of the modeled flux from the X-ray spectrum within r kpc, where is the radius of a sphere containing a mean density of 500 times the critical density of at . | aaThe definition of Kitayama & Suto (1996) | ccThe peak gas rotation velocity around the radius of 7 kpc. | |||||||
| () | () | () | () | (erg s-1) | () | () | () | () | (km s-1) | |
| 150 | ||||||||||
2. Method
The simulations were carried out using our original galactic chemodynamics code, GCD+ (Kawata & Gibson, 2003a, b; Kawata et al., 2006; Kawata & Rauch, 2007). GCD+ is a three-dimensional tree -body/smoothed particle hydrodynamics (SPH Lucy, 1977; Gingold & Monaghan, 1977) code (Barnes & Hut, 1986; Hernquist & Katz, 1989; Katz et al., 1996) that incorporates self-gravity, hydrodynamics, radiative cooling, star formation, supernova (SN) feedback, and metal enrichment. GCD+ takes into account chemical enrichment by both Type II (Woosley & Weaver, 1995) and Type Ia (Iwamoto et al., 1999; Kobayashi et al., 2000) SN and mass loss from intermediate-mass stars (van den Hoek & Groenewegen, 1997), and follows the chemical enrichment history of both the stellar and gas components of the system. The code also includes non-equilibrium chemical reactions of hydrogen and helium species (H, H+, He, He+, He++, H2, H, H-) and their cooling processes, following the method of Abel et al. (1997), Anninos et al. (1997), and Galli & Palla (1998). We use the UV background spectrum suggested by Haardt & Madau (2001), and take into account radiative cooling and heating due to heavy elements (Raymond & Smith, 1977; Cen et al., 1995).
The system which we focus on here is one of the simulated groups of galaxies in our “Virtual Group Catalog” (VGRC) project. The VGRC is an on-going numerical simulation campaign with a goal of simulating more than 30 groups with a range of masses and formation histories at high enough resolution to resolve the structures of the member galaxies. All groups in the VGRC are identified in cosmological simulations with a CDM cosmology (=0.24, =0.76, =0.042, , , and ) consistent with the measured parameters from three-year Wilkinson Microwave Anisotropy Probe data (Spergel et al., 2007). We use a multi-resolution technique to achieve high-resolution in the regions of the identified groups, including the tidal forces from neighboring large-scale structures. The initial conditions for the simulations are constructed using the public software LINGER and GRAFIC2 (Bertschinger, 2001). Gas dynamics and star formation are included only within the relevant high-resolution region, the surrounding low-resolution region contributes to the high-resolution region only through gravity. For this particular group simulation, the size of the high-resolution region is about 4.5 Mpc at , and the low-resolution region is a sphere with diameter of about 35 Mpc. Consequently, the initial conditions consist of a total of 1,234,583 dark matter (DM) particles and 783,424 gas particles. The mass and softening lengths of individual gas (DM) particles in the high-resolution region are () M☉ and 0.96 (1.61) kpc, respectively. The high-resolution region is chosen from a low-resolution simulation as the region within 4 times the virial radius of the identified group. The general properties of the group are summarized in Table 1. The simulation starts at , and the initial temperature and the fractions of hydrogen and helium species are calculated by RECFAST (Seager et al., 1999, 2000). We turn on the UV background radiation at (e.g., Fan et al., 2001). Modeling of SN feedback is the most uncertain part in numerical simulations of galaxy formation. In the VGRC project, we have chosen a relatively strong feedback model, where each SN yields the thermal energy of erg.
3. Results and Discussion
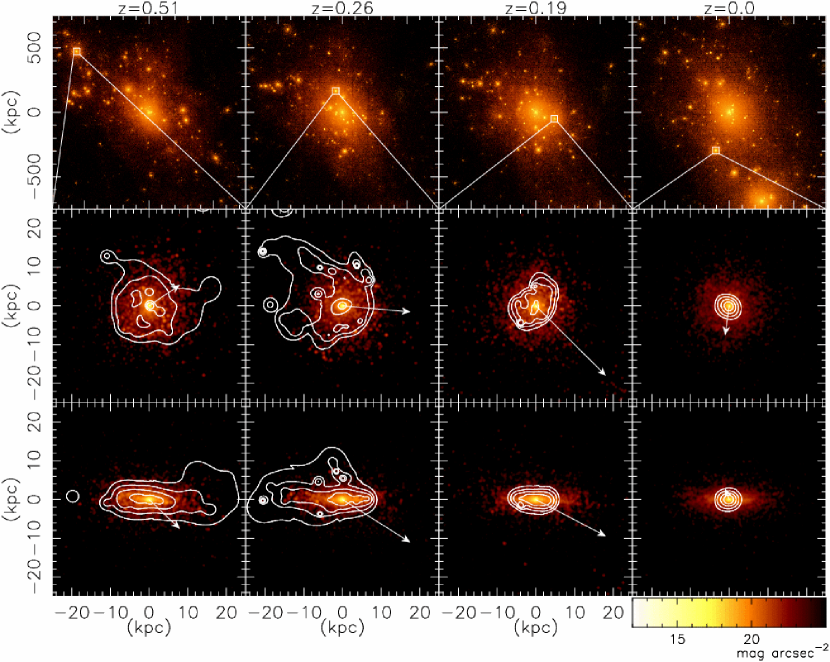
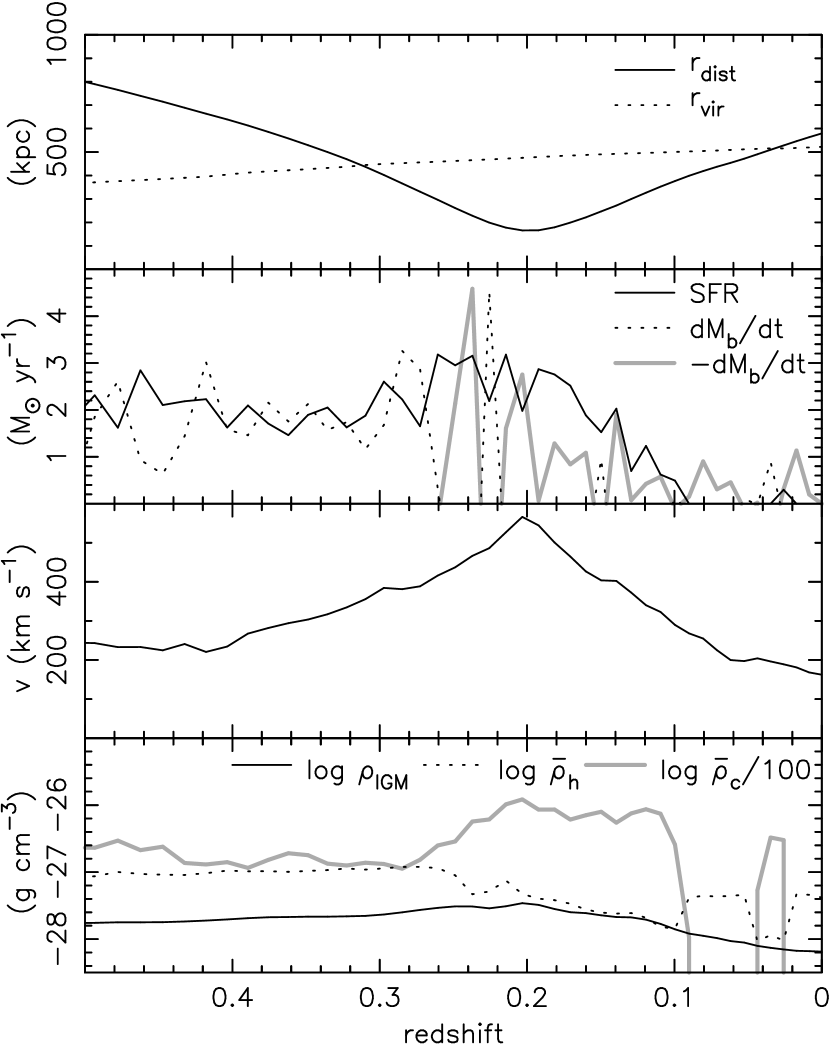
The results of the group simulation are summarized in Figures 1 and 2. The top panel of Figure 1 shows the evolution of the dark matter density of the simulated group since . To study how the star formation properties of galaxies are impacted by the group, we follow the evolution of a disk galaxy on its first passage through the group. The properties of this galaxy (hereafter referred to as the target galaxy) before it enters the group are summarized in Table 1. The middle and bottom panels in Figure 1 show face-on and edge-on views of the target galaxy, respectively. The contours give the surface density of the cold gas mass and the arrows show the velocity of the target galaxy with respect to the group velocity. Throughout the Letter, we define the cold (hot) gas as the gas with ().
The top panel of Figure 2 displays the time evolution of the distance of the target galaxy from the center of the group. From this panel it can be seen that the target galaxy first falls into the group (i.e. within the virial radius) around and makes its closest approach to the group center at z 0.2 before moving beyond the virial radius again by . The second panel in Figure 2 shows the star formation rate (SFR) in the target galaxy. Particularly noteworthy is the sharp drop in the SFR after the galaxy passes the group pericenter, with star formation effectively ceasing by . The sharp drop in the SFR after the galaxy enters the group suggests the group environment can effectively quench star formation even in relatively low mass groups.
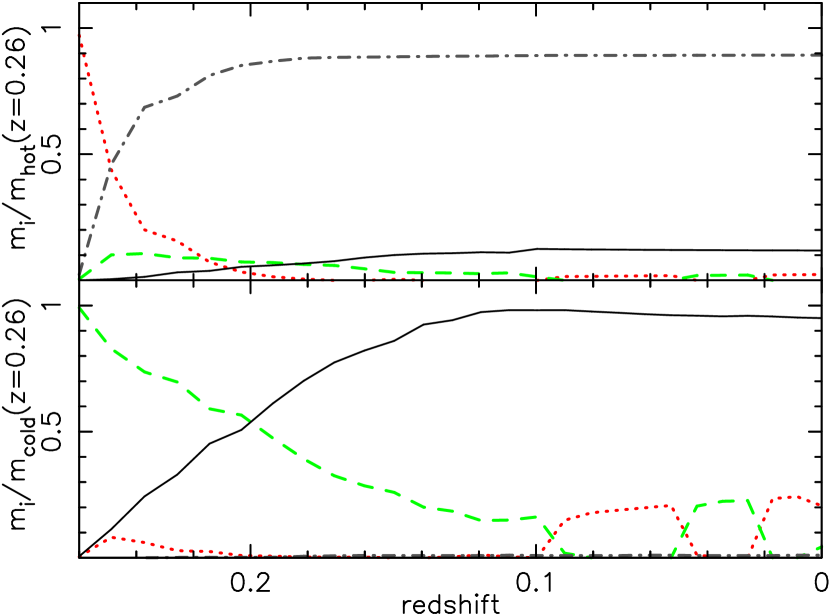
After the galaxy enters the group, the cold gas displays a clear tail morphology in the direction opposite of the galaxy’s motion (see the panel in Fig. 1). Such cold gas tails are often cited as evidence for ram-pressure stripping. To examine this possibility in our simulated group, we track the relative speed, , the hot gas density of the intra-group medium (IGM), , at the position of the target galaxy as a function of redshift (Fig. 2), from which the ram-pressure, P, can be calculated. In Figure 3, we compare the estimated ram-pressure at with the restoring force for the cold and hot gas particles within the target galaxy. Although the effect of ram-pressure, which should be time and spatial dependent, is more complicated than in the simulation, the figure provides a qualitative comparison and supports our results. Figure 3 demonstrates that the ram-pressure experienced by the target galaxy is well-below the amount required to strip the cold gas. We also examine how the fraction of the hot gas and cold gas particles within 30 kpc (an arbitrary choice to include the majority of the cold gas but avoid contamination from the IGM) of the target galaxy evolves from to . Figure 4 shows that virtually none of the cold gas escapes. Interestingly, even the particles in the cold gas tail at do not escape from the galaxy. Thus, we conclude that ram-pressure stripping of the cold gas component is not the cause of the downturn in the SFR.
However, the majority ( %) of the hot gas is indeed stripped since . In addition, a significant fraction of the hot gas is converted into cold gas. This suggests that hot gas halos are potentially an important source of cold gas in disk galaxies. Furthermore, since ram-pressure is strong enough to strip the hot gas (Fig. 3), the new supply of cold gas is cut-off. By almost all the cold gas has turned into stars and star formation ceases. This is also demonstrated in the second panel of Figure 2 which shows the net baryon mass-accretion and mass-loss rates of the target galaxy, i.e., simply the difference in the total baryon mass divided by the time between the simulation outputs. Before the target galaxy falls into the group, the mass-accretion rate is comparable to the SFR. However, the mass-loss due to the hot gas stripping becomes significant around , and the mass-accretion rate is no longer sufficient to sustain the SFR. Therefore, we conclude that star formation is quenched in the target galaxy because of “strangulation” (Larson et al., 1980).
Figure 2 shows some enhancement of star formation since . This suggests that the group environment somehow enhances star formation, which accelerates the strangulation process. The bottom panel of Figure 2 displays the hot and cold gas density in the target galaxy. The hot gas density decreases since due to the stripping and becomes close to the IGM density. On the other hand, the density of the cold gas where stars form significantly increases. One possibility is that the cold gas is compressed due to ram-pressure, which leads to enhanced star formation (see also Schulz & Struck, 2001; Bekki & Couch, 2003).
Recently, Agertz et al. (2007) have shown that the SPH scheme can underestimate fluid instabilities, such as the Kelvin-Helmholtz instability (KHI), which may be important for the stripping of cold gas (Nulsen, 1982; Mori & Burkert, 2000; Mayer et al., 2007). To test the impact of the KHI in our simulation, we follow Mori & Burkert (2000) to estimate the timescale of the KHI (i.e., ) for the target galaxy at when the hot gas stripping becomes significant. At kpc (an arbitrary choice close to a radius where the hot gas stripping is expected in Fig. 3), we find that Gyr ( M☉, g cm-3, and km s-1 at ). This is longer than the timescale of the strangulation process for the target galaxy, i.e., between and 0.1 ( Gyr). Hence, the KHI is not the dominant mechanism of the gas stripping for the target galaxy (see also Mayer et al., 2006; McCarthy et al., 2007). Note that the effect of KHI is more complicated than our simple estimate. Therefore, our simulation may underestimate the stripping mass.
It is worth noting that at the target galaxy is once again beyond the virial radius of the group, and still has no star formation. Although the target galaxy has consumed its cold gas disk via star formation by , the disk structure of the stellar component is still intact (Fig. 1). Therefore, the properties of the target galaxy are morphologically similar to those of an S0 galaxy. Thus, we suspect that strangulation may produce a populations of S0 galaxies (Larson et al., 1980) in and around poor galaxy groups. The current simulation suggests it would be interesting to more quantitatively compare a statistical sample of simulated galaxies with observed S0 galaxies in the future.
Recent observations of the spiral galaxy NGC 2276 in the NGC 2300 group support our conclusion that strangulation is important in galaxy groups. Rasmussen et al. (2006) have performed a detailed study of this system with Chandra and conclude that ram-pressure stripping is not sufficient to strip the cold gas in the disk. However, NGC 2276 is losing gas from the hot phase at a rate of 5 M⊙ yr-1. Given this mass loss rate, the galaxy will likely exhaust its current supply of cold gas within 1–2 Gyr. Similar to what we find for our target galaxy, Rasmussen et al. (2006) conclude that once star formation has ceased, NGC 2276 will have properties similar to an S0 galaxy. The NGC 2300 group is more massive than the group in our present study. Our results suggest that evidence for strangulation may be found in lower mass systems.
The simulated group is a fairly relaxed system with a dominant central elliptical galaxy. Strangulation is likely to be most effective in dynamically evolved groups because of their enhanced IGM. Furthermore, galaxies entering relaxed groups will be subjected to stripping over larger path lengths than galaxies entering dynamically young systems which consist of individual halos and not a common envelope. The presence of a significant X-ray emitting IGM is a good indicator that a group is relaxed (Mulchaey, 2000). As nearly all X-ray groups contain a dominant central elliptical galaxy, while systems dominated by spirals tend to be non-detected in X-rays (Mulchaey et al., 2003; Osmond & Ponman, 2004), strangulation is likely more effective in systems with a central dominant elliptical galaxy. If true, this might provide an explanation for the recent finding by Weinmann et al. (2006) that the early-type fraction is higher in systems with an early-type central galaxy than in halos with a late-type central galaxy (“galactic conformity”). The larger sample of the simulated groups in the VGRC will allow us to test this idea.
Although this Letter highlights only one case of strangulation, we are seeing a similar suppression of star formation in other groups in the VGRC. With the large range of properties among the VGRC, we hope to be able to quantify the importance of strangulation and determine how the suppression of star formation depends on factors such as the galaxy’s mass and orbit. The simulated groups in the VGRC will also allow us to explore the importance of other mechanisms such as galaxy interaction in driving galaxy evolution in groups.
References
- Abadi et al. (1999) Abadi, M. G., Moore, B., & Bower, R. G. 1999, MNRAS, 308, 947
- Abel et al. (1997) Abel, T., Anninos, P., Zhang, Y., & Norman, M. L. 1997, New Astronomy, 2, 181
- Agertz et al. (2007) Agertz, O., et al. 2007, MNRAS, 380, 963
- Anninos et al. (1997) Anninos, P., Zhang, Y., Abel, T., & Norman, M. L. 1997, New Astronomy, 2, 209
- Balogh et al. (1997) Balogh, M. L., Morris, S. L., Yee, H. K. C., Carlberg, R. G., & Ellingson, E. 1997, ApJ, 488, L75+
- Balogh et al. (2000) Balogh, M. L., Navarro, J. F., & Morris, S. L. 2000, ApJ, 540, 113
- Barnes & Hut (1986) Barnes, J., & Hut, P. 1986, Nature, 324, 446
- Barnes (1989) Barnes, J. E. 1989, Nature, 338, 123
- Bekki (1999) Bekki, K. 1999, ApJ, 510, L15
- Bekki & Couch (2003) Bekki, K., & Couch, W. J. 2003, ApJ, 596, L13
- Bekki et al. (2002) Bekki, K., Couch, W. J., & Shioya, Y. 2002, ApJ, 577, 651
- Bertschinger (2001) Bertschinger, E. 2001, ApJS, 137, 1
- Bruzual & Charlot (2003) Bruzual, G., & Charlot, S. 2003, MNRAS, 344, 1000
- Bureau & Carignan (2002) Bureau, M., & Carignan, C. 2002, AJ, 123, 1316
- Byrd & Valtonen (1990) Byrd, G., & Valtonen, M. 1990, ApJ, 350, 89
- Carnevali et al. (1981) Carnevali, P., Cavaliere, A., & Santangelo, P. 1981, ApJ, 249, 449
- Cen et al. (1995) Cen, R., Kang, H., Ostriker, J. P., & Ryu, D. 1995, ApJ, 451, 436
- Davis et al. (1997) Davis, D. S., Keel, W. C., Mulchaey, J. S., & Henning, P. A. 1997, AJ, 114, 613
- Dressler (1980) Dressler, A. 1980, ApJ, 236, 351
- Fan et al. (2001) Fan, X., et al. 2001, AJ, 122, 2833
- Farouki & Shapiro (1980) Farouki, R., & Shapiro, S. L. 1980, ApJ, 241, 928
- Fujita (2004) Fujita, Y. 2004, PASJ, 56, 29
- Fujita & Nagashima (1999) Fujita, Y., & Nagashima, M. 1999, ApJ, 516, 619
- Galli & Palla (1998) Galli, D., & Palla, F. 1998, A&A, 335, 403
- Gingold & Monaghan (1977) Gingold, R. A., & Monaghan, J. J. 1977, MNRAS, 181, 375
- Goto et al. (2003) Goto, T., et al. 2003, PASJ, 55, 757
- Gunn & Gott (1972) Gunn, J. E., & Gott, J. R. I. 1972, ApJ, 176, 1
- Haardt & Madau (2001) Haardt, F., & Madau, P. 2001, in Clusters of Galaxies and the High Redshift Universe Observed in X-rays, ed. D. M. Neumann & J. T. V. Tran
- Hernquist & Katz (1989) Hernquist, L., & Katz, N. 1989, ApJS, 70, 419
- Hester (2006) Hester, J. A. 2006, ApJ, 647, 910
- Hickson et al. (1977) Hickson, P., Richstone, D. O., & Turner, E. L. 1977, ApJ, 213, 323
- Holmberg (1941) Holmberg, E. 1941, ApJ, 94, 385
- Hubble & Humason (1931) Hubble, E., & Humason, M. L. 1931, ApJ, 74, 43
- Ishizawa et al. (1983) Ishizawa, T., Matsumoto, R., Tajima, T., Kageyama, H., & Sakai, H. 1983, PASJ, 35, 61
- Iwamoto et al. (1999) Iwamoto, K., Brachwitz, F., Nomoto, K., Kishimoto, N., Umeda, H., Hix, W. R., & Thielemann, F. 1999, ApJS, 125, 439
- Katz et al. (1996) Katz, N., Weinberg, D. H., & Hernquist, L. 1996, ApJS, 105, 19
- Kawata et al. (2006) Kawata, D., Arimoto, N., Cen, R., & Gibson, B. K. 2006, ApJ, 641, 785
- Kawata & Gibson (2003a) Kawata, D., & Gibson, B. K. 2003a, MNRAS, 340, 908
- Kawata & Gibson (2003b) —. 2003b, MNRAS, 346, 135
- Kawata & Rauch (2007) Kawata, D., & Rauch, M. 2007, ApJ, 663, 38
- Kitayama & Suto (1996) Kitayama, T., & Suto, Y. 1996, ApJ, 469, 480
- Kobayashi et al. (2000) Kobayashi, C., Tsujimoto, T., & Nomoto, K. 2000, ApJ, 539, 26
- Larson et al. (1980) Larson, R. B., Tinsley, B. M., & Caldwell, C. N. 1980, ApJ, 237, 692
- Lucy (1977) Lucy, L. B. 1977, AJ, 82, 1013
- Machacek et al. (2005) Machacek, M. E., Nulsen, P., Stirbat, L., Jones, C., & Forman, W. R. 2005, ApJ, 630, 280
- Mayer et al. (2007) Mayer, L., Kazantzidis, S., Mastropietro, C., & Wadsley, J. 2007, Nature, 445, 738
- Mayer et al. (2006) Mayer, L., Mastropietro, C., Wadsley, J., Stadel, J., & Moore, B. 2006, MNRAS, 369, 1021
- McCarthy et al. (2007) McCarthy, I. G., Frenk, C. S., Font, A. S., Lacey, C. G., Bower, R. G., Mitchell, N. L., Balogh, M. L., & Theuns, T. 2007, ArXiv e-prints, 710
- Moore et al. (1996) Moore, B., Katz, N., Lake, G., Dressler, A., & Oemler, A. 1996, Nature, 379, 613
- Mori & Burkert (2000) Mori, M., & Burkert, A. 2000, ApJ, 538, 559
- Mulchaey (2000) Mulchaey, J. S. 2000, ARA&A, 38, 289
- Mulchaey et al. (2003) Mulchaey, J. S., Davis, D. S., Mushotzky, R. F., & Burstein, D. 2003, ApJS, 145, 39
- Nulsen (1982) Nulsen, P. E. J. 1982, MNRAS, 198, 1007
- Oemler (1974) Oemler, A. J. 1974, ApJ, 194, 1
- Osmond & Ponman (2004) Osmond, J. P. F., & Ponman, T. J. 2004, MNRAS, 350, 1511
- Quilis et al. (2000) Quilis, V., Moore, B., & Bower, R. 2000, Science, 288, 1617
- Rasmussen et al. (2006) Rasmussen, J., Ponman, T. J., & Mulchaey, J. S. 2006, MNRAS, 370, 453
- Raymond & Smith (1977) Raymond, J. C., & Smith, B. W. 1977, ApJS, 35, 419
- Roediger & Hensler (2005) Roediger, E., & Hensler, G. 2005, A&A, 433, 875
- Schulz & Struck (2001) Schulz, S., & Struck, C. 2001, MNRAS, 328, 185
- Seager et al. (1999) Seager, S., Sasselov, D. D., & Scott, D. 1999, ApJ, 523, L1
- Seager et al. (2000) —. 2000, ApJS, 128, 407
- Sivakoff et al. (2004) Sivakoff, G. R., Sarazin, C. L., & Carlin, J. L. 2004, ApJ, 617, 262
- Spergel et al. (2007) Spergel, D. N., et al. 2007, ApJS, 170, 377
- Toomre & Toomre (1972) Toomre, A., & Toomre, J. 1972, ApJ, 178, 623
- van den Hoek & Groenewegen (1997) van den Hoek, L. B., & Groenewegen, M. A. T. 1997, A&AS, 123, 305
- Weinmann et al. (2006) Weinmann, S. M., van den Bosch, F. C., Yang, X., & Mo, H. J. 2006, MNRAS, 366, 2
- White (1978) White, S. D. M. 1978, MNRAS, 184, 185
- Wilman et al. (2005) Wilman, D. J., et al. 2005, MNRAS, 358, 88
- Woosley & Weaver (1995) Woosley, S. E., & Weaver, T. A. 1995, ApJS, 101, 181
- Zabludoff & Mulchaey (1998) Zabludoff, A. I., & Mulchaey, J. S. 1998, ApJ, 496, 39