An HI Threshold for Star Cluster Formation in Tidal Debris111Based in part on observations with the NASA/ESA Hubble Space Telescope, obtained at the Space Telescope Science Institute, which is operated by the Association of Universities for Research in Astronomy, Inc., under NASA contract NAS5-26555
Abstract
Super star clusters are young, compact star clusters found in the central regions of interacting galaxies. Recently, they have also been reported to preferentially form in certain tidal tails, but not in others. In this paper, we have used 21 cm HI maps and the Hubble Space Telescope Wide Field Planetary Camera 2 images of eight tidal tail regions of four merging galaxy pairs to compare the kiloparsec scale HI distribution with the location of super star clusters found from the optical images. For most of the tails, we find that there is an increase in super star cluster density with increasing projected HI column density, such that the star cluster density is highest when log cm-2, but equal to the background count rate at lower HI column density. However, for two tails (NGC 4038/39 Pos A and NGC 3921), there is no significant star cluster population despite the presence of gas at high column density. This implies that the threshold is a necessary but not sufficient condition for cluster formation. Gas volume density is likely to provide a more direct criterion for cluster formation, and other factors such as gas pressure or strength of encounter may also have an influence. Comparison of HI thresholds needed for formation of different types of stellar structures await higher resolution HI and optical observations of larger numbers of interacting galaxies.
1 Introduction
Massive star clusters tend to form in regions of vigorous star formation, especially in starbursts triggered by galaxy interactions and mergers (Schweizer, 1998). Images obtained with the Hubble Space Telescope of several mergers and merger remnants show a large number of young star clusters in the central regions (Holtzman et al., 1992; Whitmore et al., 1993, 1999; Whitmore & Schweizer, 1995; Schweizer et al., 1996; Miller et al., 1997; Zepf et al., 1999). While detailed studies of the central regions of merging galaxies have been conducted, it is only recently that young star clusters have been found in the tidal debris of some of these mergers (Knierman et al., 2003; Tran et al., 2003; de Grijs et al., 2003; Bastian et al., 2005). Using - and -band HST/WFPC2 images of the tidal tails of four merging pairs of galaxies, Knierman et al. (2003) find a statistically significant increase in the surface density of pc-size star clusters on the optical tails compared to off-tail regions. The colour-magnitude diagrams (CMDs) of these sources differed from the off-tail population, and are concentrated in the region of the CMD where young star clusters are expected. In this small sample, those tails with a modest or no overdensity of star clusters each contain an embedded candidate stellar tidal dwarf galaxy (TDG), while the tails in the system with the highest star cluster density (NGC 3256) lack such a structure. This led Knierman et al. (2003) to speculate that star formation in tidal tails may manifest itself either in numerous small structures like clusters along the tail or in large structures like tidal dwarf galaxies, but not in both.
HI observations indicate that tidal tails are gas rich (Yun, Ho, & Lo, 1994; Hibbard et al., 2001a), and many show evidence of in situ star formation (Schweizer, 1978; Hibbard & van Gorkom, 1996; Smith, Struck & Pogge, 1997; Iglesias-Páramo & Vílchez, 2001; Weilbacher et al., 2003). However, it is not clear what factors mediate tidal star formation. Studies by Skillman & Bothun (1986) and Skillman (1987) suggest that within the disks of dwarf irregular galaxies it is the local HI surface density rather than the fractional gas content of the galaxy that is of key importance in producing high mass stars. Physically, the gas volume density is more directly relevant to star formation than HI column density. In disks the gas volume density and the HI column density are closely related. However, in tidal debris geometric projection effects may dilute that relationship.
In this paper, we examine whether there exists a relationship between super star clusters (SSCs) in tidal debris and the underlying HI column density. Particularly, is the large scale (kpc-level) gas structure responsible for SSC formation, or are the pc-scale cluster formations unrelated to the kpc-scale gas structure? This is a step towards understanding the variety of star formation modes in tails.
2 Optical Data
For this study, we use the HST/WFPC2 data on eight tidal tail regions in four advanced mergers observed in Cycle 7 (GO7466) and presented by Knierman et al. (2003). The data were taken through the F555W and F814W filters of HST (hereafter and ) and targeted the tails of the Toomre Sequence mergers NGC 3256, NGC 3921, NGC 4038/39, and NGC 7252 (Toomre, 1977). Observations were made between August 1998 and October 1999 for NGC 3256, NGC 3921, NGC 7252 and NGC 4038/39 (Pos B). Due to priority scheduling for NICMOS, the Cycle 7 observations of two additional pointings of NGC 4038/39 (Pos A and Pos C) were postponed to December 2000. Exposure times for these observations were the same as that for Pos B (2000s and 1800s in and respectively centered on 12h 02m 0.6s, 18 55 32.3 and 12h 02m 7.81s, 18 50 4.9).
Following the procedure described in Knierman et al. (2003), we automatically detect point sources on pipeline-processed WFPC2 images in both and bands. Potential SSCs are identified by selecting only those point sources with magnitude errors less than 0.25 mag. We only consider sources with brighter than -8.5 (assuming them to be at the distance of the tail) and bluer than to eliminate contamination by individual stars. Figures 1–4 show the positions observed in each tail by WFPC2. Limiting magnitudes for each tail are given in Table 1. For the most distant tail (NGC 3921), the completeness fraction is at the = 8.5 limit, determined by adding artificial stars to the WFPC2 image (Knierman et al., 2003). For slightly brighter sources, with = -9.0, our sample in this most distant group is complete. Details of the total number of detected sources in-tail and out-of-tail111For each tail, the region in the image corresponding to contiguous regions with count above the background was identified as in-tail while all other regions were identified as out-of-tail. and the number of bright sources selected are given in Table 2. These were computed assuming an area of 5.3 sq. arcmin for the three WFPC2 chips and using the distance given in Table 1.
3 Radio Data
The 21 cm HI maps were obtained from various sources. The radio maps for NGC 4038/9, NGC 7252, and NGC 3921 were obtained using the VLA in the C+D array configuration, with a resolution 20″ (see Hibbard et al. (2001b, 1994) and Hibbard & van Gorkom (1996) respectively). HI maps for NGC 3256 were obtained using the ATCA in 3 different antenna configurations by English et al. (2003). The FWHM of the beam, its corresponding physical size (ranging from 1.4 kpc to 8.3 kpc for different pairs), and the limiting HI column density for the four galaxies are given in Table l. All HI column densities are measured from zeroth moment maps made from the AIPS tasks MOMNT (Rupen, 1999).
4 Relationship between SSCs and HI
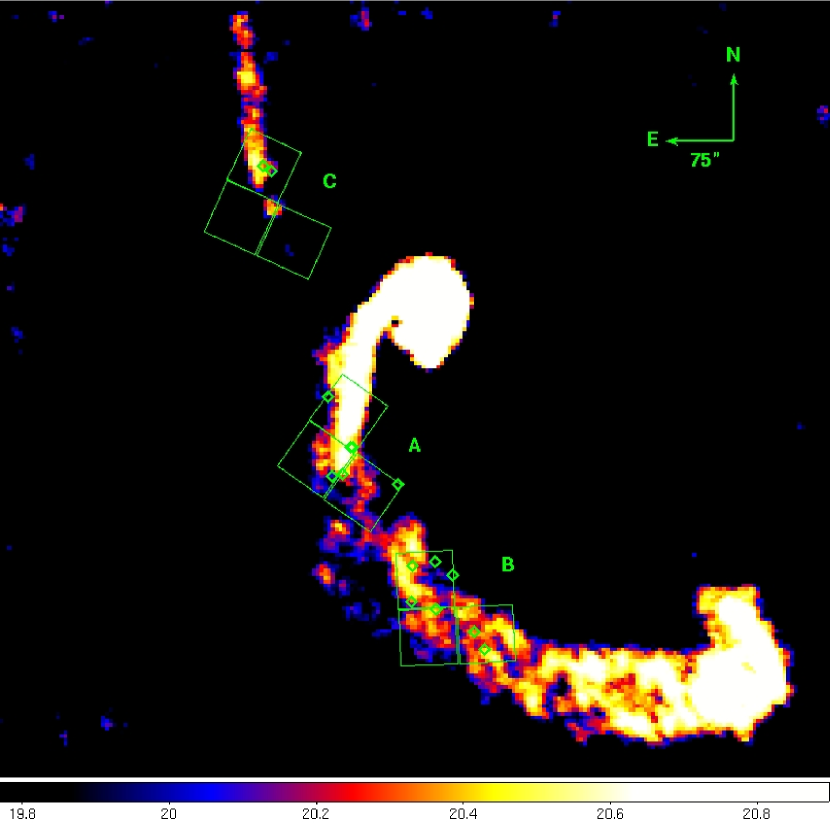
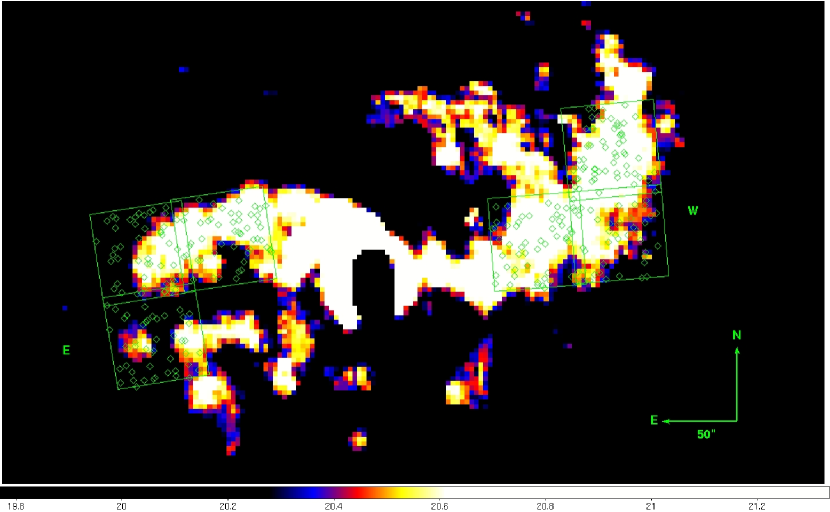
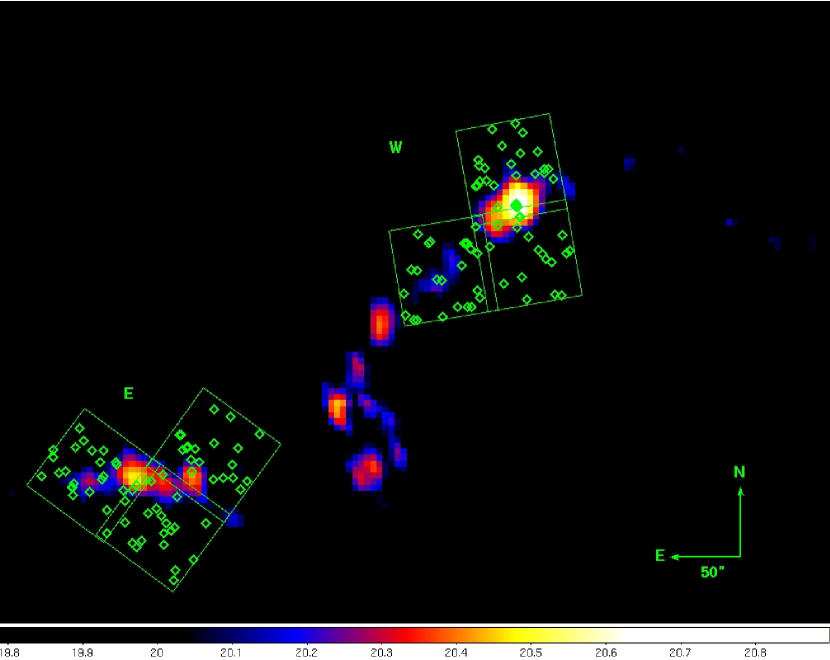
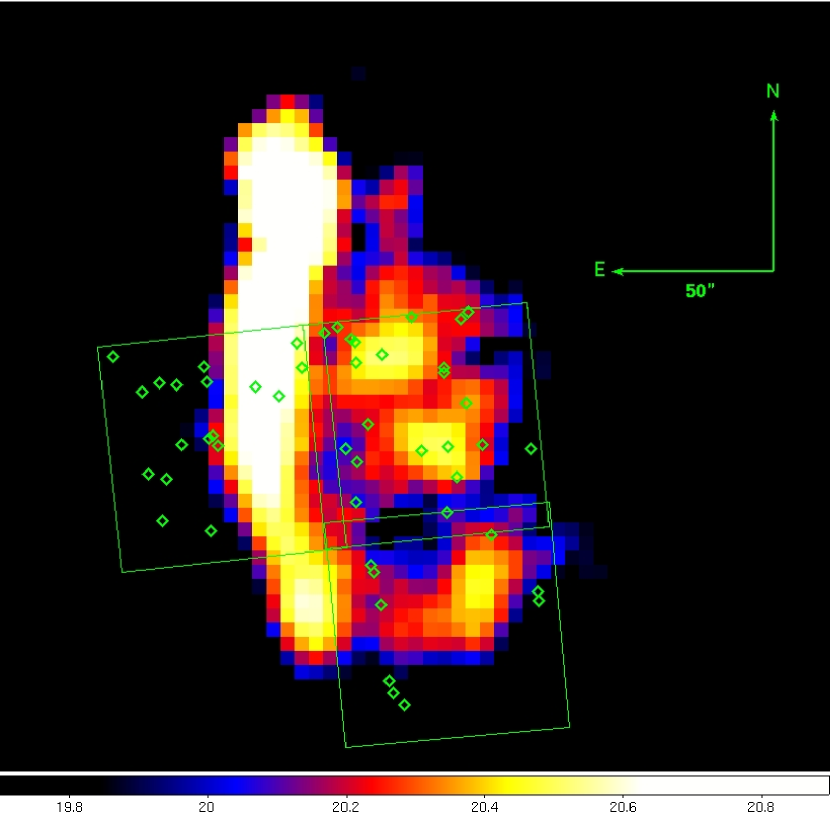
Figures 1–4 present images of the integrated HI line emission for the four mergers, showing the outline of the WFPC2 pointings and location of detected SSC candidates. The SSCs are parsec scale in size while the HI data has a few kpc scale resolution. Though it is not possible to study the gas and the clusters on the same scale, it is nevertheless interesting to explore whether the cluster environment is rich in HI. In order to study the correlation between the point sources derived from the photometry of the WFPC images and the distribution of HI, we first converted the positions of the point sources (both in-tail and out-of-tail) from pixel coordinates on the chip to right ascension and declination. The HI maps are then used to obtain the HI column density at these coordinates.
Figure 5 plots histograms of the surface density of star clusters (number per square kpc) as a function of the underlying HI column density. The first bin on each graph shows the clusters detected in regions with no observed HI flux (down to the limiting values listed in Table 1), effectively setting a background level for point sources unrelated to the tidal tail. Also plotted in each panel is the fractional area subtended by WFPC2 pixels in each column density bin (solid curve). This curve represents the expected detection probability for a uniform distribution of background/foreground sources. If the observed sources follows this curve it implies that there is no significant population of SSCs associated with the tail.
From Figure 5 we draw the following conclusions: (1) three of the eight tails — NGC 3256W, NGC 3256E and NGC 7252W — have a significant population of SSCs, but only at high HI column densities ( cm-2); (2) of the five remaining tails, three — NGC 4038/39 Pos B, NGC 4038/39 Pos C, and NGC 7252E — have few, if any, SSC candidates and little or no gas at high column density ( cm-2); (3) the two remaining tails — NGC 4038/39 Pos A, NGC 3921 — have gas at high column density, but no significant population of SSCs.
If, as we propose, the excess of SSCs in regions with cm-2 reflects a true excess, we would expect the colour distribution of these objects to differ from those of sources outside of the tail. For this comparison we eliminate sources redder than , since these are very unlikely to be real sources. Figure 6 shows histograms of the distributions of () colour, displayed separately for sources in regions with cm-2 and for sources in regions with cm-2. Source densities in each bin are presented per unit area with that column density so that the distributions can be easily compared. For each tail, we perform a Kolmogorov-Smirnov (K-S) test (Press et al., 1986) to evaluate whether sources within regions of high HI column density ( cm-2) are drawn from the same parent population as sources drawn from low HI column density ( cm-2). The colours of sources in high column density regions of NGC 3256W differ significantly from those in lower column density regions, with a probability of only % that they are drawn from the same distribution. The sense of the difference, that the sources in high column density regions are bluer, is what we would expect if they are real SSCs. We find a similar result for NGC 7252W, with only a % chance that the colours of the sources in the high and low sources are drawn from the same distribution. NGC 3256E did not show a significant difference between the distributions of the two populations of sources, with a probability of 15% that they are drawn from the same distribution. This indicates that in that case there may be a significant contamination from background/foreground sources that happen to fall in an area of high HI column density. NGC 3921 had only 2 sources in the high HI column density regions, so in that case we could not draw any conclusion about differences in the colour distributions of high and low HI column density sources.
An estimate of the density of SSCs in areas with cm-2 is made by taking the observed number per unit area in these regions and subtracting the expected surface density of background/foreground sources. The expected background/foreground for each region is tabulated in Table 3, estimated in two ways: 1) by dividing the total number of sources in the entire field by the area of the field; 2) from the first bin of each panel of Fig. 5, i.e. taking the density of sources in regions with cm-2, since these sources are highly unlikely to be related to the tails. The first method is an overestimate since it includes any real SSCs that may lie in the field. The second method is not biased, but suffers from errors due to small number statistics in fields without much area with low . In Table 3, we list the number of candidate SSCs and the subtended area in kpc2 for regions with cm-2 in Cols.(2) and (3), the observed source density in Col.(4) obtained by dividing Col.(2) by Col.(3), the estimated background source density in Col.(5) obtained using the first method given above, the estimated source density of candidate SSCs above the background in Col.(6) obtained using the background from Col.(5), the estimated background source density in Col.(7) obtained using the second method given above, the estimated source density of candidate SSCs above the background in Col.(8) obtained the background from Col.(7). and our estimates of the resulting background subtracted SSC densities in the cm-2. Uncertainties are calculated assuming Poisson statistics for the number of detected sources.
If cm-2 was the only condition necessary for SSC formation we would expect the SSC densities in all such tail regions to be the same. We do find that the values for the SSC density in high regions are consistent for NGC 3256W, NGC 4038/39 Pos A, NGC 7252W, and NGC 7252E. The fact that the same N(HI) threshold applies for these four regions suggests that projection effects are not significant or are the same for these four tail regions. That is, the gas volume density is likely to be similar for them so that the number of clusters per unit area (also a projected quantity) is similar. Although no SSC sources were observed for NGC 4038/39 Pos A, it is also true that there is only 11.2 kpc2 of area in that tail region with cm-2. Even if it had an SSC density as high as that of NGC 3256W (by method 2) we would expect only SSCs, so detecting none is perhaps not too surprising ( probability).
However, NGC 3921 is an exception to the rule of having enhanced SSC formation in regions of high . After background subtraction, it has no SSCs detected in its cm-2 regions, with an SSC density in these regions differing from that of NGC3256W at a level. Based upon its area at high , 180 kpc2, and the SSC density of NGC 3256W, we would expect SSCs in the NGC 3921 field, and we see only . Furthermore, the detected sources are consistent with the expected background level, such that we estimate that no SSCs are detected. Using Poisson statistics, the probability of measuring 0 when 50 are expected is . We conclude that, despite having a large area that exceeds the threshold, NGC 3921 appears to be unable to form clusters. This suggests that some other factors influence the formation of star clusters, and that having significant areas with above the threshold value is a necessary but not sufficient condition. One possible explanation is that the projected HI column density in NGC 3921 may exceed the threshold because of a large line of sight extent, such that the physical gas volume density is actually low. However, the optical source density would be subject to the same projection effect. From the location of the WFPC2 pointing and the tidal tail morphology and kinematics (Hibbard & van Gorkom, 1996), this region of the tail should lie mostly in the plane of the sky, where projection strong effects are not expected (Bournaud et al., 2004).
5 Discussion & Conclusions
Formation of stars in tidal debris, whether in the form of isolated clusters or tidal dwarfs, preferentially occurs in regions with larger HI column densities (on kpc scales). The HI column density is the best indicator we have of the more physically relevant quantity, the gas volume density. In this study, we find a threshold value of cm-2 (on kpc scales) for regions of increased SSC formation.
Our study of four pairs of interacting galaxies shows populations of SSCs that have formed in regions with cm-2 in NGC 3256W, NGC 3256E, and NGC 7252W. Similarly, there appear to be few clusters formed in regions with lower values. In NGC 4038/39 Pos A, Pos B, and NGC 7252E there are no substantial populations of SSCs, but this is consistent with their relatively small areas with 20.6cm-2. For NGC 3921, however, there is a significant area exceeding this threshold, and no SSCs are found.
Since NGC 3921 is the most distant group, we should consider biases that might have affected this conclusion. For example, our 50% detection limit of = 8.7 for NGC 3921 is not as faint as for the other tails (see Table 1). However, since we have only considered point sources brighter than = 8.5 in our analysis, we could not possibly be missing more than half the sources in NGC 3921. Thus the fact that we do not detect any SSCs compared to the exception of is still highly significant. Another possible bias arises because the beamsize is largest for this most distant tail, which would lead to more dilution of small, high column clumps of HI so that some regions that exceed the threshold might be missed. However, our conclusion is that there are significant high HI column density areas observed in NGC 3921, but that they do not have SSCs. If there were even more high HI column density areas with no detected SSCs that would only strengthen this conclusion.
Based on a stability analysis for a self-gravitating gas disk, Kennicutt (1989) showed that there should be a threshold value below which star formation is strongly suppressed. Skillman & Bothun (1986) and Skillman (1987) observationally determined a threshold of cm-2, averaged over 500 pc within the disks of dwarf irregular galaxies. They also found that giant extragalactic HII regions are only located in regions where the HI surface densities are a factor of 3 to 5 times this threshold. Recently, Walter et al. (2006) reported the discovery of HII regions in the tidal arms of NGC 3077 found only where the HI column density reaches values above cm-2, averaged over 200 pc. Observations in the far UV by the GALEX satellite find a close correspondence between HI column density and FUV emission when the HI column density reaches a threshold of 2.5 (Neff et al., 2005; Thilker et al., 2005; Gil de Paz et al., 2005). Mundell et al. (2004) find a HI cloud at the base of the northern tail in the interacting system NGC 3227/3226, associated with massive ongoing star formation. This is seen as a cluster of blue knots (MB 15.5), cospatial with a ridge of high neutral hydrogen column density ( 3.7 1021 cm-2). A similar result is reported by Horellou & Koribalski (2004) in the tidal regions of the interacting galaxy NGC 6872. These results are all generally consistent with the value of cm-2 that we have found for SSCs in the tails of interacting galaxies. Small differences can be due to differences in the scales over which the is determined.
The measurement of for this study is obtained by averaging over a large beam size. In principle, correlations between point sources and might be significantly stronger and the threshold much larger if the HI column density could be examined on scales more similar to the size of a star cluster. The amount and the scale on which HI is present and its distribution in these regions of high HI column densities could influence the scales of star formation. Thus, we cannot yet compare thresholds for formation of tidal dwarfs, SSCs, loose stellar associations, and HII regions.
The excess of point sources found in the western tail of NGC 7252 is of particular interest. The high detection rate found at cm-2 in this case is due entirely to star clusters associated with its tidal dwarf galaxy (TDG) candidate (Hibbard et al., 1994). A similar result was found by Saviane, Hibbard, & Rich (2004) for the TDG candidate in NGC 4038, with the three brightest stellar associations in its vicinity () in regions with 20.6 cm-2.
If a threshold value of HI column density was the only factor determining the source density of star clusters, the number of real star clusters detected after the subtraction of background sources would be consistent with the average source density for high HI column density regions. We find that our estimates of the number of real sources do agree quite well for most tails in our sample. However, there is a glaring discrepancy in the case of NGC 3921 in which we would expect to find about 50 clusters but none are detected (after background/foreground subtraction). This could be the result of a large projection effect in the case which pushed N(HI) above the threshold despite a relatively low gas volume density. In addition to the star formation threshold, other factors like pressure (Jog & Das, 1992, 1996; Elmegreen & Efremov, 1997) or the strength of the encounter (Keel & Borne, 2003) could also influence the type of stellar associations that are formed. Elmegreen & Efremov (1997) show that differences in pressure at the time of formation gives rise to the primary structural differences between various cluster types. They find that large-scale shocks, as seen in interacting galaxies, could lead to regions of high pressure which are conducive to the formation of globular clusters. Perhaps, the NGC 3921 debris did not experience these high pressure conditions.
Future studies with observations of a larger sample of mergers, encompassing the entire tidal debris regions, combined with higher resolution HI observations, are needed. Such a sample will facilitate comparison of HI thresholds for different types of cluster and dwarf formation. It would also allow us to isolate other factors that influence formation of various kinds of stellar associations.
References
- Bournaud et al. (2004) Bournaud F., Duc P.-A., Amram P., Combes F., & Gach J.,-L., 2004, A&A, 425, 813
- Gil de Paz et al. (2005) Gil de Paz A., et al., 2005, ApJ, 627, L29
- Neff et al. (2005) Neff S.G., et al., 2005, ApJ, 619, L91
- Thilker et al. (2005) Thilker D.A., et al., 2005, ApJ, 619, L79
- Toomre (1977) Toomre, A. 1977, in Tinsley B.M., Larson R.B., eds, The Evolution of Galaxies and Stellar Populations. New Haven: Yale Univ., p.401
- Bastian et al. (2005) Bastian N., Hempel M., Kissler-Patig M., Homeier N., & Trancho G., 2005, A&A, 435, 65
- Bournaud, Duc, & Masset (2003) Bournaud F., Duc P. -A., & Masset F., 2003, A&A, 411, L469
- de Grijs et al. (2003) de Grijs R., Lee J. T., Mora Herrera M.C., Fritze-v. Alvensleben U., & Anders P., 2003, NewA, 8, 155
- Dolphin (2000) Dolphin A.E., 2000, PASP, 112, 1383
- Elmegreen & Efremov (1997) Elmegreen B.G., & Efremov Y.N., 1997, ApJ, 480, 235
- English et al. (2003) English J., Norris R.P., Freeman K.C., & Booth R.S., 2003, AJ, 125, 1134
- Hibbard et al. (1994) Hibbard J.E., Guhathakurta P., van Gorkom J.H., & Schweizer F., 1994, AJ, 107, 67
- Hibbard & van Gorkom (1996) Hibbard J.E., & van Gorkom J.H., 1996, AJ, 111, 655
- Hibbard, Vacca, & Yun (2000) Hibbard J.E., Vacca W.D., & Yun M.S., 2000, AJ, 119, 1130
- Hibbard et al. (2001a) Hibbard J.E., van Gorkom J.H., Rupen M.P., & Schiminovich D.S. 2001a, in Hibbard J.E., & Rupen M.P., eds, ASP Conf. Ser. Vol. 240, Gas and Galaxy Evolution. Astron. Soc. Pac., San Francisco, p659
- Hibbard et al. (2001b) Hibbard J.E., van der Hulst T., Barnes J.E., & Rich R.M., 2001b, AJ, 122, 2969
- Hibbard et al. (2005) Hibbard J.E., et al., 2005, ApJ, 619, L87
- Holtzman et al. (1992) Holtzman J.A., et al., 1992, AJ, 103, 691
- Horellou & Koribalski (2004) Horellou C. and Koribalski B.S., 2004, IAUS, 217, 422
- Iglesias-Páramo & Vílchez (2001) Iglesias-Páramo J., & Vílchez J. M., 2001, ApJ, 550, 204
- Jog & Das (1992) Jog C.J., & Das M., 1992, ApJ, 400, 476
- Jog & Das (1996) Jog C.J., & Das M., 1996, ApJ, 473, 797
- Keel & Borne (2003) Keel W.C., & Borne K.D., 2003, AJ, 126, 1257
- Kennicutt (1989) Kennicutt R. C., Jr. 1989, ApJ, 344, 685
- Knierman et al. (2003) Knierman K., Gallagher S.C., Charlton J.C., Hunsberger S, D., Whitmore B., Kundu A., Hibbard J.E., & Zaritsky D., 2003, AJ, 126, 1227
- Miller et al. (1997) Miller B., Whitmore B., Schweizer F., & Fall S.M., 1997, AJ, 114, 2381
- Meurer et al. (1995) Meurer G.R., Heckman T.M., Leitherer C., Kinney A., Robert C., & Garnett D.R., 1995, AJ, 110, 2665
- Mundell et al. (2004) Mundell C.G., James P.A., Loiseau N., Schinnerer E., & Forbes D.A., 2004, ApJ, 614, 648
- Press et al. (1986) Press W.H., Flannery B.P., Teukolsky S.A., & Vetterling W.T., 1986, in Numerical Recipes: The Art of Scientific Computing. Cambridge: Cambridge Univ. Press
- Rupen (1999) Rupen M. P. 1999, in Taylor G.B., Carilli C.L., & Perley R.A., eds, ASP Conf. Ser. Vol. 180, Synthesis Imaging in Radio Astronomy II.ASP, San Francisco, p.229
- Saviane, Hibbard, & Rich (2004) Saviane I., Hibbard J.E., & Rich R.M., 2004, AJ, 127, 660
- Schweizer (1978) Schweizer F. 1978, in Berkhuijsen E. M., & Wielebinski R., eds, Proc. IAU Symp. No. 77, The Structure and Properties of Nearby Galaxies. Reidel, Dordrecht, p.279
- Schweizer et al. (1996) Schweizer F., Miller B., Whitmore B., & Fall S.M., 1996, AJ, 112, 1839
- Schweizer (1998) Schweizer F. 1998, in Kennicutt R.C., Schweizer F., Barnes J.E., Friedli D., Martinet L., & Pfenniger D., eds, Galaxies, Interactions and Induced Star Formation. Berlin:Springer.
- Skillman & Bothun (1986) Skillman E.D., & Bothun G.D., 1986, A&A, 165, 45
- Skillman (1987) Skillman E.D., 1987, in Star Formation in Galaxies. Washington D.C., NASA, p.263
- Smith, Struck & Pogge (1997) Smith B.J., Struck C., & Pogge R.W., 1997, ApJ, 483, 754
- Tran et al. (2003) Tran H.D., et al., 2003, ApJ, 585, 750
- Walter et al. (2006) Walter F., Martin C. L., & Ott J., 2006, AJ, 132, 2289
- Weilbacher et al. (2003) Weilbacher P. M., Duc P.-A., & Fritze-v.Alvensleben U., 2003, A&A, 397, 545
- Whitmore et al. (1993) Whitmore B.C., Schweizer F., Leitherer C., Borne K., & Robert C., 1993, AJ, 106, 1354
- Whitmore & Schweizer (1995) Whitmore B.C., & Schweizer F., 1995, AJ, 109, 960
- Whitmore et al. (1999) Whitmore B.C., Zhang Q., Leitherer C., Fall S.M., Schweizer F., & Miller B., 1999, AJ, 118, 1551
- Yun, Ho, & Lo (1994) Yun M.S., Ho P.T.P., & Lo K.Y., 1994, Nature, 372, 530
- Zepf et al. (1999) Zepf S., Ashman K., English J., Freeman K., & Sharples R., 1999, AJ, 118, 752
| Pair | Distance | Radio Beam | M | ||
|---|---|---|---|---|---|
| (Mpc) | FWHM | Size (kpc) | (cm-2) | (mag) | |
| NGC4038/39 | 13.8 | 20.7″15.4″ | 1.41.0 | 19.7 | -5.8 |
| NGC3256 | 37.6 | 25.7″19.3″ | 4.63.5 | 20.0 | -7.5 |
| NGC7252 | 64.4 | 26.9″16.1″ | 8.35.0 | 19.7 | -8.1 |
| NGC3921 | 80.3 | 19.3″18.1″ | 7.57.1 | 19.7 | -8.7 |
| Tail | Total | Brightaa | Bright & Bluebb and | Total | Brightaa | Bright & Bluebb and | Fractional area |
|---|---|---|---|---|---|---|---|
| In Tail | In Tail | In Tail | Out of Tail | Out of Tail | Out of Tail | with cm-2 | |
| NGC3256E | 105 | 74 | 47 | 95 | 73 | 51 | 0.28 |
| NGC3256W | 127 | 71 | 57 | 129 | 86 | 56 | 0.06 |
| NGC7252E | 29 | 27 | 23 | 44 | 37 | 33 | 0.53 |
| NGC7252W | 37 | 35 | 31 | 42 | 38 | 30 | 0.53 |
| NGC3921 | 16 | 16 | 14 | 33 | 33 | 30 | 0.31 |
| NGC4038B | 47 | 6 | 4 | 27 | 3 | 3 | 0.13 |
| NGC4038A | 145 | 18 | 3 | 253 | 51 | 3 | 0.30 |
| NGC4038C | 16 | 1 | 1 | 124 | 1 | 1 | 0.79 |
Note. — Physical scales computed adopting Ho= 71 km s-1 Mpc-1, except for NGC4038/39 where we adopt a distance of 13.8 Mpc from Saviane, Hibbard, & Rich (2004)
| (1) | (2) | (3) | (4) | (5) | (6) | (7) | (8) |
|---|---|---|---|---|---|---|---|
| Tail | Obs. Src. | Area 20.6 | Obs. Src. | Backgr. 1 | Est. SSC1 | Backgr. 2 | Est. SSC2 |
| # | [kpc2] | [kpc-2] | [kpc | [kpc | [kpc-2] | [kpc-2] | |
| NGC 3256E | 65 | 163.6 | 0.400.05 | 0.230.02 | 0.170.05 | 0.210.03 | 0.180.06 |
| NGC 3256W | 161 | 409.5 | 0.390.03 | 0.250.02 | 0.150.04 | 0.110.05 | 0.280.06 |
| NGC 7252E | 0 | 0.0 | 0.0 | 0.040.01 | -0.040.01 | 0.030.01 | -0.030.01 |
| NGC 7252W | 8 | 30.2 | 0.260.09 | 0.040.01 | 0.220.09 | 0.040.01 | 0.230.09 |
| NGC 3921 | 2 | 179.9 | 0.010.01 | 0.0170.003 | -0.0050.008 | 0.0170.004 | -0.0060.01 |
| NGC 4038B | 0 | 0.0 | 0.0 | 0.060.03 | -0.060.03 | 0.050.05 | -0.050.05 |
| NGC 4038A | 0 | 11.2 | 0.0 | 0.070.03 | -0.070.03 | 0.0280.028 | -0.0280.028 |
| NGC 4038C | 0 | 0.0 | 0.0 | 0.020.01 | -0.020.01 | 0.0 | 0.0 |