Chandra Observation of PSR B1823–13 and its Pulsar Wind Nebula
Abstract
We report on an observation of the Vela-like pulsar B182313 and its synchrotron nebula with the Chandra X-ray Observatory. The pulsar’s spectrum fits a power-law model with a photon index for the plausible hydrogen column density cm-2, corresponding to the luminosity ergs s-1 in the 0.5–8 keV band, at a distance of 4 kpc. The pulsar radiation likely includes magnetospheric and thermal components, but they cannot be reliably separated because of the small number of counts detected and strong interstellar absorption. The pulsar is surrounded by a compact, , pulsar wind nebula (PWN) elongated in the east-west direction, which includes a brighter inner component , elongated in the northeast-southwest direction. The slope of the compact PWN spectrum is , and the 0.5–8 keV luminosity is ergs s-1. The compact PWN is surrounded by asymmetric diffuse emission (extended PWN) seen up to at least south of the pulsar, with a softer spectrum ( for cm-2), and the 0.5–8 keV luminosity – ergs s-1. We also measured the pulsar’s proper motion using archival VLA data: mas yr-1, mas yr-1, which corresponds to the transverse velocity km s-1. The direction of the proper motion is approximately parallel to the elongation of the compact PWN, but it is nearly perpendicular to that of the extended PWN and to the direction towards the center of the bright VHE -ray source HESS J1825–137, which is likely powered by PSR B182313.
Subject headings:
ISM: individual (G18.00.7, HESS J1825137) — pulsars: individual (PSR B1823–13 = J1826–1334) — stars: neutron — X-rays: ISM1. Introduction
About a dozen of radio pulsars observed in X-rays belong to the group of the so-called Vela-like pulsars, with spindown ages –30 kyr and spindown powers of a few ergs s-1. Their radiation usually show a thermal component, possibly emitted from the cooling neutron star (NS) surface, and a nonthermal component with a power-law (PL) X-ray spectrum, presumably originating in the pulsar magnetosphere (see Kaspi et al. 2006 for a review). These pulsars are enveloped by pulsar wind nebulae (PWNe) whose X-ray emission is due to the wind of ultrarelativistic particles shocked in the ambient medium (Kargaltsev et al. 2007, and references therein). Therefore, in addition to studying pulsar magnetospheres and NS cooling, X-ray observations of Vela-like pulsars allow one to study pulsar winds, the ambient medium, and their interaction.
PSR B1823–13 (also known as PSR J1826–1334, hereafter referred to as B1823) is a typical Vela-like pulsar. It was detected in the Jodrell Bank radio survey (Clifton et al. 1992). Its period, ms, and period derivative, s s-1, imply the spindown age kyr, spindown power ergs s-1, and surface magnetic field G. The distance to the pulsar, kpc, was estimated from the pulsar’s dispersion measure ( pc cm-3) using the models of Galactic electron distribution (Taylor & Cordes 1993; Cordes & Lazio 2002). Although such a young pulsar is expected to reside in a supernova remnant (SNR), observations of this field with the Very Large Array (VLA) have not found an SNR, nor a radio PWN (Braun, Goss, & Lyne 1989; Frail & Scharringhausen 1997; Gaensler et al. 2000).
This pulsar is particularly interesting because it possibly powers an extended (, i.e. pc, in size) Very High Energy (VHE) -ray source HESS J1825–137 (Aharonian et al. 2005,2006). The -ray emission extends asymmetrically south-southwest of B1823, with the peak surface brightness from the pulsar. Aharonian et al. (2006, hereafter A06) found a softening of the 0.25–35 TeV spectrum with increasing distance from the pulsar (hence an energy-dependent morphology), with a photon index increasing from to . These authors discuss a scenario in which the -rays are produced by Compton upscattering of the cosmic microwave background (CMB) photons off the ultrarelativistic electrons supplied by the pulsar. As the -ray luminosity of the source, above 200 GeV [], is only a factor of 10 lower than the pulsar’s spindown power, A06 propose that the spindown power was significantly higher in the past, when the electrons responsible for the currently observed TeV emission were produced by the pulsar.
Although the field of B1823 has been observed with ROSAT, ASCA, and XMM-Newton, the X-ray spectrum of the pulsar and the structure of its surroundings remained unclear because of the relatively low angular resolution of those missions. Finley et al. (1996, F96 hereafter) observed B1823 with the ROSAT observatory and, despite the small number of source counts detected (e.g., 127 counts from a radius circle around the pulsar position in the 14.7 ks PSPC exposure) found evidence of a point source surrounded by a compact PWN of radius, and a dimmer component extending up to south-southwest of the pulsar. Because of the poor statistics, it was impossible to measure the spectra. For an upper limit on the hydrogen column density, , F96 estimated the upper limit fluxes at a few ergs cm-2 s-1 level for the emission components, corresponding to luminosities – erg s-1 in the 0.5–2.4 keV range. Sakurai et al. (2001) were able to detect the extended structure around the B1823 position with ASCA, but that observation lacked the spatial resolution to separate the components.
Gaensler et al. (2003, G03 hereafter) observed B1823 with the XMM-Newton EPIC detectors. The XMM-Newton resolution turned out to be too low to resolve the pulsar, but G03 detected two components of the PWN (designated as G18.0–0.7 based on its Galactic coordinates) associated with this pulsar: a “core” of a extent, elongated in the east-west direction, and a large-scale diffuse component of lower surface brightness, in extent, seen mostly to the south of the pulsar. Fitting the core and diffuse component spectra with a PL model, G03 found the photon indices and , and 0.5–10 keV luminosities ergs s-1, ergs s-1, for a foreground hydrogen column density . They suggested that the core represents the pulsar wind termination shock at a distance from the the pulsar while the diffuse component indicates the shocked downstream wind. G03 propose that the asymmetric morphology of the diffuse component with respect to the pulsar is the result of a reverse shock from an associated SNR, which has compressed and distorted the PWN. They place limits on the pulsar’s thermal emission: keV and bolometric luminosity ergs s-1 (as seen by a distant observer), assuming that the NS emits as a blackbody of a radius km, for .
Because of its superior angular resolution, Chandra is suited much better than any other X-ray observatory for studying small-scale extended structures (such as the core of the B1823 PWN) and resolving point sources possibly projected onto such structures. Therefore, our group proposed a Chandra observation of B1823, with the goal to separate the pulsar from the PWN, measure their spectra, investigate the PWN morphology with the best possible resolution, and compare the pulsar and PWN properties with those of other Vela-like pulsars. The data from that observation immediately showed that the pulsar can indeed be separated from the PWN, the “core” PWN is highly nonuniform in surface brightness, and the overall PWN morphology is more complicated than it had been presumed based on the previous low-resolution X-ray observations. These results have been reported at several conferences (Teter et al. 2003a,b; Gonzalez & Kaspi 2006; Kargaltsev et al. 2006), but they have not been published in a refereed journal. In this paper, we decribe the analysis and results of the Chandra observations and present infrared (IR) and radio images of the field (§2). As the interpretation of the PWN morphology strongly depends on the direction and magnitude of the pulsar’s proper motion, we also report the proper motion measurement in §3. Implications of our findings for the pulsar and PWN physics, including the VHE -radiation, are discussed in §4, while §5 summarizes the results of this work.
2. Observations and Data Analysis
2.1. Chandra ACIS observation
B1823 was observed with the Advanced CCD Imaging Spectrometer (ACIS) aboard Chandra on 2002 October 24 (ObsID 2830). Although last 13 ks of the 40,836 s exposure suffered from flaring particle background ( counts s-1 per pixel, on average), we have checked that filtering out the periods of elevated background at the expense of shortening the exposure time would actually reduce the signal-to-noise ratio for the pulsar and the compact PWN and only very slightly increase it for the large-scale extended PWN; therefore, we chose to use the whole exposure for our analysis.
The observation was carried out in Faint mode, and the target was imaged on S3 chip, with the radio pulsar position from the optical axis, where the angular resolution is still not degraded. The other ACIS chips activated during this observation were S1, S2, S4, I2 , and I3. The detector was operated in Full Frame mode, which provides time resolution of 3.24 seconds. We analyzed the data reprocessed by the Chandra X-ray Center (CXC) on 2006 October 11 (rev. 2; ASCDSVER 7.6.9). The data were reduced using the Chandra Interactive Analysis of Observations (CIAO) software (ver. 3.4; CALDB ver. 3.3.0.1). We used the software package XSPEC (ver. 11.3.2) for the spectral analysis.
2.2. X-ray images of B1823 and its vicinity
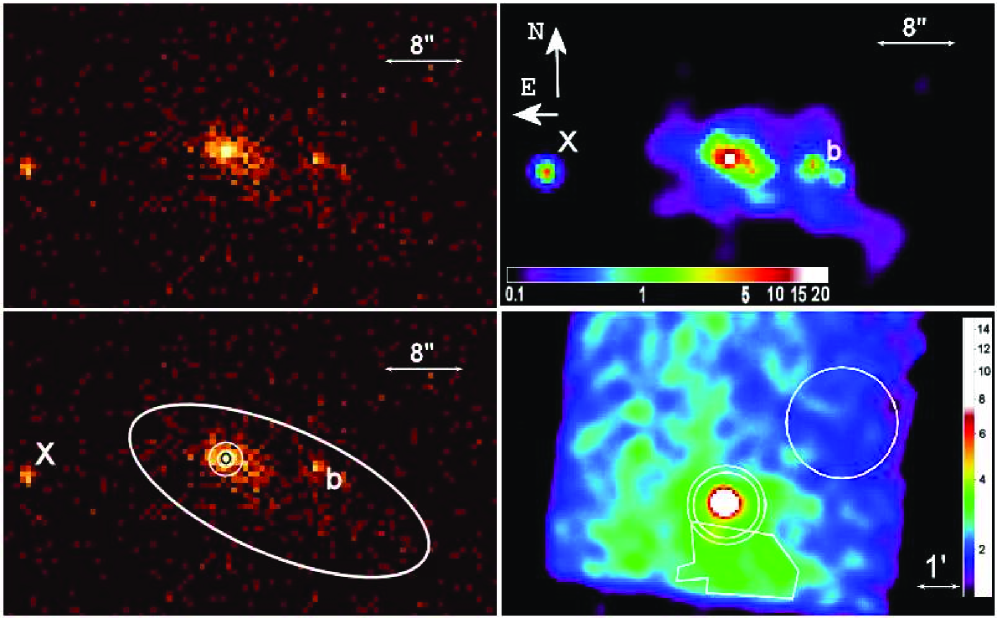
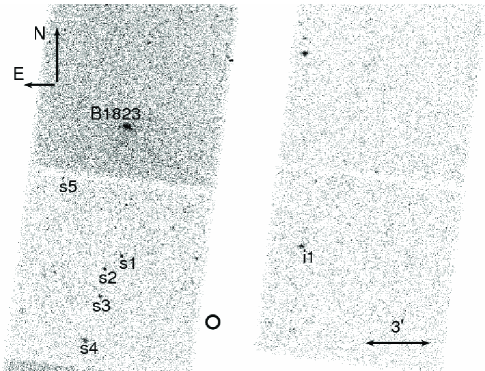
Figure 1 shows the ACIS-S3 images of the B1823 field, with an extended source around the radio pulsar position. The coordinates of the highest peak in the X-ray brightness distribution (which is at the center of a pixel island, with equal numbers of counts in each of the 4 pixels) are , (J2000), with an estimated centroiding error of for each of the coordinates. This position differs by in right ascension and in declination from the radio pulsar position, , , calculated from the original position in Hobbs et al. (2004) for the epoch of the Chandra observation (MJD 52,571), using the proper motion measurement described in §3. These differences are smaller than the combined errors ( in right ascension and in declination, at the 68% level) of the peak position measurement, radio position, and Chandra absolute astrometry. Therefore, there are no doubts that the highest brightness peak corresponds to the pulsar B1823 while the surrounding emission represents its PWN.
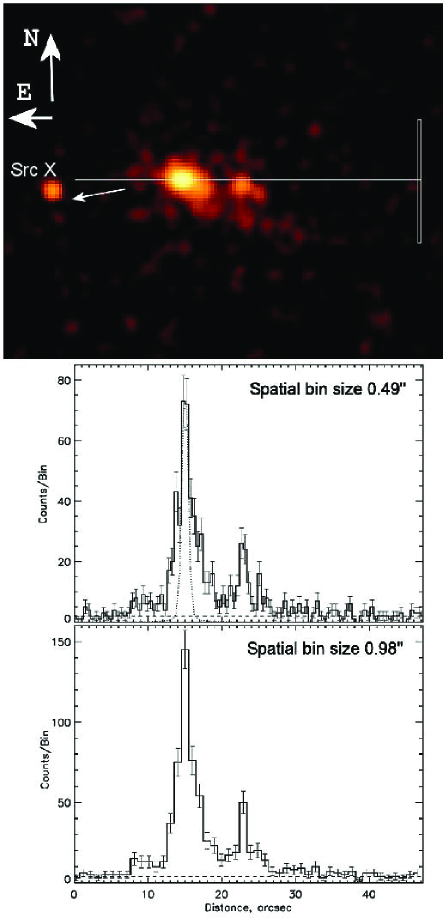
We see from Figures 1 and 2 that the PWN morphology is asymmetric and nonuniform. The brightest inner PWN component (surface brightness in the range of 4–23 counts arcsec-2 in 0.7–7 keV), is (i.e. pc2 at kpc) in size. It is approximately centered on the pulsar and elongated along the northeast-southwest direction (position angle , measured east of north).
The inner component is embedded in a dimmer (average surface brightness counts arcsec-2 in 0.7–7 keV) outer component of the compact PWN, within a area. It is stretched along the east-west direction, with the pulsar being closer to its east end (i.e. the outer component is more extended in the direction approximately opposite to the direction of the pulsar’s proper motion; see §3). Its surface brightness distribution is rather nonuniform, with a prominent enhancement west of the pulsar (we designate it as the “blob” and mark ‘b’ in the figures). The smoothed subpixel-resolution image shown in Figure 1 (top right) suggests that the blob is connected to the inner PWN component by a faint “bridge”. We have checked that there are no optical-NIR counterparts to the blob in the catalogs available (e.g., the nearest 2MASS111Two Micron All Sky Survey (Skrutzkie et al. 2006). counterpart is away).
Another compact source is seen in the images east of the pulsar. This object, CXOU 182614.4133448 (hereafter referred to as Source X) is point-like. The analysis of its spectrum (§2.5) shows that it is likely a background AGN, unrelated to B1823.
The smoothed image in Figure 2 (top) shows marginal evidence of two -long “tails”, apparently emanating from the pulsar in the west-northwest and west-southwest directions. The linear profiles in the middle and bottom panels of Figure 2 show that the outer PWN structure is discernible above the local background level of counts arcsec-2 up to and east and west of the pulsar, respectively.
The compact PWN (comprised of the above-described inner and outer components) is, in turn, immersed in an even dimmer large-scale diffuse emission apparent in heavily binned images. As it is natural to assume that this diffuse emission is also produced by the wind from B1823, we will call it the extended PWN. It is mostly concentrated southward of the compact PWN, and it is discernible in the ACIS images up to the edge of the S3 chip (i.e. from the pulsar; Fig. 1, bottom right). (It likely extends further into the S2 chip, but the lower sensitivity of this chip does not allow a reliable analysis of the faint diffuse emission.) The extended PWN is somewhat better seen in the XMM-Newton EPIC MOS1+MOS2 image shown in Figure 3c (see also G03). However, the true extent of this dim diffuse component is difficult to determine even in the large field-of-view of the MOS detectors because of the strong vignetting at large off-axis angles and high EPIC background.
2.3. PWN spectrum
We extracted the compact PWN spectrum222As we found no statistically significant differences between the spectra of the inner and outer components of the compact PWN, we present here only the spectrum of the entire compact PWN. (Fig. 4, top) from the ellipse shown in Figure 1 (bottom left), excluding the counts within the circle centered on the X-ray position of the pulsar (see §2.1) and restricting the energy range to 0.7–7 keV. This region of 225 arcsec2 area contains 415 counts. We estimated the background from the annulus of 2916 arcsec2 area shown in Fig. 1 (bottom right), which contains 511 counts. Thus, there are compact PWN counts in the aperture chosen.
To analyze the spectrum of the extended PWN (Fig. 4, bottom), we chose the polygon encompassing the region of brightest emission south of the pulsar, with the area of 3.4 arcmin2 (see Fig. 1, bottom right), which contains 2329 counts in the 0.7–7 keV band. The background was extracted from the circular region shown in the same panel, which contains 2004 counts. Subtracting the background contribution, we obtain extended PWN counts in the polygon aperture. (We have also tried several other background regions but this did not lead to significant changes in the spectral fits.)
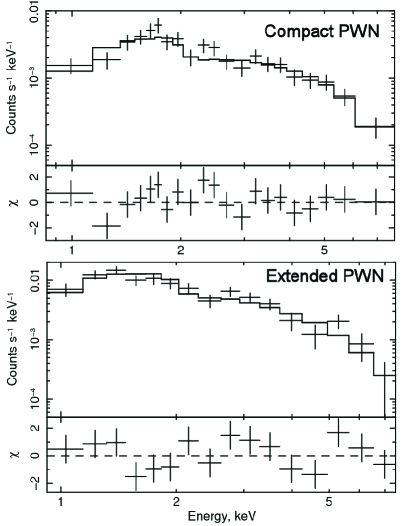
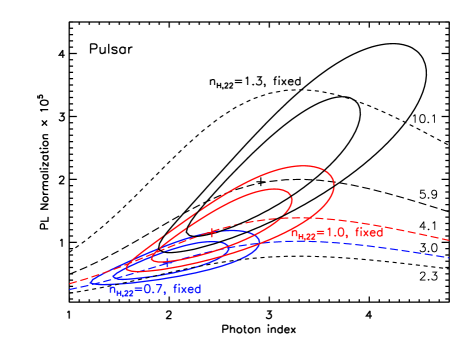
First, we fit the compact and extended PWN spectra with the absorbed power-law (PL) model, allowing the hydrogen column density to vary. The confidence contours obtained from these fits are shown in Figure 5. We see that the 90% confidence contours for the compact and extended PWN do not overlap, which suggests that the two spectra are different. Since we do not expect the hydrogen column density, , to differ significantly on such a small, , scale, we ascribe the difference to different spectral slopes, .
To estimate the spectral slopes more accurately, it would be useful to restrict the range of (which would also be helpful for the spectral analysis of the pulsar – see §2.4). The fits with free give and for the compact and extended PWNe, respectively (the uncertainties correspond to the 68% confidence level for a single interesting parameter). The values of obtained by G03 using the XMM-Newton data are in the range of 0.8–1.7, depending upon the spectral model and extraction region chosen. The estimate based on the pulsar’s dispersion measure (DM cm-3) and the usual assumption of 10% degree of ionization of the interstellar medium (ISM) gives . This is close to the lower limit, , estimated from the observed colors of the foreground ( kpc) O6 star HD 169727, projected southeast of the pulsar (F96). Finally, the total Galactic HI column in that direction is –1.5 (Dickey & Lockman 1990). Since the values deduced from an X-ray spectrum under the assumption of standard element abundances usually exceed the measured from 21 cm observations by a factor of 1.5–3 (e.g., Baumgartner & Mushotzky 2005), this value does not contradict to those estimated from the X-ray fits and the dispersion measure. Thus, with allowance for different kinds of uncertainties, it seems reasonable to assume , with being the most plausible estimate.
With the hydrogen column density fixed at , the absorbed PL fits to the compact and extended PWN yield photon indices and , and 0.5–8 keV luminosities and ergs s-1 (see also Fig. 6 and Table 1; the extended PWN luminosity is for the polygon region).
2.4. Pulsar spectrum
Although the peak of the surface brightness distribution is clearly dominated by the pulsar, the surface brightness of the inner PWN grows toward the pulsar’s position, which introduces some ambiguity in separating the pulsar contrubution from that of the PWN and complicates the measurement of the pulsar spectrum. However, based on the surface brightness distribution near the peak (see, e.g., the one-dimensional profiles in Fig. 2), it seems reasonable to assume that the PWN surface brightness reaches a plateau of about in size, centered on the pulsar, which can be used to estimate the local background at the pulsar position. Therefore, we extracted the pulsar spectrum from a small circular aperture (small black circle in Fig. 1, bottom left) with the radius of 1 ACIS pixel (, 55% encircled energy radius) and took the background from the circular annulus centered on the pulsar (shown by the white circles in Fig. 1, bottom left). The background contributes counts to 62 counts extracted from the source region. Given the small number of source counts and the appreciable background contribution, we chose not to subtract the background channel by channel but rather fit the background spectrum (modeled as an absorbed PL model with the same as for the source) simultaneously with the source spectrum.
To obtain better constrained fits with the small number of counts available, we are forced to freeze the hydrogen column density. Since the interpretation of the pulsar spectrum (e.g., thermal vs. nonthermal) may depend on the choice of the value, we fit the pulsar spectrum with the absorbed PL model for three plausible values of the hydrogen column density: , 1.0, and 1.3 (see Table 2 and Fig. 7). As expected, the inferred photon indices depend on the choice of , changing from to with increasing (see Table 2 for details). The pulsar’s absorbed flux is ergs cm-2 s-1 in the 0.7–7 keV band (corrected for the background and finite aperture). The unabsorbed pulsar luminosity in the 0.5–8 keV band increases from to ergs cm-2 s-1, respectively.
The steepness of the best-fit PL spectra, especially in the case of larger , indicates the presence of thermal emission from the NS surface, such as seen in other Vela-like pulsars (e.g., Pavlov et al. 2001). However, adding the second blackbody (BB) component is not justified statistically (i.e. the contribution of the BB component is negligible, and the fitting parameters of the BB component are unconstrained) at and 1.0, while in the case of the fit converges to a reasonable (although still poorly constrained) values of the surface temperature eV, projected emitting area km2 (corresponding to the bolometric luminosity ergs s-1), and the slope of the PL component . The fitting parameters become better constrained if we fix the area, but the best-fit temperature and luminosity depend on the value of because of the strong - correlation. For instance, increases from 97 to 139 eV, and decreases from to ergs s-1, when decreases from 500 km2 (approximate projected area of the NS surface) to 20 km2 (projected area in the PL+BB fit for the Vela pulsar spectrum). Given the errors of these fits and the uncertainty of ISM absorption, the obtained BB parameters are just crude estimates. We can, however, treat ergs s-1 as an upper limit for the bolometric luminosity.


2.5. Other X-ray sources
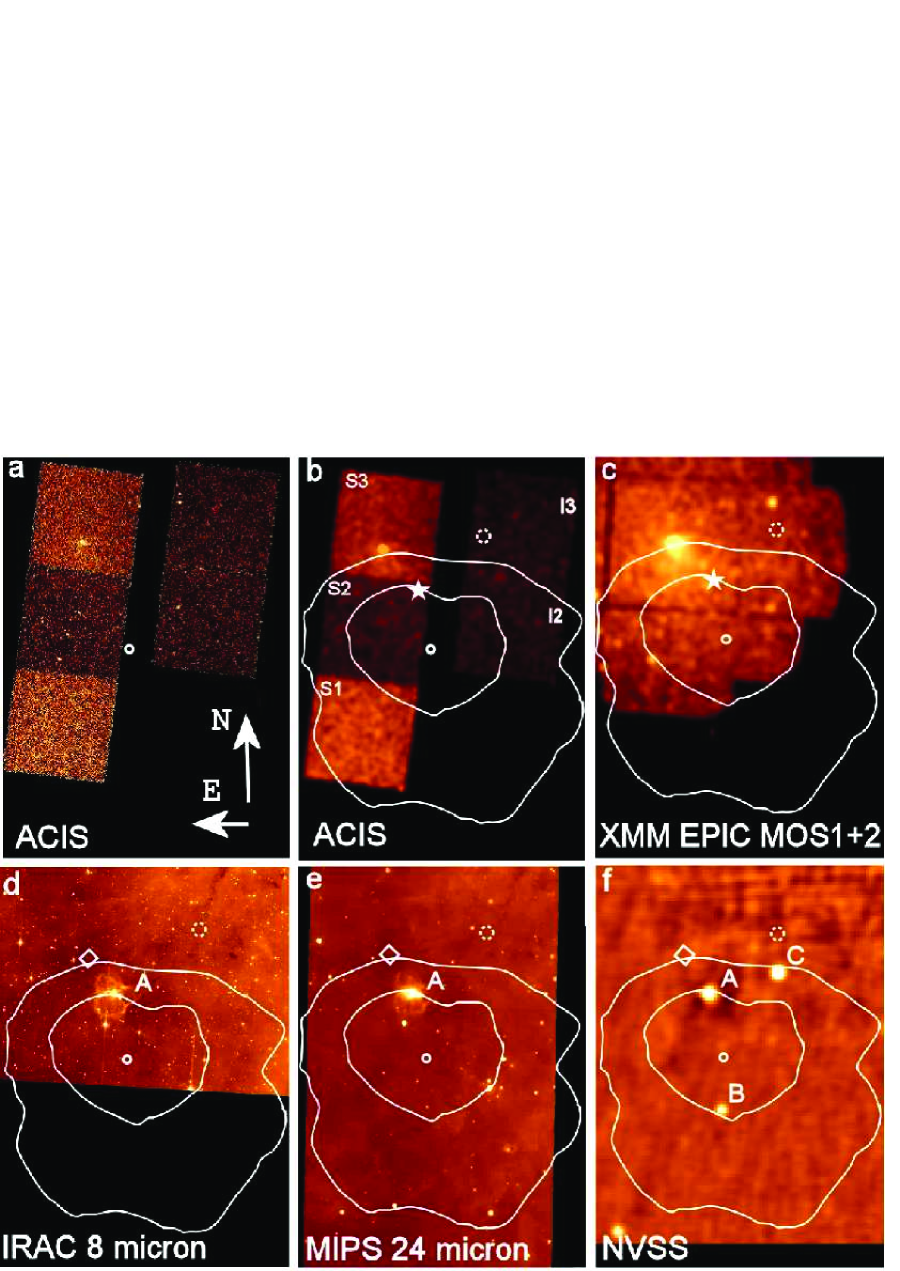
Among X-ray sources serendipitously detected in this ACIS observation, most interestng are CXOU 182614.4133448 (Source X, see Figs. 1 and 2) east of the B1823 pulsar, and a few sources on the S2 and I2 chips projected within the brightest part of HESS J1825 (see Fig. 8), which might supply additional ultrarelativistic electrons to power HESS J1825. The positions and spectral characteristics of these sources are presented in Table 3.
The strongly absorbed () point-like Source X shows a hard spectrum () and the 1–8 keV flux of ergs cm-2 s-1 (see Table 3 for other properties). There is no an obvious optical-NIR counterpart for this source in stellar catalogs. 2MASS images show a point source with , and close to Source X (, ), but, since the offset of from the pulsar position exceeds the combined centroiding and absolute astrometry error ( at the 90% confidence level), the 2MASS source is unlikely to be a counterpart of Source X. Based on the X-ray spectrum, we conclude that Source X is, most likely, a background AGN, not related to either B1823 or HESS J1825.
The other X-ray sources listed in Table 3 also look point-like (the apparent extension of the sources s4 and i1 can be explained by the asymmetric PSF broadening at the large off-axis distances). 2MASS and Digital Sky Survey (DSS333see http://archive.eso.org/dss/dss) images do not show NIR-optical objects within most conservative error circles around the sources s1, s5, and i1 (the nearest objects are offset by , , and , respectively). The strongly absorbed s1 and s5 are likely extragalactic sources (possibly AGNs), while the nature of i1 is unclear. The source s4 shows a possible NIR-optical counterpart DENIS J182620.9134425 (offsets are in the range of – in different catalogs; magnitudes , , in the 2MASS catalog; , –16.4, –17.1, –19.1 in other catalogs). The source looks slightly extended in the NIR-optical images, likely a blend of two field stars. Close to the sources s2 and s3, there are point-like NIR-optical objects (DENIS J182617.1134111 and J182618.0134225, respectively), but their relatively large offsets from the X-ray positions (– and –, respectively, somewhat different in different catalogs) make their association with the X-ray sources questionable. Overall, the X-ray sources in the brightest part of HESS J1825 are rather faint and unremarkable, and there is no evidence that any of the sources is related to the VHE -ray source HESS J1825.
2.6. Vicinity of PSR B1823-13 and HESS J1825–137 at other wavelengths
To check whether or not there are luminous sources within the central part of HESS J1825, which could enhance the VHE -radiation by providing additional photons for the inverse Compton (IC) scattering off ultrarelativistic electrons, we have examined optical-NIR, IR, and radio images of this field. Three examples, Spitzer IRAC 8 m and MIPS 24 m images from the Galactic Legacy Infrared Mid-Plane Survey (GLIMPSE444http://www.astro.wisc.edu/sirtf/) and a NRAO VLA Sky Survey (NVSS; Condon et al. 1998) 1.4 GHz image are shown in Figure 3. The images do not show anything remarkable in the immediate vicinity, within , of B1823. The most interesting object within the brightest part of HESS J1825 is the extended ( in size) source, marked A in Figure 3, prominent in both the IR and radio images. The source with a two-sided shell morphology is centered at , (measured in the IRAC 8 m image), i.e. between the pulsar and the brightest part of HESS J1825. It is listed in the IRAS catalog of point sources555Infrared Astronomical Satellite Catalog, 1988, The Point Source Catalog, ver. 2.0, NASA RP-1190. as IRAS 18231–1340, with fluxes of 4.25, 13.4, 161, and 393 Jy at 12, 25, 60, and 100 m, respectively. Its radio fluxes are 0.13 and 0.03 Jy at 4.85 and 1.4 GHz, respectively (Griffith et al. 1994; Condon et al. 1998). This object is barely visible in the IRAC 4.5 m image, and it is not seen in the 2MASS images of the field. The IR-radio spectrum and the lack of an extended optical or NIR counterpart suggest that the IR emission is thermal emission of dust with –50 K, possibly mixed with the molecular/atomic cloud(s) that are heated and partly ionized by radiation from embedded young stars. Its luminosity can be crudely estimated as ergs s-1.
The nature of the other two bright radio sources within the brightest part of HESS J1825 (B and C in Fig. 3f), centered at , and , , respectively, is unknown. However, as they are not seen in IR, their bolometric luminosity is much lower than that of Source A.
3. Proper motion of PSR B1823–13
We measured the proper motion using two unrelated archival VLA observations. Both observations were made in the 20 cm band in the A-configuration providing about resolution. The reduction technique is identical to that used by Brisken et al. (2006) in the determination of the proper motion of PSR B1800–21 using 1.4 GHz data. All synthesis calibration and imaging were performed using the AIPS software package. Project AF118 was observed on MJD 46573 in right circular polarization in spectral line mode providing 15 channels spanning 50 MHz bandwidth at 1385 MHz. The upper 4 channels were discarded due to severe interference. Project AC761 was observed on MJD 53265 in dual circular polarization in spectral line mode providing 15 channels across 25 MHz at 1665 MHz. After standard calibration and editing, AIPS task UVFIX was used to correct the baseline vectors of the pulsar field for the half-integration time time-stamp error common to all VLA observations as well as including relativistic aberration correction. UVFIX was also used to convert the B1950 coordinates used in AF118 to the J2000.0 coordinates.
The temporal and spectral resolution of both data sets allowed imaging of the entire 25′ primary beam. In addition to the pulsar, eleven other sources were detected in both epochs, five of which were bright and compact enough to be used as reference sources. Accurate positions for the pulsar and these five objects were measured for each epoch. The motion of the pulsar was then measured in a frame defined by these sources using a fitting prodedure described in McGary et al. (2001), yielding a proper motion mas yr-1, mas yr-1 (68% confidence intervals). The global linear fit used to determine the proper motion and a possible translation and rotation of the coorinates between the two epochs yielded a reduced of 1.3, indicating that the formal uncertainties may be underestimates at the 15% level. Assuming a distance of kpc, this proper motion implies a local standard of rest (LSR) proper motion of mas yr-1, mas yr-1, which corresponds to the velocity km s-1 at a position angle of (east of north). At this proper motion, the pulsar has traveled about in the plane of the sky during its characteristic age of 21 kyr. The projected birthplace of the pulsar (hence the SN location) is marked in Figure 3b-f.
4. Discussion
4.1. Pular Wind Nebula
From their analysis of the XMM-Newton data, G03 have concluded that the B1823 PWN (which they designated as G18.0–0.7) is comprised of two components (“core” and “diffuse”) of different brightness and size and perhaps different spectra. Our Chandra ACIS observation has confirmed the presence of the two components, which we designate as the “compact PWN” and “extended PWN”, and allowed us to investigate the properties of the compact PWN in much more detail. The better resolved images and the measurement of the pulsar’s proper motion not only allow a more definitive interpretation of the compact PWN properties, but they also help better constrain the models the puzzling extended PWN and its connection to HESS J1825.
4.1.1 Compact PWN
The east-west elongation of the compact PWN, approximately coinciding with the direction of the pulsar’s proper motion (see Fig. 2), strongly suggests that the compact PWN is shaped by the oncoming flow of the ambient matter in the pulsar’s reference frame. The transverse velocity of the pulsar, km s-1, is high enough to assume that the pulsar’s motion is supersonic, i.e., , or, equivalently, K, where is the Mach number, is the pulsar’s speed, is the angle between the velocity vector and the line of sight, km s-1 is the speed of sound, is the molecular weight, and is the temperature of the ambient medium. When a pulsar moves supersonically, the pulsar wind (PW) termination shock (TS) acquires a bow-like shape ahead of the pulsar, with the apex at a distance , determined by the balance between the PW pressure and the ram pressure, , where is the density of the ambient medium, and takes into account anisotropy of the pulsar wind. For B1823, these equations yield ergs cm-3 and cm, which translates into the projected angular distance , where .
In an idealized picture, the shocked PW, responsible for the PWN X-ray emission, is confined between the TS and the contact discontinuity (CD) surface, which separates the shocked PW from the shocked ambient medium. For and a nearly isotropic preshock PW with a low magnetization parameter , the distance between the pulsar and the head of the CD surface is (Bucciantini et al. 2005, hereafter B05). In a more realistic picture, one should not expect a smooth CD surface because it is unstable. As a result, the shocked PW can penetrate into the shocked ambient medium, and vice versa.
The images of the compact PWN (Figs. 1 and 2) do not show a sharp PWN boundary ahead of the pulsar that could be unambiguosly identified as a CD surface head. Instead, we see a two-component structure, with the bright inner component up to east of the pulsar and some fuzzy emission discernible up to . Although the quality of the image does not allow one to make a definitive conclusion, we can assume that the fuzzy emission represents the shocked PW that has penetrated into the shocked ambient medium because of CD instabilties, while the inner component is emitted by the shocked PW immediately beyond the TS, so that – seems to be a reasonable estimate for the angular distance to the TS head. Scaling to , we can estimate the ambient number density, cm-3, and the ram pressure, ergs cm-3. Such a ram pressure is typical for Vela-like pulsars (Kargaltsev et al. 2007), while such a number density can be found in a warm phase of the ISM or within an evolved SNR. As no SNR emission is seen in the vicinity of B1823, we cannot measure the temperature and pressure of the ambient medium, but it seems reasonable to assume K, which could explain the lack of X-ray SNR emission. Scaling the temperature to this value, we obtain , km s-1, and .
The existing MHD models of bow-shock PWNe associated with supersonically moving pulsars assume a nearly isotropic preshock PW. However, the high-resolution Chandra images of the whole compact PWN can hardly be reconciled with this assumption. According to B05, the TS in an isotropic PW of a supersonically moving pulsar acquires a bullet-like shape, with the bullet’s cylindrical radius and the distance of its back surface from the pulsar . The shocked PW outside the TS is confined inside the CD surface, which has a cylindrical shape behind the TS bullet, with a cylindrical radius . The collimated PW flows with subrelativistic velocities: – in the inner channel, , and up to – in the outer channel, (see Figs. 1–3 in B05). The images of the compact PWN are not quite consistent with this simple picture. First of all, the bright inner component, which could be naturally associated with the PW immediately outside the TS, is inclined to the direction of the proper motion by an angle , while it should be coaligned with the proper motion if the wind is isotropic. Second, the outer PWN, which might represent the shocked PW confined by the CD surface, not only has an irregular boundary (which could be explained by instabilities), but it is also rather nonuniform. (Particularly puzzling is the blob west of the pulsar; see Figs. 1 and 2, and §2.2). Finally, we do not see an extended tail behind the TS aligned with the proper motion direction. These differences between the model and the observed image suggest that the preshock PW is, in fact, substantially anisotropic. To understand the PW geometry and interpret the PWN morphology more or less unambiguously, deeper high-resolution X-ray observations are needed, as well as modeling of intrinsically anisotropic, magnetized PWs from fast-moving pulsars. Here we can only speculate that the inner PWN likely represents a shocked equatorial outflow (similar to the famous Crab torus; Weisskopf et al. 2000), seen almost edge-on. If this is the case, then the spin axis of the B1823 pulsar is strongly misaligned (by – in the plane of the sky) with the direction of its motion, contrary to many other pulsars. The absense of jets along the spin axis in the observed images can be explained by their faintness (e.g., the jets of the Vela PWN would be unobservable at kpc with such an exposure – see Fig. 8 in Kargaltsev et al. 2007), or possibly the jets are deflected (or even crushed) by the oncoming flow of the ambient medium. The blob and the apparent wiggles in the west part of the outer component could be ascribed to instabilities in the tail formed by the supersonic motion of the pulsar.
The luminosity, ergs s-1 in the 0.5–8 keV band666We should note that our estimate for the compact PWN luminosity is a factor of 3 lower than that obtained by G03 for the “core” component. The discrepancy is possibly caused by the much larger area from wich G03 extracted the spectrum (1018 vs. 225 arcsec2), which included some contribution from the extended (“diffuse”) PWN, the pulsar, and field sources, such as Source X in our Figures 1 and 2. Also, G03 extracted the background spectrum from a region outside the extended PWN, while we used an annulus filled with the extended PWN emission (see §2.3). , the X-ray efficiency, , and the spectral slope, (at the assumed ) of the compact PWN are not unusual for Vela-like PWNe (e.g., Kargaltsev et al. 2007; Kargaltsev & Pavlov 2007). Also, similar to other Vela-like PWNe, the PWN luminosity exceeds by a factor of a few the pulsar luminosity in the same X-ray energy range, .
4.1.2 Extended PWN
The morphology of the extended PWN is even more puzzling than that of the compact one. In the conventional picture of a bow-shock PWN, we would expect to see an extended component behind the compact PWN of the moving pulsar, which would look like a “tail”. In B1823, however, the PWN extends southward from the pulsar, almost perpendicular to the proper motion direction, similar to the extended diffuse PWN of the Vela pulsar (Pavlov et al. 2003). This means that something is deflecting (or has deflected) the shocked PW in this direction. One could imagine a local north wind in the turbulent ambient medium, but such a wind would have to blow with a velocity of several hundred km s-1 (comparable to the pulsar velocity) to displace the PWN bubble. If such a wind were blowing now, we would see the compact PWN elongated southward from the pulsar, and, more importantly, it would be not a usual wind but a shock, since the required velocity almost certainly exceeds the sound speed. Thus, it seems we have to assume that the PWN bubble was crushed/displaced by a passing shock some time ago. A natural candidate for such a shock is the reverse shock from the surrounding SNR that has propagated back inward and collided with the PWN, displacing the PWN bubble from the pulsar, as has been suggested by Blondin et al. (2001) for the strongly dispaced Vela X component of the Vela PWN. Such an explanation for the one-sided extended PWN of B1823 has been proposed by G03, and we currently do not see an alternative explanation. If this hypothesis is correct, we may expect the extended PWN to consist of two components: a strongly displaced one (similar to Vela X), which represents a relic population of relativistic electrons that have lost a substantial fraction of their energy to synchrotron, inverse Comption, and adiabatic cooling, and a younger one, which represents electrons that entered the PWN after the inverse shock passage.
Although the crushed/dragged PWN hypothesis looks attractive and provides a plausible explanation for the extended X-ray PWN, we should mention that it does not so readily expalin the huge, about 70 pc at kpc, size of the TeV PWN. Traveling 70 pc in time requires the average velocity km s-1, too high for a reverse shock. Even if we assume kyr (i.e., equal to the pulsar’s spindown age), we still need km s-1. Therefore, it is hard to imagine how the reverse shock could have dragged the relic PWN so far, even if it passed the pulsar very long time ago. Perhaps, one should explore another possibility, that during a substantial fraction of the pulsar’s lifetime the PWN electrons have been transported southward from the pulsar along an anisotropic large-scale magnetic field. Alternatively, one might assume a strongly anisotropic supply of electrons into the PWN, e.g., through a one-sided jet (which, however, is not seen in the images available). At this point, however, these possibilities remain highly speculative.
As has been noticed by G03, the extended PWN spectrum is softer than the compact PWN spectrum, which is also confirmed by our results (see Fig. 5). The difference of the photon indices, , supports the hypothesis that the extended X-ray PWN electrons have lost their energy to synchrotron cooling after traveling a distance of a few parsecs. The slope we found for the X-ray spectrum is very close to the slope of the VHE -ray spectrum within from the pulsar, –2.0 (A06), which confirms that both the X-ray and -ray emission are due to the same electron population with a power-law energy spectrum , with –3. Interestingly, the TeV spectrum at larger distances from the pulsar, where we do not see the X-ray PWN, becomes even softer ( grows up to at from the pulsar).
Because we can see only part of the extended PWN in our ACIS image (see §2.2), we can measure only a fraction of its X-ray luminosity ( ergs s-1 in the 3.4 arcmin2 region shown in Fig. 1, bottom right). The total extended PWN luminosity should be a factor of a few higher. For instance, G03 found ergs s-1 in a 33.4 arcmin2 area, which corresponds to the extended PWN efficiency , a factor of higher than that of the compact PWN.
4.2. Pulsar
Although we have resolved the pulsar from the PWN, the small number of pulsar counts detected and the strong and not well determined background from the inner component of the compact PWN preclude a precise spectral analysis. We can only estimate the pulsar luminosity, ergs s-1 in the 0.5–8 keV band, which is a small fraction, , of the pulsar’s spindown power . The slope of the pulsar spectrum, –3, is strongly correlated with the ISM column density (see Fig. 7). It is likely that the spectrum consists of two components, magnetospheric and thermal, but the photon statistics does not allow one to separate these components unambiguously. For (at the higher end of the plausible range) and projected emitting areas in the range of – km2, we found –150 eV and – ergs s-1 for a possible BB component (higher luminosities correspond to lower temperates and larger emitting areas). These temperatures and luminosities are generally similar to those of other Vela-like pulsars (e.g., eV, km2, ergs s-1 for the Vela pulsar; Pavlov et al. 2001). However, because of the large uncertainties and poorly constrained , we cannot be sure even in the detection of the thermal component, not to mention measuring its parameters. Therefore, we should treat the estimated bolometric luminosities of B1823 as upper limits rather than actually measured values. The most conservative of the above limits, ergs s-1, corresponding to km2 and eV, is close to the bolometric luminosities predicted by the so-called “standard” NS cooling model for the NS age of 20 kyr (see, e.g., Fig. 2 in Tsuruta 1998). Overall, we can conclude that B1823 looks like a typical Vela-like pulsar, but a deeper high-resolution observation is needed to infer its properties in more detail.
4.3. The lack of a host SNR?
We see no emission in our ACIS images that could be ascribed to an SNR associated with B1823, and no such emission has been reported from the previous X-ray (F96; G03) or radio (Braun et al. 1989; Brogan et al. 2006) observations. Using our proper motion measurement, we extrapolated the pulsar trajectory back in time to check whether or not it crosses a known SNR. The nearest SNR to the pulsar trajectory is the shell SNR G18.16–0.16 (Brogan et al. 2006) at a distance of from the current pulsar position. Since the extrapolated trajectory misses the SNR center by , we conclude that G18.16–0.16 is not related to B1823.
The failure to detect the host SNR in X-rays can be attributed to the strong ISM absorption of the soft thermal emission from the SNR interiors (see Kargaltsev et al. 2007, where a similar situation is discussed regarding the Vela-like PSR B1800–21, which also lacks an associated SNR). Therefore, it is possible that B1823 is still within the interiors of an evolved SNR, which is undetectable in X-ray or radio, but whose pressure can contribute to the PWN confinement.
4.4. Connection between B1823 and HESS J1825
The important discovery of the VHE -ray spectral softening with increasing distance from B1823 (A06) has provided further evidence that this pulsar/PWN is the main source of the ultrarelativistic electrons powering the TeV plerion. Qualitative models for this VHE -ray source have been discussed in a number of works (A06; de Jager et al. 2005; de Jager 2007). Generally, they interpret the -ray emission as produced by the Compton upscattering of the CMB photons by electrons with energies –100 TeV [electron Lorentz factor –], supplied by the B1823 pulsar. The fact that the pulsar is located at the northern boundary of the TeV plerion is explained by the effect of the SNR reverse shock that has dragged the relic PWN southward. (An alternative explanation, that the TeV plerion represents electrons left behind the pulsar moving northward, is invalidated by our measurement of the proper motion.) The softening of the TeV spectrum with the distance from the pulsar can be ascribed to the radiative losses (mostly to the IC scattering losses) or some energy-dependent “convection”, or variation of the particle injection spectrum with the pulsar’s age. As A06 note, even at very low ambient magnetic fields, G, when the IC energy losses dominate the synchrotron losses, the -ray efficiency, , is unrealistically high if we use the current value of . This supports the hypothesis that the VHE -ray emission is produced by relic electrons emitted by the pulsar when it was very young and much more powerful.
Modelling of the TeV plerion is beyond the scope of this work. We only note some open problems with the current interpretation of this remarkable object. First, as we have mentioned in §4.1, it is difficult to reconcile the very large size of the TeV plerion with the hypothesis that the relic PWN was dragged by the SNR reverse shock to its current position. In principle, other sources of ultrarelativistic electrons within the size field could contribute to the observed TeV emission and increase the apparent size of the TeV source. Our analysis of several X-ray sources in the brightest part of the TeV plerion has not shown any obvious candidates (see §2.5), but one cannot rule out the possibility that there are such sources outside the small ACIS field-of-view.
Another possible problem with the current interpretation of the TeV source is the spatial distribution of its brightness and spectrum. The brightest part of the TeV plerion is offset by ( pc in the plane of the sky) south-southwest of the pulsar (see Fig. 1 of A06), while the plerion extends further in the same direcion (almost perpendicular to the direction of the pulsar’s proper motion). One could speculate that the relic PWN was displaced by some time ago [which would require a reverse shock speed of km s-1], and its relativistic electrons have been diffusing from that position. It is however, unclear as to why they diffused not radially but preferentially in the south-southwest direction. If the passing shock not just displaced the relic PWN to a certain distance but smeared it all over the whole extent of the currently seen TeV plerion, then a very high shock speed would be required (see §4.1). Furthermore, the spectral map of HESS J1825 (see Figs. 5 and 6 of A06) shows that the VHE -ray spectrum softens radially not from the maximum of the brightness distribution but from the pulsar position. This hints that at least some contribution to the TeV photons comes from the same young electrons that are responsible for the extended X-ray PWN of a much smaller size. This conjecture is further supported by the fact that the spectral slopes of the X-ray (synchrotron) and -ray (IC) spectra are about the same at a few arcminute distance from the pulsar, which suggests that they are generated by the same population of electrons. On the other hand, if the TeV -ray emission is due to the IC scattering of the CMB photons, and the relativistic electrons are mostly supplied by the pulsar, one should expect the TeV brightness to peak at the pulsar position, not from the pulsar. This inconsistency might be alleviated assuming that in the immediate vicinity of the pulsar, where the electrons are more energetic, they upscatter the CMB photons in the Klein-Nishina regime, which results in a lower brightness of the IC scattered radiation, but it remains to be seen from detailed models whether or not this assumption is realistic. Overall, it seems plausible at this point that, at least in the extended X-ray PWN region, the TeV emission can be produced by two electron populations of different ages. To infer the properties of these populations, deep observations with XMM-Newton and GLAST of a region from which both X-ray and VHE -ray emission is seen would be very helpful.
Another issue related to the nature of the TeV plerion and its connection to the B1823 pulsar/PWN is whether the TeV photons are produced by upscattering of the CMB or some other radiation. Close to the Galactic plane, where HESS J1825 is situated, a factor of a few higher radiation energy density can be provided by IR emission from interstellar dust and Galactic starlight. For instance, at the galactocentric distance of 4 kpc, the models of interstellar radiation by Strong et al. (2000) give the energy densities of 0.6 and 2.7 eV cm-3 for these two components, respectively, versus 0.26 eV cm-3 for the CMB. Moreover, if there are very luminous sources of radiation (such as molecular/dust complexes in star-forming regions) in the vicinity of the source of ultrarelativistic electrons, the high radiation energy density around these sources can strongly enhance the TeV luminosity (see, e.g., Kargaltsev & Pavlov 2007). In this regard, the bright radio-IR Source A (see Fig. 3), whose spectrum peaks at m, might be of some interest. With the bolometric flux ergs cm-2 s-1, its radiation energy density exceeds the ambient radiation energy density at angular distances . If the distance to Source A is about the same as to B1823, and the TeV emission is produced by the IC scattering of IR photons with energies around 0.03 eV (which would require electron energies –20 TeV), then Source A could create a few arcminute size brightening. Moreover, if there are hot and massive stars hidden within this dust/molecular complex of pc size, their shocked winds could be additional sources of TeV electrons, further enhancing the VHE -ray emission from this region. (VHE -rays apparently produced by stellar winds in the open stellar cluster Westerlund 2 have recently been detected by Aharonian et al. 2007.) Although this hypothesis looks rather speculative at this point, and Source A can not be responsible for the bulk of the detected TeV radiation, dedicated observations of this region in the IR and radio would help evaluate the Source A contribution to HESS J1825.
5. Conclusions
The high-resolution Chandra ACIS observation has allowed us to resolve the B1823 pulsar from its PWN, image the PWN structure, and measure the spectra of the pulsar and the PWN components. We found that the pulsar’s X-ray luminosity, ergs s-1 in the 0.5–8 keV band, and spectrum are similar to those of other Vela-like pulsars, but the small number of pulsar counts and the contamination from the inner PWN component do not allow an unambiguous separation of the thermal and nonthermal components of the pulsar radiation.
We have measured the pulsar’s proper motion and found its transverse velocity, km s-1 at kpc, close to an average velocity of young radio pulsars. We found no indication of an SNR, in neither X-rays nor radio, between the current position of the pulsar and its birthplace, westward.
We have confirmed the presence of the compact and extended PWNe of different shapes, surface brightnesses, and spectra. The compact PWN, of pc2 size in the plane of the sky, is elongated approximately along the proper motion direcion, with the pulsar close to its leading edge. This suggests that the postshock pulsar wind in the compact PWN, responsible for its X-ray emission, is confined by the ram pressure due to the supersonic motion of the pulsar. The X-ray spectrum and luminosity, ergs s-1, of the compact PWN are similar to those of other Vela-like PWNe.
The X-ray surface brightness distribution within the compact PWN is very nonuniform. In particular, we see a much brighter inner PWN component, pc2, around the pulsar, inclined by with respect to the direction of the proper motion. Such a structure indicates that the pulsar wind is intrincically anisotropic. If the inner PWN component represents the shocked equatorial outflow from the pulsar magnetosphere, the pulsar’s spin axis is strongly inclined to the proper motion direction, in contrast to many other pulsars.
The extended PWN is mostly seen south-southwest of the pulsar (up to from the pulsar, in the ACIS image), almost perpendicular to the proper motion direction. Its softer spectrum indicates that its X-ray emission is generated by older electrons that have lost part of their energy because of the radiative cooling. The southward displacement of the extended X-ray PWN with respect to the pulsar might be caused by a strong pressure gradient in the ambient medium and/or by the reverse SNR shock, which has swept the PWN material southward.
The extended X-ray PWN is apparently connected to the VHE -ray PWN that extends in the same direction but to a much larger distance from the pulsar, up to 70 pc in the plane of the sky. The -ray emission is likely due to the IC scattering of background radiation off the relativistic electrons with energies up to 100 TeV supplied by the B1823 pulsar. However, the very high luminosity, ergs s-1, can only be explained if the bulk of -radiation is generated by relic electrons, produced long ago, when the pulsar was much more powerful. The relic electrons could be displaced from the pulsar by a reverse SNR shock, but it remains unclear as to why the -ray PWN is so large. We have not found X-ray sources in the brightest part of the -ray PWN which could significantly contribute to the -radiation. Although the IR-radio images of the field show a star-forming region in the brightest part of the -ray PWN, which could enhance the -ray emission by supplying additional photons for the IC scattering, and perhaps even additional relativistic electrons, it can be responsible only for a small fraction of the observed VHE -radiation. To better understand the multiwavelength nature of the complex B1823 PWN, deep X-ray and IR observations of the field would be particularly useful.
References
- (1) Aharonian, F. A., et al. 2005, A&A, 442, L25
- (2) Aharonian, F. A., et al. 2006, A&A, 460, 365 (A06)
- (3) Aharonian, F. A., et al. 2007, A&A, 467, 1075
- (4) Baumgartner, W. H., & Mushotzky, R. F. 2006, ApJ, 639, 929
- (5) Blondin, J., Chevalier, R., & Frierson, D. 2001, ApJ, 563, 806
- (6) Braun, R., Goss, W. M. & Lyne, A. G. 1989, ApJ, 340,355
- (7) Brisken, W. F., Carillo-Barragán, M., Kurtz, S., & Finley, J. P. 2006, ApJ, 652, 554
- (8) Brogan, C. L., Gelfand, J. D., Gaensler, B. M., Kassim, N. E., & Lazio, T. J. W. 2006, 639, L25
- (9) Bucciantini, N., Amato, E., & Del Zanna, L. 2005, A&A, 434, 189 (B05)
- (10) Cash, W. 1979, ApJ, 228, 939
- (11) Clifton, T. N., Lyne, A. G., Jones, A. W., McKenna, J., & Ashworth, M. 1992, MNRAS, 254, 177
- (12) Condon, J. J., et al. 1998, AJ, 115, 169
- (13) Cordes, J. M., & Lazio, T. J. 2002, astro-ph/0207156
- (14) de Jager, O. C., et al. 2005, in Proc. 29th International Cosmic Ray Conf., vol. 4, eds. B. Sripathi Acharya, S. Gupta, P. Jagadeesan, A. Jain, S. Karthikeyan, S. Morris, & S. Tonwar (Mumbay: TIFR), p.239
- (15) de Jager, O. C. 2007, ApJ, 658, 1177
- (16) Finley, J. P., Srinivasan, R., & Park, S. 1996, ApJ, 466, 938 (F96)
- (17) Frail, D. A., & Scharringhausen, B. R. 1997, 480, 364
- (18) Gaensler, B. M., Stappers, B. W., Frail, D. A., Moffett, D. A., Johnston, S., & Chatterjee, S. 2000, MNRAS, 318, 58
- (19) Gaensler, B. M., Schulz, N. S., Kaspi, V. M., Pivovaroff, M. J., & Becker, W. 2003, ApJ, 588, 441 (G03)
- (20) Griffith, M. R., Wright, A. E., Burke, B. F., & Ekers, R. D. 1994, ApJS, 90, 179
- (21) Hobbs, G., Lyne, A. G., Kramer, M., Martin, C. E. & Martin C., J., 2004, MNRAS, 353, 1311
- (22) Kargaltsev, O., & Pavlov, G. G. 2007, ApJ, submitted (arXiv:astro-ph/0705.2378)
- (23) Kargaltsev, O., Pavlov, G. G., & Garmire, G. P. 2007, ApJ, 660, 1413
- (24) Kaspi, V. M., Roberts, M. S. E., & Harding, A. K. 2006, in Compact Stellar X-ray Sources, ed. W. H. G. Lewin & M. van der Klis (Cambridge: Cambridge Univ. Press), 279
- (25) McGary, R. S., R. S., Brisken, W. F., Fruchter, A. S., Goss, W. M., & Thorsett, S. E. 2001, ApJ, 1192
- (26) Mori, K., Tsunemi, H., Miyata, E., Baluta, C. J., Burrows, D. N., Garmire, G. P., & Chartas, G. 2001, in ASP Conf. Ser. 251, New Century of X-Ray Astronomy, eds. H. Inoue & H. Kunieda (San Francisco: APS), 576
- (27) Pavlov, G. G., Zavlin, V. E., Sanwal, D., Burwitz, V., & Garmire, G. P. 2001, ApJ, 522, 129
- (28) Pavlov, G. G., Teter, M. A., Kargaltsev, O., & Sanwal, D. 2003, ApJ, 591, 1157
- (29) Skrutskie, R. M., et al. 2006, AJ, 131, 1163
- (30) Strong, A. W., Moskalenko, I. V., & Reimer, O. 2000, ApJ, 537, 763
- (31) Taylor, J. H., & Cordes, J. M. 1993, ApJ, 411, 674
- (32) Teter, M. A., Sanwal, D., Pavlov, G. G., Fukumura, K., Tsuruta, S. 2003a, BAAS, 36, 634
- (33) Teter, M. A., Sanwal, D., Pavlov, G. G., & Tsuruta, S. 2003b, BAAS, 35, 706
- (34) Tsunemi, H., Mori, K., Miyata, E., Baluta, C. J., Burrows, D. N., Garmire, G. P., & Chartas, G. 2001, ApJ, 554, 496
- (35) Tsuruta, S. 1998, Phys. Rep., 292, 1
- (36) Yakovlev, D. G., & Pethick, C. J. 2004, ARA&A, 42, 169
- (37) Weisskopf, M. C. et al. 2000, ApJ, 536, L81
| Region | aaSpectral flux in units of photons cm-2 s-1 keV-1 at 1 keV. | bbObserved energy flux in units of ergs cm-2 s-1, in the 0.7–7 keV band. | ccUnabsorbed energy flux in units of ergs cm-2 s -1, in the 0.5–8 keV band. | /do f | |
|---|---|---|---|---|---|
| Compact PWN | 0.93/18 | ||||
| Extended PWN | 1.28/13 |
| Model | aaSpectral flux in units of photons cm-2 s-1 keV-1 at 1 keV. or bbProjected area of the emitting region for the BB model, in units of km2, fixed in the fits. | or ccBB temperature in eV. | or ddUnabsorbed PL luminosity in the 0.5–8 keV band or bolometric BB luminosity, in units of ergs s-1. | ||
|---|---|---|---|---|---|
| PL | 0.6 | ||||
| PL | 0.8 | ||||
| PL | 1.1 | ||||
| PL+BB(PL) | 0.7 | ||||
| PL+BB(BB) | |||||
| PL+BB(PL) | 1.3 | 651 | 0.6 | ||
| PL+BB(BB) | 651 |
| SourceaaSource designation as shown in Figs. 1 and 8. | R.A. | Decl. | bbRadius of the position error circle at the 68% confidence level. | ccSpectral flux in units of photons cm-2 s-1 keV-1 at 1 keV. | ddObserved flux in the 1–8 keV band, in units of ergs cm-2 s-1. | eeBest-fit value of the unabsorbed PL flux in the 0.5–8 keV band, in units of ergs cm-2 s-1. | ||
|---|---|---|---|---|---|---|---|---|
| X | 18:26:14.43 | 13:34:48.0 | ||||||
| s1 | 18:26:14.06 | 13:40:35.8 | ||||||
| s2 | 18:26:17.18 | 13:41:12.7 | ||||||
| s3 | 18:26:17.99 | 13:42:27.5 | ||||||
| s4 | 18:26:20.88 | 13:44:25.7 | ||||||
| s5 | 18:26:24.76 | 13:37:06.2 | ||||||
| i1 | 18:25:40.55 | 13:40:11.2 |