Molecular content of a type-Ia SN host galaxy at
Abstract
We study the properties and the molecular content of the host of a type-Ia supernova (SN1997ey). This host is the brightest submillimetre source of the sample of type-Ia supernova hosts observed at 450m and 850m by Farrah et al.. Observations were performed at IRAM-30m to search for CO(2-1) and CO(3-2) lines in good weather conditions but no signal was detected. The star formation rate cannot exceed 50 /yr. These negative results are confronted with an optical analysis of a Keck spectrum and other data archives. We reach the conclusion that this galaxy is a late-type system (0.7 ), with a small residual star-formation activity (0.2 M⊙ yr-1) detected in the optical. No source of heating (AGN or starburst) is found to explain the submillimetre-continuum flux and the non-CO detection excludes the presence of a large amount of cold gas. We thus suggest that either the star formation activity is hidden in the nucleus (with ) or this galaxy is passive or anemic and this flux might be associated with a background galaxy.
keywords:
supernovae: individual: SN1997ey – radio lines: galaxies – submillimetre – galaxies: general – methods: observational1 Introduction
Standardised type-Ia supernovae (SN) have been extensively studied to probe the expansion of the Universe for the past decade (e.g. Riess, Press Kirshner 1996; Perlmutter et al. 1997, 1999; Astier et al. 2006). The mechanisms that rule these cosmic explosions are not fully understood. A better knowledge of their environment and of their host galaxies is important to understand possible systematics, which could affect these cosmological probes (e.g. Combes, 2004), and the progenitor systems, which are also important for the evolution of galaxies (e.g. Hamuy et al., 2003; Panagia et al., 2006; Howell et al., 2007). The known scatter of the SNIa standard candles is corrected empirically on the basis of the observed tight correlation between the peak luminosity and the decline rate of the light curve (Phillips, 1993; Riess et al., 1996; Perlmutter et al., 1997). Standardised SNIa detected at high-z do not exhibit any sign of residual extinction (e.g. Riess et al., 1998; Perlmutter et al., 1999; Farrah et al., 2002; Sullivan et al., 2003), as selection effects most probably eliminate the most obscured SN.
A submillimetre survey of 31 SN-Ia hosts (Farrah et al., 2004; Clements et al., 2005) has detected two strong sources at 850 m at the level. It was surprising to find submillimetre-bright galaxies in this sample of SN-Ia hosts. Nevertheless, this strengthens the observation of the correlation of the SNIa rate with the Star-Formation Rate (SFR) (e.g. Sadat et al., 1998; Sullivan et al., 2006), and the evidence (e.g. Mannucci, Della Valle Panagia 2006; Sullivan et al. 2006) of the possible association of one type of SNIa with recent star-formation. In addition, according to their optical morphology (Farrah et al., 2004), these submillimetre-bright hosts look like ordinary disc galaxies. In order to try to better understand the nature of these hosts, we try to observe the CO lines of SN1997ey host, whose continuum has also been detected at 450 m at the level.
In section 2, we discuss the characteristics of this host galaxy relying on data archives. In section 3, we present the CO observations performed at IRAM-30m. In section 4, we discuss these results.
Throughout this paper, we adopt a flat cosmology, with , and km s-1 Mpc-1 (Spergel et al., 2007).
2 Characteristics of SN1997ey host
SN1997ey host has been initially detected as the host of a type Ia supernova (SN1997ey, Pain et al., 2002). It was first detected with ground-based photometry (, Pain 2004, private communication). Its spectroscopic redshift () was determined with the Keck telescope (Nugent et al., 1998). It was then observed by HST/STIS (HST Proposal 8313, Ellis (1999), see also Fig. 3). More recently, investigating its dust content, Farrah et al. (2004) detected the submillimetric continuum of this galaxy at 450 and 850 m. We review in this section these properties in more details.
2.1 Optical spectroscopy and detection of SN1997ey

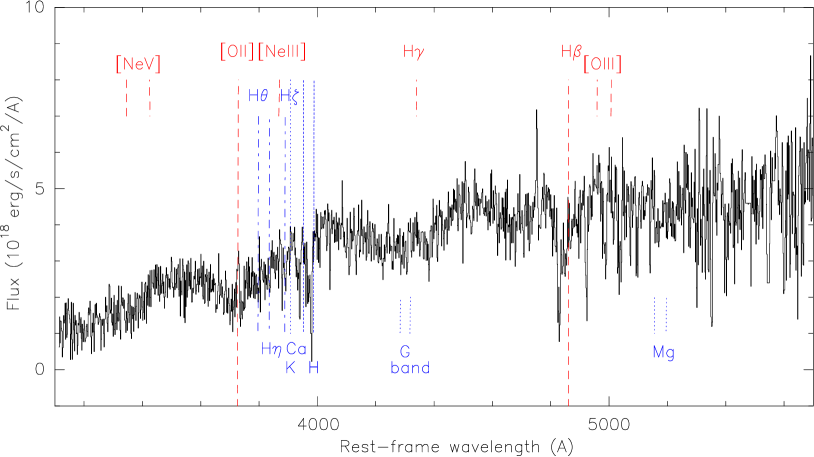
The Supernova Cosmology Project (2007, private communication) took a spectrum of the supernova close to maximum with Low Resolution Imaging Spectrometer (LRIS) on the Keck telescope on 1997 December 31, as displayed in Fig. 1. The magnitude of the supernova at discovery is , while the magnitude of the host is . This spectrum, obtained with the 1″-wide slit aligned on the galaxy centre and the SN position, is a combination of the SN () and the host galaxy () spectra (SCP, Hook 2007, private communication). The host spectrum contains stellar absorption lines and some emission lines (see Fig. 1). In Fig. 2, we focus on O II, H and O III emission lines to characterise the properties of the host. We expect that most of the galaxy flux is contained in this spectrum given the position of the slit. Moreover, most of the star-formation activity usually lies in the central part of the galaxy or at least in the galactic plane. Last, if we assume that this spectrum continuum contains only 2/3 flux from the host and scale the spectral continuum to match the observed broad band flux in the band (factor ), we should multiply the whole spectrum by a factor 2/3. In the following, we estimate that the extra 10 per cent lies within the uncertainties of this procedure and work directly on the spectrum displayed in Fig. 1. We find W, W and W. Relying on Kewley, Geller Jansen (2004), this indicates a moderate on-going star-formation activity of 0.2 M⊙ yr-1 (with no extinction correction) and a solar metallicity. The other Balmer lines are not detected in emission (but possibly in absorption), which might suggest some extinction. In parallel, the Ca II H and K absorption lines are clearly detected and the ratio of Ca II H and H to Ca II K is larger than unity, typical for stars with spectral type later than F (Rose, 1985). This host contains a significant population of stars older than Gyr (e.g. Delgado et al., 2005).
We derived the rest-frame B luminosity from the R magnitude of the host , where is defined with the Schechter function ( in Marzke et al., 1998). Unfortunately, this supernova was not monitored after detection, so no light curve is available. The supernova type and phase were determined by fitting the spectrum with SN and galaxy spectral templates, as described in Howell et al. (2005). The best matches were all SNe Ia with a mean epoch of +2 days and a scatter of 6 days. SN1997ey is located 2.77 ″ from the centre of the host galaxy, which corresponds to a projected distance of 18 kpc (see fig. 1 of Farrah et al., 2004). Only 2 out of a sample of 15 host galaxies studied by Farrah et al. (2002) are detected at an offset larger than 15 kpc and both occurred in E/S0 host galaxies.
GRB971221 has been detected at RA 73.7 and DEC 4.7, with an error box (BATSE) of 6.3. The association of SN1997ey and GRB971221, suggested by Bosnjak et al. (2006), relies on this inaccurate position but also on the time coincidence of the 2 events. As discussed in section A, this association is most probably a chance alignment.
2.2 Imaging
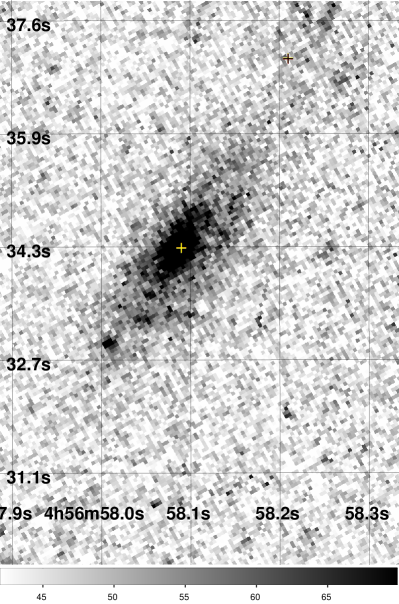
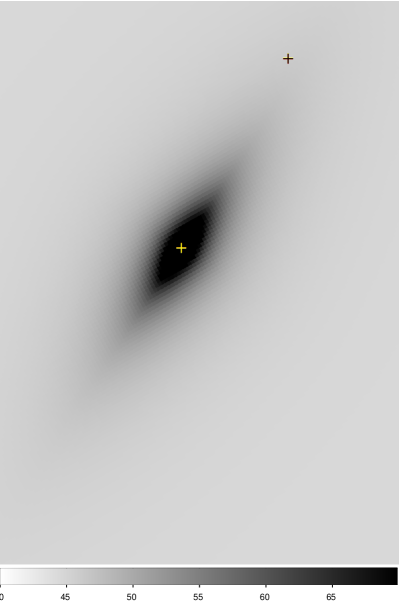
We retrieve from the HST archive the STIS image obtained by R. Ellis in 1999 (Proposal, 4647). We reduce the three available exposures with IRAF and used the drizzle procedure to remove the cosmic rays (Fruchter & Hook, 2002). In order to better understand the nature of this host, we try to fit different profiles to the STIS/HST image using the software package GALFIT (Peng et al., 2002). The best fit was obtained for one Sérsic profile with an effective (half-light) radius kpc, a power-law index , a diskiness parameter and an axis ratio . We thus estimate an inclination of order 70 (Paturel et al., 1997). The 10-20 per cent residuals are asymmetric along the major axis. This disc structure suggests an inclined Sc spiral galaxy. There are several galaxies () in the field of view ( per ) of this image, so this host might be member of a group or a cluster.
2.3 Optical-to-radio continuum spectrum
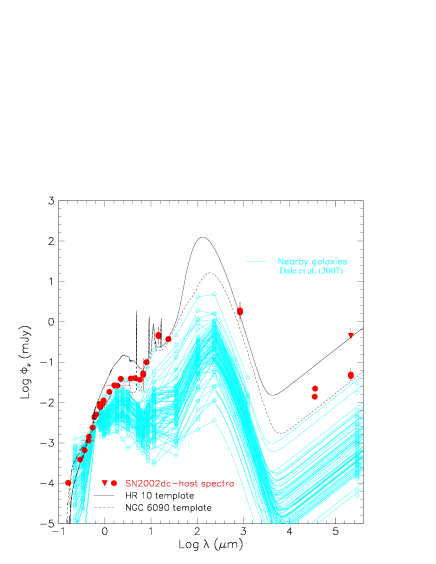
We derive the continuum spectrum from data archives (see Table 1) as displayed in Fig. 4. We retrieve data points in the optical and in submillimetre wavelengths as follows: (1) In the optical, one point was obtained from the SCP measurement and the other was derived from a compilation of 3 ’unfiltered’ images ( with FWHM) from the HST/STIS archive. They are both consistent. (2) In the submillimetre range, we use the and SCUBA detection (Farrah et al., 2004) at 850 m and 450m. We then derive upper limits from the released all-sky surveys, which observed this position, namely GALEX at 150 nm and 227.5 nm, 2MASS in , and (Skrutskie et al., 2006), IRAS (10, 25, 60 and 100 m) and NVSS (NRAO VLA Sky Survey) at 1.4 GHz (Condon et al., 1998).
We then compare this continuum spectrum with various templates. First, we superimpose the measurements of the nearby galaxy sample of Dale et al. (2007), that we normalise to mJy at and shift to the appropriate redshift. Second, we add starburst templates obtained by Melchior et al. (2001) by fits to HR10 (Dey et al., 1999) and NGC6090 (Calzetti et al., 2000), respectively blue and redshifted to .
| upper limits | Archives | |||
|---|---|---|---|---|
| (m) | (mJy) | (mJy) | (mJy) | |
| 0.15 | 8.9 | GALEX | ||
| 0.23 | 8.9 | GALEX | ||
| 0.59 | 5.5 | HST/STIS | ||
| 0.69 | 6.0 | SCP | ||
| 1.2 | 0.44 | 2MASS | ||
| 1.7 | 0.65 | 2MASS | ||
| 2.2 | 0.79 | 2MASS | ||
| 12 | 60. | IRAS | ||
| 25 | 71. | IRAS | ||
| 60 | 331. | IRAS | ||
| 100 | 302. | IRAS | ||
| 450 | 20.80 | 3.54 | SCUBA (*) | |
| 850 | 7.80 | 1.10 | SCUBA (*) | |
| 214 | 0.45 | NVSS |
(*) Farrah et al. (2004)
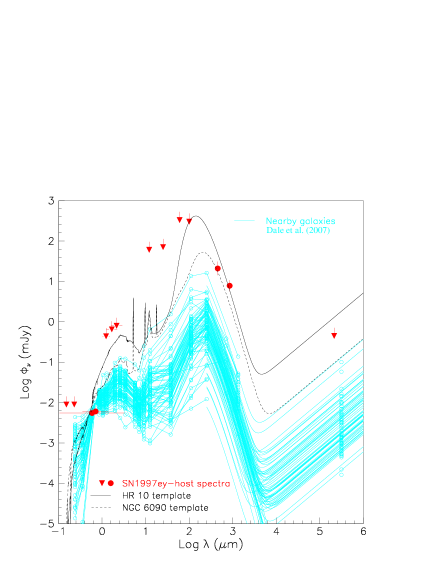
The templates correspond to for NGC6090 and for HR10, corresponding to star-formation rates (SFR) of 32 M⊙ yr-1 and 373 M⊙ yr-1 (Kewley et al., 2002).
This submillimetre-bright galaxy with a secure spectroscopic redshift () is a good candidate to search for CO. As shown by Greve et al. (2005, see their fig. 3 ), optical spectroscopic redshifts are usually in good agreement with the CO-determined redshift within 75 km s-1. While few CO investigations are conducted so far in this redshift range (Greve et al., 2005) due to the lack of CO lines in the 3 mm window, we searched for CO(2-1) and CO(3-2) lines in this galaxy thanks to the 2-mm and 1-mm receivers available at the IRAM-30m telescope.
3 CO observations and reduction of the data
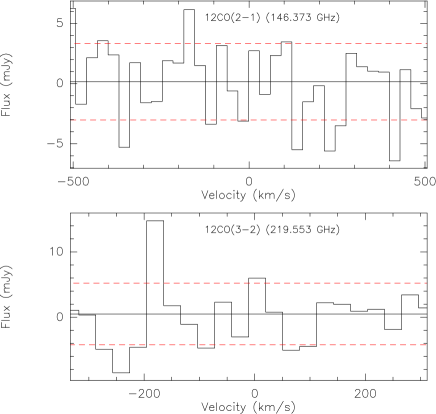
We observed at IRAM-30m in May 2004 the CO(2-1) line at 146.373 GHz and the CO(3-2) line at 219.55 GHz, relying on the spectroscopic redshift () of the host. At these frequencies, the telescope’s half-power beam widths are respectively 17 ″and 11 ″. We integrated 19.53 h on this source, with typical system temperatures of 180 K and 260 K (on the T scale). Wobbler-switching mode was used, with reference positions offset by 130″ in azimuth. For each line, 1-MHz filter bank was used with a bandwidth of 512 MHz and channel spacing 1 MHz and the VESPA backend with a bandwidth of 640 MHz and channel spacing 1.25 MHz.
The reduction was performed with the IRAM GILDAS software111http://www.iram.fr/IRAMFR/GILDAS. For each line, the spectra were added and an horizontal baseline was fitted and subtracted. This simple procedure ensures to avoid possible artifact due to bad baseline subtraction. The flat resulting spectra, displayed in Fig. 5, confirm the good conditions of observation but also the absence of signal. We then resample the channels in order to reach 30.7 km s-1 per channel at 146.373 GHz and 219.55 GHz. Last, we calibrate the spectra using the standard factors: 6.7 and 8.7 mJy/K. As displayed in Fig. 5, we do not detect any CO lines at the and mJy (rms) levels respectively.
Given the secure spectroscopic optical redshift and the large bandwidth at 2 mm, we do not expect a large velocity shift, which could explain this missing CO emission. Very few galaxies (usually at ) present a CO-line width larger than 1000 km s-1. We would have detected a non-flat baseline at 2 mm given our reduction procedure.
Following e.g. Solomon & Vanden Bout (2005), we then compute various upper limits with different CO-line width assumptions as displayed in Table 2: (1) the velocity integrated flux in Jy km s-1; (2) the CO-line luminosity expressed in K km s-1 pc2, computed as:
| (1) |
where SCO is the CO flux in Jy, is the (expected) line width in km s-1, is the rest frequency of the line in GHz, and the luminosity distance in Mpc; (3) the H2 mass M() assuming a Milky Way mass-to-CO luminosity ratio M⊙/(K km s-1 pc2); (4) the infrared luminosity222Please note that we follow the convention of Kewley et al. (2002) for the definition of the infrared luminosity. (), expressed in L⊙, relying on the relation for isolated and weakly interacting galaxies from Solomon & Sage (1988):
| (2) |
(5) the SFR in M⊙ yr-1 based on Kewley et al. (2002) empirical relationship:
| (3) |
We assume that the (expected) CO flux () is increasing as for the first CO lines, for a given H2 mass, as derived for starbursts by Combes, Maoli Omont (1999). The ratios and are thus taken to be equal to 1. This assumes that the lines are thermalized at high temperature and optically thick. This might not be the case for our host galaxy, in which case if one relies on studies of nearby galaxies our upper values should be multiplied by a factor of order 1.1 (Braine & Combes, 1992) and 1.6 (Devereux et al., 1994).
| Line width (km s-1) | ||||
|---|---|---|---|---|
| Lines | ||||
| Upper limits on (Jy km s-1) | ||||
| CO(2-1) | ||||
| CO(3-2) | ||||
| Upper limits on ( K km s-1 pc2) | ||||
| CO(2-1) | ||||
| CO(3-2) | ||||
| Upper limits on ( M⊙) | ||||
| CO(2-1) | ||||
| CO(3-2) | ||||
| Upper limits on ( L⊙) | ||||
| CO(2-1) | ||||
| CO(3-2) | ||||
| Upper limits on the SFR (M⊙ yr-1) | ||||
| CO(2-1) | ||||
| CO(3-2) | ||||

Fig. 6 displays the upper limits derived from our observations on , compared to previous detections of submillimetre galaxies detected in CO (Greve et al., 2005; Yao et al., 2003; Solomon et al., 1997; Sanders et al., 1991). We also add for comparison the upper limits obtained by Endo et al. (2007) and Le Floc’h et al. (in prep.) for long GRB hosts. We assumed for all GRB hosts upper limits based on km s-1. This figure shows that our measurements are competitive with the current state of the art.
4 Discussion
On the basis of the optical spectrum (SFR(O II M⊙ yr-1), the luminosity ( ) and the CO lines upper limits, we can securely exclude that this host galaxy is a strong starburst galaxy. We can derive a star-formation rate per unit luminosity of 0.3 M⊙ yr. The SFR and the specific SFR333If one assumes for a Sc morphological type (Roberts & Haynes, 1994), we can estimate a specific SFR of 0.2M⊙ yr-1 . are obviously low with respect to the global distribution of galaxies (see Figures 17, 18 and 19 in Elbaz et al., 2007) and to the typical submillimetre galaxies (with a median SFR of 780 M⊙ yr-1 in Greve et al., 2005).
The submillimetre flux is difficult to understand. It has been obtained by Farrah et al. (2004) on 2002 December 08, five years after SN1997ey. The comparison with templates (see Fig. 4) and the CO lines upper limits suggest that the SFR could be of order 30 M⊙ yr-1. A factor of order 150 (extinction in B) would then be required to explain the O II luminosity. This submillimeter flux requires a heating source as the sole interstellar radiation field of the host galaxy cannot heat the dust up to temperatures close to 20 K (Bethell et al., 2004). However, nothing suggests an AGN component in the optical spectrum nor in the ROSAT All-Sky Survey (RASS), while the 1.4 GHz upper limit is compatible with a quiescent or moderate starburst galaxy. Alternatively, Clements et al. (2005) discussed that this strong submillimetre flux could correspond to cirrus, which could explain the absence of starburst, and derived a (cold-) dust mass of 1.3 M⊙ (T K). This is nevertheless quite far-fetched as this would correspond to a very large mass of gas: 2 M⊙, assuming a canonical Galactic (cold)dust-to-gas mass ratios of 1/150, and excluded given our non-detection of the CO(2-1) line and the excitation temperature of CO(2-1) (T K).
We thus consider two possible explanations: (1) The heating source of the large gas mass is hidden in the nucleus and escapes detection. This would require to explain the discrepancy between the [OII] emission line and the submillimetre continuum flux. (2) This host is member of a cluster and is an anemic or passive spiral galaxy (Goto et al., 2003). In this case, one can wonder given the absence of cross-identification in radio if this submillimetre flux might not be associated with a background galaxy rather than with SN1997ey host. If one considers the 8 beam (FWHP) of SCUBA at 450m and integrates up to a Schechter function (with , Mpc-3, M, Marzke et al., 1998) with a uniform galaxy distribution, one expects , and galaxies respectively up to , and . In addition, this should be considered as upper limits as we can observe an over-density in the HST/STIS image. It is thus possible that the submillimetre source is not associated to SN1997ey host but to a background object.
One can mention the case of the host galaxy of SN2002dc, which has been detected at in the GOODS/ Hubble Deep Field-North field (Magee et al., 2002; Blakeslee et al., 2003). Pope et al. (2006) has shown that the submillimetre source HDF850.4 (Wang et al., 2004; Pope et al., 2005) is well associated with the HDF galaxy 2-264.1 (Williams et al., 1996; Cohen et al., 1996), which also has near-infrared, mid-infrared and radio counter-parts. This supernova belongs to the SNIa sample observed with Spitzer by Chary et al. (2005) and is peculiar in the sense that it has the sole host detected in the submillimetre. This supernova lies at 0.84″ from the centre of the spiral galaxy, which corresponds to a projected distance of 4.9 kpc. Even though this host is in a starburst phase, it is most probable that the SN exploded in the outskirts of the starburst zone. Various values of its SFR have been estimated in the literature and tend to converge towards 25 M⊙ yr-1 (Chary et al., 2005; Pope et al., 2006), while it is a relatively small mass system with . It does not display clear Ca II H and K absorption lines, but exhibits strong O II and H emission lines444See the spectrum in the Hawaii HDF active catalogue http://www.ifa.hawaii.edu/cowie/tts/hdf17.html. It is thus a starbursting galaxy, with a star-formation rate per unit luminosity of 84 M⊙ yr. For this galaxy, all the observational facts point towards a moderate starburst of 25 M⊙ yr-1 and 0.3 .
5 Conclusions
We discussed the properties of SN1997ey host. This SNIa occurred in a late-type system (0.7 ). According to the optical data, this disc galaxy exhibits a residual star-formation activity but no obvious sign of AGN activity. In parallel, a 6 and 7 submillimetre flux is detected at 450 and 850 m but no heating source explaining this strong continuum submillimetre flux is detected. We search for CO lines at in this initially promising galaxy but we have been only able to derive upper limits. We suggest that either the AGN/starburst activity is hidden by dust in the nucleus or this host galaxy is anemic or passive and this strong submillimetre source associated with a background galaxy.
Acknowledgments
We thank the referee for her/his detailed comments, which improved the paper, and F. Daigne for his helpful advices. We are most grateful to C. Pennypacker, who encourages us to study SN hosts. We thank the Supernova Cosmology Project (SCP) for providing the optical spectrum displayed in Fig. 1, and specially A. Spadafora who took the time to get 1997 data from SCP archives, I. Hook and C. Lidman, for providing insight information about this spectrum. We thank R. Pain for his contribution at an earlier stage of this project. We thank L. Mankiewicz for providing us an early access to the database ’Pi of the sky’. We thank the IRAM staff and the 30-m telescope operators for their assistance with the remote observations performed for this source. This research has made use of the NASA/IPAC Extragalactic Database (NED) which is operated by the Jet Propulsion Laboratory, California Institute of Technology, under contract with the National Aeronautics and Space Administration. Some of the data presented in this paper were obtained from the Multimission Archive at the Space Telescope Science Institute (MAST). STScI is operated by the Association of Universities for Research in Astronomy, Inc., under NASA contract NAS5-26555. Support for MAST for non-HST data is provided by the NASA Office of Space Science via grant NAG5-7584 and by other grants and contracts. This research has made use of the NASA/ IPAC Infrared Science Archive, which is operated by the Jet Propulsion Laboratory, California Institute of Technology, under contract with the National Aeronautics and Space Administration. This publication makes use of data products from the Two Micron All Sky Survey, which is a joint project of the University of Massachusetts and the Infrared Processing and Analysis Centre/California Institute of Technology, funded by the National Aeronautics and Space Administration and the National Science Foundation.
References
- Astier et al. (2006) Astier P. et al. 2006, AA, 447, 31
- Bethell et al. (2004) Bethell T. J., Zweibel E. G., Heitsch F., Mathis J. S. 2004, ApJ, 610, 801
- Blakeslee et al. (2003) Blakeslee J. P. et al. 2003, ApJ, 589, 693
- Bosnjak et al. (2006) Bosnjak Z., Celotti A., Ghirlanda G., Della Valle M., Pian E. 2006, AA, 447, 121
- Braine & Combes (1992) Braine J., Combes F. 1992, AA, 264, 433
- Calzetti et al. (2000) Calzetti D., Armus L., Bohlin R. C., Kinney A. L., Koornneef J., Storchi-Bergmann T. 2000, ApJ, 533, 682
- Capak et al. (2004) Capak P. et al. 2004, AJ, 127, 180
- Chary et al. (2005) Chary R., Dickinson M. E., Teplitz H. I., Pope A., Ravindranath S. 2005, ApJ, 635, 1022
- Clements et al. (2005) Clements D. L., Farrah D., Rowan-Robinson M., Afonso J., Priddey R., Fox M. 2005, MNRAS, 363, 229
- Cohen et al. (1996) Cohen J. G., Cowie L. L., Hogg D. W., Songaila A., Blandford R., Hu E. M., Shopbell P. 1996, ApJ, 471, L5
- Combes et al. (1999) Combes F., Maoli R., Omont A. 1999, AA, 345, 369
- Combes (2004) Combes F. 2004, New Astronomy Review, 48, 583
- Condon et al. (1998) Condon J. J., Cotton W. D., Greisen E. W., Yin Q. F., Perley R. A., Taylor G. B., Broderick J. J. 1998, AJ, 115, 1693
- Conley et al. (2006) Conley A. et al. 2006, AJ, 132, 1707
- Dale et al. (2007) Dale D. A. et al. 2007, ApJ, 655, 863
- Delgado et al. (2005) Delgado R. M. G., Cerviño M., Martins L. P., Leitherer C., Hauschildt P. H. 2005, MNRAS, 357, 945
- Devereux et al. (1994) Devereux N., Taniguchi Y., Sanders D. B., Nakai N., Young J. S. 1994, AJ, 107, 2006
- Dey et al. (1999) Dey A., Graham J. R., Ivison R. J., Smail I., Wright G. S., Liu M. C. 1999, ApJ, 519, 610
- Elbaz et al. (2007) Elbaz D., et al., 2007, A&A, 468, 33
- Endo et al. (2007) Endo A., et al., 2007, ApJ, 659, 1431
- Farrah et al. (2002) Farrah D., Meikle W. P. S., Clements D., Rowan-Robinson M., Mattila S. 2002, MNRAS, 336, L17
- Farrah et al. (2004) Farrah D., Fox M., Rowan-Robinson M., Clements D., Afonso J. 2004, ApJ, 603, 489
- Fernández-Soto et al. (1999) Fernández-Soto A., Lanzetta K. M., Yahil A. 1999, ApJ, 513, 34
- Fruchter & Hook (2002) Fruchter A. S., Hook R. N. 2002, PASP, 114, 144
- Goldschmidt et al. (1997) Goldschmidt P. et al. 1997, MNRAS, 289, 465
- Greve et al. (2005) Greve T. R. et al. 2005, MNRAS, 359, 1165
- Hamuy et al. (2003) Hamuy M. et al. 2003, Nat., 424, 651
- Howell et al. (2005) Howell, D. A. et al. 2005, ApJ, 634, 1190
- Howell et al. (2007) Howell D. A., Sullivan M., Conley A., Carlberg R. 2007, ApJ submitted; preprint (astro-ph/0701912)
- Iben & Tutukov (1984) Iben I., Jr., Tutukov A. V., 1984, ApJS, 54, 335
- Ivanova et al. (2006) Ivanova N., Heinke C. O., Rasio F. A., Taam R. E., Belczynski K., Fregeau J. 2006, MNRAS, 372, 1043
- Kewley et al. (2002) Kewley L. J., Geller M. J., Jansen R. A., Dopita M. A. 2002, AJ, 124, 3135
- Kewley et al. (2004) Kewley L. J., Geller M. J., Jansen R. A. 2004, AJ, 127, 2002
- King, Pringle, & Wickramasinghe (2001) King A. R., Pringle J. E., Wickramasinghe D. T., 2001, MNRAS, 320, L45
- Levan et al. (2006) Levan A. J., Wynn G. A., Chapman R., Davies M. B., King A. R., Priddey R. S., Tanvir N. R. 2006, MNRAS, 368, L1
- Levan et al. (2007) Levan, A. J., et al. 2007, ArXiv e-prints, 705, arXiv:0705.1705, MNRAS accepted
- McQuade, Calzetti Kinney (1995) McQuade K., Calzetti D., Kinney A. L. 1995, ApJS, 97, 331
- Magee et al. (2002) Magee D. et al. 2002, IAU Circ. 7908, 1
- Mannucci et al. (2006) Mannucci F., Della Valle M., Panagia N. 2006, MNRAS, 370, 773
- Marzke et al. (1998) Marzke R. O., da Costa L. N., Pellegrini P. S., Willmer C. N. A., Geller M. J. 1998, ApJ, 503, 617
- Melchior et al. (2001) Melchior A.-L., Combes F., Guiderdoni B., Hatton S. 2001, ESA SP-460: The Promise of the Herschel Space Observatory, 467; preprint (astro-ph/0102086)
- Narayan, Paczynski, & Piran (1992) Narayan R., Paczynski B., Piran T., 1992, ApJ, 395, L83
- Nelemans et al. (2001) Nelemans G., Yungelson L. R., Portegies Zwart S. F., Verbunt F., 2001, A&A, 365, 491
- Nugent et al. (1998) Nugent P., Aldering G., Castro P., Nunes N., Quimby R. 1998, IAU Circ., 6804, 1
- Osterbrock et al. (1996) Osterbrock D. E., Fulbright J. P., Martel A. R., Keane M. J., Trager S. C., Basri G., 1996, PASP, 108, 277
- Paczynski (1991) Paczynski B., 1991, AcA, 41, 257
- Pain et al. (2002) Pain R. et al. 2002, ApJ, 577, 120
- Panagia et al. (2006) Panagia N., Van Dyk S. D., Weiler K. W., Sramek R. A., Stockdale C. J., Murata K. P. 2006, ApJ, 646, 369
- Paturel et al. (1997) Paturel G. et al. 1997, A&AS, 124, 109
- Peng et al. (2002) Peng C. Y., Ho L. C., Impey C. D., Rix H.-W., 2002, AJ, 124, 266
- Perlmutter et al. (1997) Perlmutter S. et al. 1997, ApJ, 483, 565
- Perlmutter et al. (1999) Perlmutter S. et al. 1999, ApJ, 517, 565
- Phillips (1993) Phillips M. M. 1993, ApJ, 413, L105
- Pope et al. (2005) Pope A., Borys C., Scott D., Conselice C., Dickinson M., Mobasher B. 2005, MNRAS, 358, 149
- Pope et al. (2006) Pope A. et al. 2006, MNRAS, 370, 1185
- Richards (2000) Richards E. A. 2000, ApJ, 533, 611
- Riess et al. (1996) Riess A. G., Press W. H., Kirshner R. P. 1996, ApJ, 473, 88
- Riess et al. (1998) Riess A. G. et al. 1998, AJ, 116, 1009
- Roberts & Haynes (1994) Roberts, M. S., & Haynes, M. P. 1994, ARAA, 32, 115
- Rose (1985) Rose J. A. 1985, AJ, 90, 1927
- Sadat et al. (1998) Sadat R., Blanchard A., Guiderdoni B., Silk J. 1998, AA, 331, L69
- Saio & Nomoto (2004) Saio H., Nomoto K., 2004, ApJ, 615, 444
- Sanders et al. (1991) Sanders D. B., Scoville N. Z., Soifer B. T. 1991, ApJ, 370, 158
- Schwope et al. (2000) Schwope A., et al., 2000, AN, 321, 1
- Skrutskie et al. (2006) Skrutskie M. F. et al. 2006, AJ, 131, 1163
- Solomon & Sage (1988) Solomon P. M., Sage L. J. 1988, ApJ, 334, 613
- Solomon & Vanden Bout (2005) Solomon P. M., Vanden Bout P. A. 2005, ARAA, 43, 677
- Solomon et al. (1997) Solomon P. M., Downes D., Radford S. J. E., Barrett J. W. 1997, ApJ, 478, 144
- Goto et al. (2003) Goto T. et al. 2003, PASJ, 55, 757
- Spergel et al. (2007) Spergel D. N., et al., 2007, ApJS, 170, 377
- Sullivan et al. (2003) Sullivan M. et al. 2003, MNRAS, 340, 1057
- Sullivan et al. (2006) Sullivan M. et al. 2006, ApJ, 648, 868
- Teplitz et al. (2006) Teplitz H. I. et al. 2006, AJ, 132, 853
- Wang et al. (2004) Wang W.-H., Cowie L. L., Barger A. J. 2004, ApJ, 613, 655
- Williams et al. (1996) Williams R. E. et al. 1996, AJ, 112, 1335
- Yao et al. (2003) Yao L., Seaquist E. R., Kuno N., Dunne L. 2003, ApJ, 588, 771
- Webbink (1984) Webbink R. F., 1984, ApJ, 277, 355
Appendix A Probability of association with GRB971221
Bosnjak et al. (2006) performed a statistical analysis to determine the association rate of GRB and SN. They consider both short and long duration bursts as well as core-collapse and type-Ia supernovae. Surprisingly, the short burst GRB971221 has thus been associated with SN1997ey. The burst was detected 1997 December 21, while the supernova was discovered on December 29 (expected to be the maximum of the light curve 6 days). As the maximum of SN-Ia light curves is expected days after the explosion (Conley et al., 2006), the association is plausible. However, the error box of 6.3 degree affecting GRB050709 position is so large that the probability of a chance alignment is huge. If one integrates up to a Schechter function (with , Mpc-3, M, Marzke et al., 1998) with a uniform galaxy distribution, one expects (resp. ) galaxies up to (resp. ) with mB between 18 and 22 (resp. 24) in the GRB error box. Given the SNIa rate published by Sullivan et al. (2006) and assuming an average stellar mass of the galaxies of M⊙, SNIa are expected per year and per galaxy. Given the number of galaxies present in the GRB error box and assuming a temporal window of 14 days, one can expect about 140 (resp. 2000) SNIa, while 0.007 short GRB would be expected. We thus consider the association as highly improbable.
Only a few short GRB (Levan et al., 2007, and references therein) were intensively monitored to exclude definitively some association with SN. From a theoretical point of view, short GRB are usually thought to be generated by the merger of two neutrons stars or one neutron star with a black hole (e.g. Paczynski, 1991; Narayan, Paczynski, & Piran, 1992), so no association with SNIa is expected. However, King, Pringle, & Wickramasinghe (2001) suggested that the merger of two white dwarves could lead to the formation of a magnetar, which could produce short GRB as studied by Levan et al. (2006). Interestingly, coalescing white dwarf binary is one of the channel considered for the production of SNIa (Iben & Tutukov, 1984; Webbink, 1984; King, Pringle, & Wickramasinghe, 2001; Ivanova et al., 2006), compatible with observations of the population of double white dwarfs in the Galaxy (Nelemans et al., 2001). The result of this coalescence depends on the locus of the carbon ignition, and Saio & Nomoto (2004) argue that it probably occurs in the envelope preventing the explosion of a SNIa.