J. Brodzicka
High Energy Accelerator Research Organization (KEK), Tsukuba
H. Palka
H. Niewodniczanski Institute of Nuclear Physics, Krakow
I. Adachi
High Energy Accelerator Research Organization (KEK), Tsukuba
H. Aihara
Department of Physics, University of Tokyo, Tokyo
V. Aulchenko
Budker Institute of Nuclear Physics, Novosibirsk
A. M. Bakich
University of Sydney, Sydney, New South Wales
E. Barberio
University of Melbourne, School of Physics, Victoria 3010
A. Bay
École Polytechnique Fédérale de Lausanne (EPFL), Lausanne
I. Bedny
Budker Institute of Nuclear Physics, Novosibirsk
U. Bitenc
J. Stefan Institute, Ljubljana
A. Bondar
Budker Institute of Nuclear Physics, Novosibirsk
M. Bračko
University of Maribor, Maribor
J. Stefan Institute, Ljubljana
T. E. Browder
University of Hawaii, Honolulu, Hawaii 96822
M.-C. Chang
Department of Physics, Fu Jen Catholic University, Taipei
P. Chang
Department of Physics, National Taiwan University, Taipei
A. Chen
National Central University, Chung-li
W. T. Chen
National Central University, Chung-li
B. G. Cheon
Hanyang University, Seoul
C.-C. Chiang
Department of Physics, National Taiwan University, Taipei
R. Chistov
Institute for Theoretical and Experimental Physics, Moscow
I.-S. Cho
Yonsei University, Seoul
S.-K. Choi
Gyeongsang National University, Chinju
Y. Choi
Sungkyunkwan University, Suwon
J. Dalseno
University of Melbourne, School of Physics, Victoria 3010
M. Danilov
Institute for Theoretical and Experimental Physics, Moscow
M. Dash
Virginia Polytechnic Institute and State University, Blacksburg, Virginia 24061
A. Drutskoy
University of Cincinnati, Cincinnati, Ohio 45221
S. Eidelman
Budker Institute of Nuclear Physics, Novosibirsk
N. Gabyshev
Budker Institute of Nuclear Physics, Novosibirsk
A. Go
National Central University, Chung-li
G. Gokhroo
Tata Institute of Fundamental Research, Mumbai
B. Golob
University of Ljubljana, Ljubljana
J. Stefan Institute, Ljubljana
H. Ha
Korea University, Seoul
J. Haba
High Energy Accelerator Research Organization (KEK), Tsukuba
T. Hara
Osaka University, Osaka
K. Hayasaka
Nagoya University, Nagoya
H. Hayashii
Nara Women’s University, Nara
M. Hazumi
High Energy Accelerator Research Organization (KEK), Tsukuba
D. Heffernan
Osaka University, Osaka
Y. Hoshi
Tohoku Gakuin University, Tagajo
W.-S. Hou
Department of Physics, National Taiwan University, Taipei
H. J. Hyun
Kyungpook National University, Taegu
T. Iijima
Nagoya University, Nagoya
K. Ikado
Nagoya University, Nagoya
K. Inami
Nagoya University, Nagoya
A. Ishikawa
Saga University, Saga
H. Ishino
Tokyo Institute of Technology, Tokyo
R. Itoh
High Energy Accelerator Research Organization (KEK), Tsukuba
M. Iwasaki
Department of Physics, University of Tokyo, Tokyo
Y. Iwasaki
High Energy Accelerator Research Organization (KEK), Tsukuba
N. J. Joshi
Tata Institute of Fundamental Research, Mumbai
D. H. Kah
Kyungpook National University, Taegu
J. H. Kang
Yonsei University, Seoul
H. Kawai
Chiba University, Chiba
T. Kawasaki
Niigata University, Niigata
H. Kichimi
High Energy Accelerator Research Organization (KEK), Tsukuba
H. O. Kim
Sungkyunkwan University, Suwon
S. K. Kim
Seoul National University, Seoul
Y. J. Kim
The Graduate University for Advanced Studies, Hayama
K. Kinoshita
University of Cincinnati, Cincinnati, Ohio 45221
S. Korpar
University of Maribor, Maribor
J. Stefan Institute, Ljubljana
P. Krokovny
High Energy Accelerator Research Organization (KEK), Tsukuba
R. Kumar
Panjab University, Chandigarh
C. C. Kuo
National Central University, Chung-li
Y.-J. Kwon
Yonsei University, Seoul
J. S. Lange
Justus-Liebig-Universität Gießen, Gießen
J. S. Lee
Sungkyunkwan University, Suwon
M. J. Lee
Seoul National University, Seoul
S. E. Lee
Seoul National University, Seoul
T. Lesiak
H. Niewodniczanski Institute of Nuclear Physics, Krakow
A. Limosani
University of Melbourne, School of Physics, Victoria 3010
D. Liventsev
Institute for Theoretical and Experimental Physics, Moscow
F. Mandl
Institute of High Energy Physics, Vienna
S. McOnie
University of Sydney, Sydney, New South Wales
T. Medvedeva
Institute for Theoretical and Experimental Physics, Moscow
W. Mitaroff
Institute of High Energy Physics, Vienna
K. Miyabayashi
Nara Women’s University, Nara
H. Miyake
Osaka University, Osaka
H. Miyata
Niigata University, Niigata
R. Mizuk
Institute for Theoretical and Experimental Physics, Moscow
T. Mori
Nagoya University, Nagoya
Y. Nagasaka
Hiroshima Institute of Technology, Hiroshima
E. Nakano
Osaka City University, Osaka
M. Nakao
High Energy Accelerator Research Organization (KEK), Tsukuba
Z. Natkaniec
H. Niewodniczanski Institute of Nuclear Physics, Krakow
S. Nishida
High Energy Accelerator Research Organization (KEK), Tsukuba
O. Nitoh
Tokyo University of Agriculture and Technology, Tokyo
S. Noguchi
Nara Women’s University, Nara
T. Nozaki
High Energy Accelerator Research Organization (KEK), Tsukuba
S. Ogawa
Toho University, Funabashi
T. Ohshima
Nagoya University, Nagoya
S. Okuno
Kanagawa University, Yokohama
S. L. Olsen
University of Hawaii, Honolulu, Hawaii 96822
Institute of High Energy Physics, Chinese Academy of Sciences, Beijing
H. Ozaki
High Energy Accelerator Research Organization (KEK), Tsukuba
P. Pakhlov
Institute for Theoretical and Experimental Physics, Moscow
G. Pakhlova
Institute for Theoretical and Experimental Physics, Moscow
C. W. Park
Sungkyunkwan University, Suwon
H. Park
Kyungpook National University, Taegu
R. Pestotnik
J. Stefan Institute, Ljubljana
L. E. Piilonen
Virginia Polytechnic Institute and State University, Blacksburg, Virginia 24061
M. Rozanska
H. Niewodniczanski Institute of Nuclear Physics, Krakow
Y. Sakai
High Energy Accelerator Research Organization (KEK), Tsukuba
O. Schneider
École Polytechnique Fédérale de Lausanne (EPFL), Lausanne
R. Seidl
University of Illinois at Urbana-Champaign, Urbana, Illinois 61801
RIKEN BNL Research Center, Upton, New York 11973
A. Sekiya
Nara Women’s University, Nara
K. Senyo
Nagoya University, Nagoya
M. E. Sevior
University of Melbourne, School of Physics, Victoria 3010
M. Shapkin
Institute of High Energy Physics, Protvino
C. P. Shen
Institute of High Energy Physics, Chinese Academy of Sciences, Beijing
H. Shibuya
Toho University, Funabashi
J.-G. Shiu
Department of Physics, National Taiwan University, Taipei
J. B. Singh
Panjab University, Chandigarh
A. Sokolov
Institute of High Energy Physics, Protvino
A. Somov
University of Cincinnati, Cincinnati, Ohio 45221
S. Stanič
University of Nova Gorica, Nova Gorica
M. Starič
J. Stefan Institute, Ljubljana
T. Sumiyoshi
Tokyo Metropolitan University, Tokyo
F. Takasaki
High Energy Accelerator Research Organization (KEK), Tsukuba
K. Tamai
High Energy Accelerator Research Organization (KEK), Tsukuba
M. Tanaka
High Energy Accelerator Research Organization (KEK), Tsukuba
G. N. Taylor
University of Melbourne, School of Physics, Victoria 3010
Y. Teramoto
Osaka City University, Osaka
I. Tikhomirov
Institute for Theoretical and Experimental Physics, Moscow
S. Uehara
High Energy Accelerator Research Organization (KEK), Tsukuba
K. Ueno
Department of Physics, National Taiwan University, Taipei
T. Uglov
Institute for Theoretical and Experimental Physics, Moscow
Y. Unno
Hanyang University, Seoul
S. Uno
High Energy Accelerator Research Organization (KEK), Tsukuba
P. Urquijo
University of Melbourne, School of Physics, Victoria 3010
G. Varner
University of Hawaii, Honolulu, Hawaii 96822
K. Vervink
École Polytechnique Fédérale de Lausanne (EPFL), Lausanne
S. Villa
École Polytechnique Fédérale de Lausanne (EPFL), Lausanne
A. Vinokurova
Budker Institute of Nuclear Physics, Novosibirsk
C. C. Wang
Department of Physics, National Taiwan University, Taipei
C. H. Wang
National United University, Miao Li
M.-Z. Wang
Department of Physics, National Taiwan University, Taipei
P. Wang
Institute of High Energy Physics, Chinese Academy of Sciences, Beijing
X. L. Wang
Institute of High Energy Physics, Chinese Academy of Sciences, Beijing
Y. Watanabe
Kanagawa University, Yokohama
R. Wedd
University of Melbourne, School of Physics, Victoria 3010
E. Won
Korea University, Seoul
B. D. Yabsley
University of Sydney, Sydney, New South Wales
A. Yamaguchi
Tohoku University, Sendai
Y. Yamashita
Nippon Dental University, Niigata
M. Yamauchi
High Energy Accelerator Research Organization (KEK), Tsukuba
C. Z. Yuan
Institute of High Energy Physics, Chinese Academy of Sciences, Beijing
Y. Yusa
Virginia Polytechnic Institute and State University, Blacksburg, Virginia 24061
C. C. Zhang
Institute of High Energy Physics, Chinese Academy of Sciences, Beijing
Z. P. Zhang
University of Science and Technology of China, Hefei
V. Zhilich
Budker Institute of Nuclear Physics, Novosibirsk
V. Zhulanov
Budker Institute of Nuclear Physics, Novosibirsk
A. Zupanc
J. Stefan Institute, Ljubljana
N. Zwahlen
École Polytechnique Fédérale de Lausanne (EPFL), Lausanne
Abstract
We report the observation of a new meson produced in
.
This state has a mass of ,
a width
and a spin-parity.
The statistical significance of this observation is .
The results are based on an analysis of million events
collected at the resonance
with the Belle detector at the KEKB asymmetric-energy collider.
pacs:
14.40.Lb, 13.25.Hw, 13.20.Fc
††preprint:
At the level of quark diagrams, the decay
proceeds dominantly via the CKM-favored
transition. The transition amplitudes can be
categorized as due to either external -
or internal (color-suppressed) -emission diagrams.
The decay cc
can proceed through both types of diagrams;
thus it is promising for searches for new
states as well as for some
states lying above
threshold.
The unexpected discoveries of the
and mesons show that our understanding of
spectroscopy might be incomplete, while
experimental data on states with decay
channels open to are scarce.
The decays have been previously
studied with a small data sample at LEP aleph and
more recently a larger statistics exploratory study
was performed by BaBar babar .
In this letter we report the first study of the
Dalitz plot of .
The study is performed using data
collected with the Belle detector at the KEKB asymmetric-energy
(3.5 on 8 GeV) collider KEKB ,
operating at the resonance ( GeV).
The data sample corresponds to the integrated luminosity
of and contains
million pairs.
The Belle detector is a large-solid-angle magnetic
spectrometer that is described in detail elsewhere Belle .
Well measured charged tracks are identified by combining information
from time-of-flight, Cherenkov and ionisation detectors.
Requirements on the particle identification variable are imposed
that identify a charged kaon with efficiency, a charged pion with
almost efficiency and have less than
misidentification probability.
Any track that is positively identified as an electron is rejected.
Candidate decays are identified
by a displaced secondary vertex, a two-pion momentum vector that is
consistent with a originating from the IP and a
invariant mass within
of the nominal mass.
Candidate mesons are reconstructed from pairs of
identified photons, each with a minimum energy
of , that have an invariant mass within
of the mass.
mesons are reconstructed in the
, , ,
and decay modes.
We preselect candidates using a
signal window
around the nominal meson mass for all decay modes except for
, where
a signal window is used.
Mass- and vertex-constrained fits are applied to
candidates to improve their momentum resolution.
To suppress the continuum background
(, )
we require the ratio of the second to the zeroth
Fox-Wolfram moments fox-wolfram to be less than .
We form combinations using
candidates with momenta in the rest frame (cms)
kinematically allowed in .
The momenta of the secondaries from a meson candidate decay are
refitted to a common vertex with an interaction point (IP)
constraint that takes into
account the meson decay length.
The meson candidates are identified by their cms energy difference,
,
and their beam constrained mass,
,
where
is the beam energy in the cms and and are
the three-momenta and energies of the candidate’s decay products.
We select candidates with
GeV and GeV.
Exclusively reconstructed signal
events have an distribution that peaks at the nominal
meson mass; the distribution peaks at zero.
We employ a discriminator (likelihood ratio)
based on the meson signal significance
to select the unique candidate in the event, defined as:
,
where and are the signal and the background likelihoods
that depend on the candidate’s invariant mass .
This discriminator is determined from fits to the
distributions for each decay mode separately,
using a data sample enriched in
decays. In these fits and are parametrized respectively by
a double gaussian and a linear functions.
For events with multiple
candidates, the product
is calculated and the candidate with the largest
is accepted.
The discriminator is also used to suppress
combinatorial backgrounds to
and to enhance the signal purity.
Monte Carlo (MC) studies showed that this selection, which does not rely
on the and values used in the signal definition,
does not introduce biases.
The fraction of events with multiple candidates is and the average
candidate multiplicity is 2.2. The main background is due
to production, with multiple candidates originating from wrong
pairing of ’s or swapped kaons.
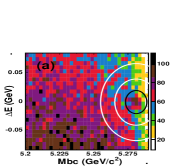
The and distributions
for the
decay candidates, selected with
requirement, are shown in Fig. 1,
where the distribution
is shown
for
(,
is the nominal meson mass) and the distribution
is shown for
().
Figure 1: vs. (a), (b) and (c)
distributions for . Black (white) ellipses
in (a) enclose the signal (sideband) regions described in the text.
From a study of the and background distributions
in large MC samples of generic and events
as well as -mass sidebands in data, we find no significant
peaking background.
To extract the signal yield,
we perform two-dimensional (2D) extended unbinned maximum-likelihood fits
to and .
The probability density functions (PDFs) for the and
signals are Gaussians.
The background PDF for is represented by
a phenomenological function argus with a phase-space-like
behaviour near the kinematic boundary; the
background is parameterized by a second-order polynomial.
The likelihood function is maximized with free parameters for the signal yield,
the Gaussian means and widths, and four parameters that describe shapes
of the background distributions.
From the fit, we obtain a signal yield of
events. The results of the fit are superimposed on
the and projections shown in
Fig. 1(b)-(c).
We determine the branching fraction from the relation:
,
where are efficiencies for the decay channels and .
is the number of analyzed pairs,
,
and is assumed.
The efficiencies are determined by MC using
a model that reproduces the observed Dalitz plot features (discussed below).
The sum in the denominator of the above relation is
.
We obtain
,
where the first error is statistical and the second is
systematic. The latter includes contributions due to
uncertainties in the efficiency determination
(tracking and particle identification efficiency, data-MC differences in
signal shapes),
the selection, the background parameterization,
the MC model used in the efficiency calculation,
the intermediate branching fractions and .
This result supersedes our previous determination chistov ,
which assumed a phase space model in the efficiency determination.
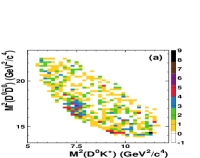
Figure 2: Dalitz plot (a) and projections for
in the signal region:
(b),
(c),
(d).
Hatched histograms represent background,
red/solid curves show the efficiency.
The main features of the data can be seen in
the Dalitz plot
vs.
for events from a signal region defined by the ellipse
,
shown in Fig. 2(a).
The three two-body invariant mass distributions are
shown in Figs. 2(b)-(d).
The hatched histograms
represent the background distributions obtained for events
from an elliptical strip surrounding the
signal region, defined by .
The background distributions are normalized to the number
of background events under the signal
peak as determined from the 2D
and fit.
The data are not efficiency corrected.
The efficiency as a function of invariant mass is shown in
Figs. 2(b)-(d) as a continuous curve.
A pronounced feature of the Dalitz plot
is the accumulation of events in the region
and
possibly due to the overlap of
a horizontal band that could be due to the ,
and a vertical band that
cannot be attributed to any known state. A horizontal band at
corresponds to production.
The distributions in Fig.2 are meant
only to illustrate the features of the data.
In the subsequent analyses a more robust procedure was used to
obtain background-subtracted mass
distributions.
We determine the vs. distributions
for events from mass bins of the Dalitz plot projection and fit
the signal and background shapes to obtain
meson signal yield vs. invariant mass.
mass bins are used for
the , while bins
are used for the other studied samples.
The parameterizations and
ranges considered in these fits
are the same as those used for the total yield extraction.
The widths and means of the Gaussians describing
the signal are fixed at the values obtained for the total signal sample, while
the signal yield and the background PDF’s parameters are free parameters.
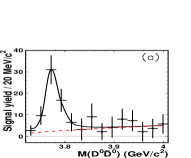
The background-subtracted in the
signal region is shown in
Fig. 3(a).
The peak is fitted for
with a Breit-Wigner (BW) plus a threshold function to describe a
phase space component. The signal yield is
events with a peak mass of ,
and a width of ,
in agreement with the PDG averages.
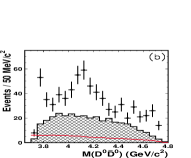
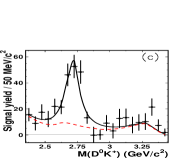
Figure 3:
meson signal yield vs.:
(a) in the region,
(b) for
(c) for .
Solid curves denote the fit results described in the text.
The red/dotted curve in (a) shows the phase-space component,
whereas in (c) the red/dotted curve is the sum of the three components:
reflection, phase-space and threshold components.
The background-subtracted spectrum
(Fig. 3(b)), for events satisfying
, where is the helicity angle
between the momentum vector
and the direction opposite the in the
rest frame, is used to estimate the possible ,
contribution to the enhancement
at .
The peak at threshold corresponds to , while the
structure
at is conservatively
assummed to be predominantly (bes_cb , barnes )
due to the .
The distribution for
is fitted with a BW with mass and width
fixed at the nominal values
(, pdg04 ),
yielding
signal events. We use these parameters
to estimate the number of events in the backward
helicity-angle hemisphere, in the region
.
Taking into account the efficiency we obtain a total of
events.
Figure 3(c) shows the
background-subtracted
distribution for events with .
This requirement removes the reflection at
high . The predicted reflection agrees
well with the data in the high mass region but
does not explain the large peak at .
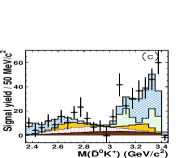
We parameterize the observed excess of events with a BW
and fit the spectrum (Fig. 3(c))
with the ansatz of a new resonance,
the reflection and a
phase-space component with shapes determined by MC simulations.
The efficiency variation is taken into account in the fit;
the free parameters are the resonance yield, mass and width,
and the phase-space component normalization.
The fit has an acceptable overall but is unable to reproduce
the events near the low-mass threshold seen in Fig. 3(c).
We used several phenomenological
parameterizations
(polynomials, a BW, an exponential) of the threshold enhancement
in the fit to determine its influence on the BW parameters
of the peak.
The exponential form
gives a good description of the mass spectrum, while adding only two
free parameters.
For the new resonance, which we henceforth denote
as the , we obtain
a signal yield of events, a mass of
and a width of
.
The threshold and the phase-space components from the
fit are and events, respectively.
The fit results are shown in
Figs. 4(a)-(c)
as histograms overlaid on the measured mass spectra.
The resonance parameters and product branching fractions
are summarized in Table 1 (the first error is statistical,
the second is systematic).
The systematic errors on the product branching fractions
and the resonance parameters
include contributions from uncertainties in the yields of
the reflection
(including the recent parameter determination bes_cb ),
the threshold parameterization,
sensitivities of parameters to the fit range and
parameterization, uncertainties in the selection,
as well as uncertainties due to interference effects that were neglected.
The systematics due to the latter are
determined from MC simulations of Dalitz plot densities
with and without interference of contributing amplitudes,
with each contributing resonance parameterized by a BW form.
The resonance parameters from Table 1
and the threshold enhancement parameters are used to
determine the amplitudes.
The effects of interference of the with other
states are found to be small
and are neglected in the simulations.
These MC samples, with maximal constructive and destructive interferences,
were analysed ignoring interference effects.
The differences between the obtained resonance parameters
and the input values are taken as systematic errors.
Table 1: Resonance parameters and product branching fractions:
and
.
()
()
()
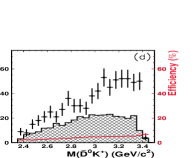
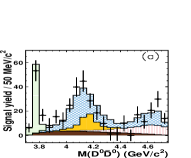
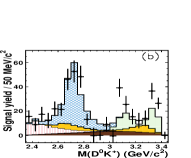
Product
Figure 4: meson signal yield vs. :
(a), (b),
and (c).
Histograms denote the contributions from:
(blue/grid),
(green/horizontally striped),
(yellow/light grey),
threshold (red/vertically striped) and
phase-space components (brown/dark grey).
Histograms are superimposed additively.
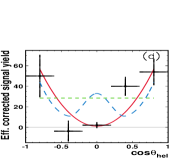
(d) Efficiency corrected helicity angle
distribution. Curves show
predictions for various spin hypotheses:
(green/dotted line),
(red/solid), (blue/dashed),
where Legendre polynomial values are averaged over the bin width.
We study background-subtracted and
helicity angle distributions
by selecting the respective invariant mass in the resonance
region and obtaining meson
signal yields in bins of
from the
2D fits to and .
Here for
is defined as before,
whereas for it is the angle between
the momentum vector and the direction opposite
the in the rest frame.
The obtained angular distributions are then corrected using
bin-by-bin efficiencies.
The expected reflections from and from the threshold
component are subtracted from the angular
distribution.
Spin hypotheses for the resonances are tested by
comparing predictions for the different hypotheses
to the corrected angular distributions.
The distribution (not shown) is well described
by the hypothesis ().
The distribution (Fig. 4(d))
favours (); the () and ()
assignments can be rejected.
The assignment and the observed decay to two pseudoscalar mesons
imply parity .
In summary, from a study of the Dalitz plot we find that the decay
proceeds dominantly via
quasi-two-body channels:
and
.
The observed rate for production in meson decays
confirms our previous observation chistov .
The is a previously unobserved
resonance in the system with a mass
,
width
and .
The statistical significance of this observation is .
Based on its observed decay channel,
we interpret the
resonance as a meson.
Potential model calculations godfrey-isgur predict a
radially excited state with a mass -.
From chiral symmetry considerations maciek a -
doublet of states has been predicted. If the state
is identified as the , the mass predicted for the state
is .
Additional measurements of the meson properties are needed to distinguish between
these two interpretations.
It is not clear whether the structure at observed
recently babar_ds2860
in the system produced in continuum could be due to the .
The recently reported state babar_ds2860 is not seen in our data.
This could indicate a high spin for this meson that suppresses its production in
decays.
We thank the KEKB group for excellent operation of the
accelerator, the KEK cryogenics group for efficient solenoid
operations, and the KEK computer group and
the NII for valuable computing and Super-SINET network
support. We acknowledge support from MEXT and JSPS (Japan);
ARC and DEST (Australia); NSFC and KIP of CAS (China);
DST (India); MOEHRD, KOSEF and KRF (Korea);
KBN (Poland); MES and RFAAE (Russia); ARRS (Slovenia); SNSF (Switzerland);
NSC and MOE (Taiwan); and DOE (USA).
References
(1)
Throughout this paper,
the inclusion of the charge conjugate mode decay is implied.
(2)
R. Barate et al. (ALEPH Collaboration),
Eur. Phys. J. C 4, 387 (1998).
(3)
B. Aubert et al. (BaBar Collaboration),
Phys. Rev. D 68, 092001 (2003).
(4)
S. Kurokawa and E. Kikutani, Nucl. Instr. and Meth. A 499, 1 (2003),
and other papers included in this volume.
(5)
A. Abashian et al. (Belle Collaboration),
Nucl. Instr. and Meth. A 479, 117 (2002).
(6)
G. C. Fox and S. Wolfram, Phys. Rev. Lett. 41, 1581 (1978).
(7)
H. Albrecht et al. (ARGUS Collaboration),
Phys. Lett. B 229, 304 (1989).
(8)
S. Eidelman et al., Phys. Lett. B 592, 1 (2004).
(9)
W.-M. Yao et al., J. Phys. G 33, 1 (2006);
M. Ablikim et al. (BES Collaboration), arXiv:0705.4500v1 [hep-ex].
(10)
T. Barnes, S. Godfrey, E. S. Swanson, Phys. Rev. D 72, 054026 (2005).
(11)
R. Chistov et al. (Belle Collaboration),
Phys. Rev. Lett. 93, 051803 (2004).
(12)
S. Godfrey and N. Isgur,
Phys. Rev. D 32, 189 (1985);
F. E. Close et al., Phys. Lett. B 647, 159 (2007).
(13)
M. A. Nowak, M. Rho and I. Zahed,
Acta Phys. Polon. B 35, 2377 (2004).
(14)
B. Aubert et al. (BaBar Collaboration),
Phys. Rev. Lett. 97, 222001 (2006).