Type IIP Supernova SN 2004et: A Multi-Wavelength Study in X-Ray, Optical and Radio
Abstract
We present X-ray, broad band optical and low frequency radio observations of the bright type IIP supernova SN 2004et. The Chandra X-ray Observatory observed the supernova at three epochs, and the optical coverage spans a period of 470 days since explosion. The X-ray emission softens with time, and we characterise the X-ray luminosity evolution as . We use the observed X-ray luminosity to estimate a mass-loss rate for the progenitor star of . The optical light curve shows a pronounced plateau lasting for about 110 days. Temporal evolution of photospheric radius and color temperature during the plateau phase is determined by making black body fits. We estimate the ejected mass of 56Ni to be 0.06 0.03 M⊙. Using the expressions of Litvinova & Nadëzhin (1985) we estimate an explosion energy of (0.98 0.25) erg. We also present a single epoch radio observation of SN 2004et. We compare this with the predictions of the model proposed by Chevalier et al. (2006). These multi-wavelength studies suggest a main sequence progenitor mass of 20 M⊙ for SN 2004et.
keywords:
supernovae: general - supernovae: individual: SN 2004et: techniques: photometric1 INTRODUCTION
Supernovae of the type II are generally associated with regions of star formation in spiral galaxies. They are believed to result from the explosion triggered by core collapse of massive stars, presumably red supergiants with main sequence mass of 1025 M⊙, having a thick hydrogen envelope. Spectra of type II supernovae show the evidence of hydrogen near maximum light. A further differentiation is proposed for SN II based on the shape of light curve. Those which have a pronounced plateau and remain within 1 mag of maximum brightness for an extended period are termed as type IIP (plateau) while those showing a linear decline in magnitude from the peak are termed as type IIL (linear).
The plateau duration is usually between 60100 days which is followed by an exponential tail at later epochs. The plateau phase corresponds to a period of nearly constant luminosity due to the hydrogen recombination wave receding through the envelope and it slowly releases the energy which was deposited by the shock and radioactive decay. Over the years enormous progress has been made in the study of supernovae. But the detailed photometric and spectroscopic data especially for SN IIP are still rare. Also the direct determination of the progenitors has been possible due to the availability of many ground and space based archival images. A well studied sample of SN IIP and their observational properties during the plateau phase will give valuable information about the range of progenitor masses, the explosion energy, the ejected mass and the amount of ejected 56Ni.
In this paper, we report the Chandra X-ray observations, detailed optical observations and radio detection (at 1.4 GHz) of a type IIP supernova SN 2004et which occurred in the spiral star burst galaxy NGC 6946 which is located at a distance of 5.5 Mpc. Due to its proximity (z = 0.00016,) was a very promising candidate to study the overall evolution at different wavelengths. It was the second brightest supernova (unfiltered mag 12.8) detected in the year 2004, the brightest being a type IIP SN 2004dj (unfiltered mag 11.2) in NGC 2403. The X-ray, optical photometric and radio observations of SN 2004et will make it one of the best studied type IIP supernova in the present era. Supplementing this is the progenitor identification of SN 2004et by Li et al. (2005) using the pre-supernova images of NGC 6946 with the CFHT.
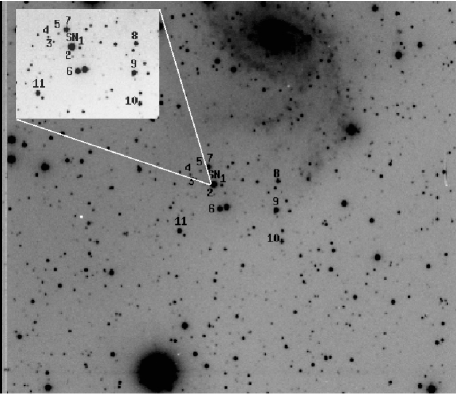
SN 2004et was discovered on September 27, 2004 by S. Moretti (Zwitter et al. 2004) with a 0.4 m telescope. The location of the supernova, R. A. 20h 35m 25s.33 and Decl. +60∘ 07′ 17.′′3 (J2000.0) was 247.′′1 east and 115.′′4 south of the nucleus of the galaxy NGC 6946. A high resolution spectroscopy obtained with the 1.82 m Asiago telescope on September 28 confirmed it as a type II event and the equivalent width of Na I D II lines implied a total reddening of E(B-V) = 0.41 mag. Further observations were carried out by Li and Filippenko (2004) with the 0.76 m Katzman Automated Imaging Telescope (KAIT).
The TAROT robotic telescope which imaged NGC 6946 frequently found no optical source at the SN location on September 22.017. Based on these TAROT measurements Li et al. (2005) constrain the explosion date for SN 2004et as September 22.0 (JD 2453270.5) which we have adopted as the explosion epoch in this paper.
Li and Filippenko (2004) report that the progenitor of SN 2004et was seen as a faint, extended source on NGC 6946 images taken with 0.9 m Kitt Peak telescope on May 30, 1989 and the high quality images taken with 3.6 m CFHT on August 6, 2002 show the presence of a possible progenitor within 0.′′3 of the SN 2004et position. The estimated luminosity for these is consistent with a massive supergiant but it is too bright and too blue for a single red supergiant. Li et al. (2005) present a detailed analysis of the progenitor of supernova SN 2004et and conclude that the progenitor was a yellow supergiant (15 M⊙) which might have experienced a red supergiant stage before explosion. They also mention the possibility of the progenitor being an interacting system of a red and a blue supergiant similar to the progenitor of supernova SN 1993J. SN 2004et progenitor is the seventh one which is directly identified.
SN 2004et was also detected at radio wavelengths (22.4 GHz and 8.4 GHz) by Stockdale et al. (2004) using the VLA on October 5.128 UT. No radio emission was detected on September 30.18 UT. The radio position is in close agreement with the optical position. Beswick et al. (2004) report the radio observations at 4.9 GHz using a subset of the MERLIN array. NGC 6946 has been the galaxy most prolific at producing supernovae discoveries, hosting a total of 8 objects (SN 1917A, SN 1939C, SN 1948B, SN 1968D, SN 1969P, SN 1980K, SN 2002hh and SN 2004et). Four of these have been detected at radio wavelengths (SN 1968D, SN 1980K, SN 2002hh and SN 2004et). SN 2004et was detected at X-ray wavelengths and was observed by X-ray satellite.
We have carried out the multicolor optical photometric observations of SN 2004et from 14 to 470 days after the explosion. Radio observations of SN 2004et were carried out at a single epoch at 1.4 GHz. Section 2 briefly discusses the X-ray, optical and radio observations. Development of X-ray light curve and spectrum, optical photometric evolution and interpretation of the radio observation are discussed in the sections 3, 4 and 7 respectively. Comparison of SN 2004et with other type IIP supernovae forms section 5, X-ray emission is discussed in section 6 whereas the conclusions form section 8 of the paper.
2 OBSERVATIONS AND DATA REDUCTION
2.1 X-ray observations and Chandra Data Reduction
SN 2004et was observed with Chandra on three occasions — 30, 45, and 72 days since explosion — for 30 ks each, as part of a program to explore the X-ray properties of core-collapse SNe (PI: Lewin); details of the observations can be found in Table 3. An initial report of the observations was made by Rho et al. (2007). All data were taken with the Advanced CCD Imaging Spectrometer (ACIS) with an integration time of 3.2 s per frame. The telescope aimpoint was on the back-side illuminated S3 chip, and the data were telemetered to the ground in “faint” mode.
Data reduction was performed using the CIAO 3.3 software provided by the Chandra X-ray Center111http://asc.harvard.edu. The data were reprocessed using the CALDB 3.2.2 set of calibration files (gain maps, quantum efficiency, quantum efficiency uniformity, effective area) including a new bad pixel list made with the acis_run_hotpix tool. The reprocessing was done without including the pixel randomization that is added during standard processing. This omission slightly improves the point spread function. The data were filtered using the standard ASCA grades (0, 2, 3, 4, and 6) and excluding both bad pixels and software-flagged cosmic ray events. This is the standard grade filtering for ACIS imaging observations recommended by the ChandraX-ray Center; this filtering optimises the signal-to-background ratio. Intervals of strong background flaring were searched for, but none were found.
2.2 Optical Observations and Data Analysis
We have carried out the broad band UBVRcIc optical photometric observations of SN 2004et at 29 epochs during October 06, 2004 to January 01, 2005. Further observations were precluded due to its proximity to the Sun. The observations were continued again in October 2005. We could observe SN 2004et at 24 epochs during October 13, 2005 to January 05, 2006. We present, here, an extended coverage of SN 2004et at 53 epochs spanning over 470 days since the explosion on September 22, 2004. All the observations were carried out using a 2048 2048 CCD camera mounted at the f/13 Cassegrain focus of the 1.04-m Sampurnanand Telescope (ST) at Aryabhatta Research Institute of Observational Sciences (ARIES), Nainital. One pixel of the CCD chip corresponds to a square of 0″.38 side, and the entire chip covers a field of 13′ 13′on the sky. The gain and read out noise of the CCD camera are 10 electrons per analogue-to-digital unit (ADU) and 5.3 electrons respectively.
We observed the Landolt (1992) standard PG 0231+051 field and the supernova in UBVRcIc filters on November 14, 2004 for photometric calibration during good photometric sky conditions. Several bias and twilight flat frames were observed with the CCD camera to calibrate the images using standard techniques. The bias subtracted, flat fielded and cosmic ray removed images were used for further analysis.
Image processing was done using softwares IRAF, MIDAS and DAOPHOT-II. The values of the atmospheric
extinction on the night of 14/15 November 2004 determined from the observations of PG 0231+051
bright stars are 0.53, 0.24, 0.14, 0.10 and 0.07 mag in U, B, V, Rc and Ic filters
respectively. The 6 standard stars in the PG 0231+051 field cover a range of -0.329 1.448
in color and of 12.770 16.110 in brightness. This gives the following transformation coefficients
=
=
=
=
=
where are standard magnitudes and represent the instrumental magnitudes normalized for 1 s of exposure and corrected for atmospheric extinction. The color coefficients, zero-points and errors in them were determined by fitting least square linear regressions to the data points. Using the transformation coefficients obtained, photometric magnitudes of 11 secondary stars were determined in the SN 2004et field and their average values are listed in Table 1. The uncertainties are indicated in the parentheses.
| ID | |||||
|---|---|---|---|---|---|
| (mag) | (mag) | (mag) | (mag) | (mag) | |
| 1 | 17.10 (0.012) | 0.97 (0.114) | 1.21 (0.021) | 0.67 (0.022) | 0.74 (0.032) |
| 2 | 18.48 (0.015) | 0.02 (0.108) | 0.92 (0.031) | 0.52 (0.020) | 0.65 (0.055) |
| 3 | 17.66 (0.013) | 0.02 (0.038) | 0.77 (0.022) | 0.38 (0.045) | 0.61 (0.059) |
| 4 | 17.39 (0.011) | 0.31 (0.035) | 0.94 (0.019) | 0.46 (0.013) | 0.68 (0.029) |
| 5 | 17.46 (0.013) | 0.20 (0.045) | 0.84 (0.022) | 0.42 (0.014) | 0.65 (0.030) |
| 6 | 14.15 (0.009) | 1.23 (0.013) | 1.36 (0.012) | 0.74 (0.010) | 0.78 (0.023) |
| 7 | 14.28 (0.009) | 1.06 (0.012) | 1.28 (0.012) | 0.65 (0.010) | 0.82 (0.023) |
| 8 | 14.78 (0.009) | 0.13 (0.010) | 0.74 (0.013) | 0.44 (0.010) | 0.53 (0.023) |
| 9 | 13.80 (0.009) | 0.09 (0.010) | 0.63 (0.012) | 0.39 (0.010) | 0.40 (0.023) |
| 10 | 14.71 (0.009) | 0.33 (0.010) | 0.82 (0.012) | 0.49 (0.010) | 0.46 (0.023) |
| 11 | 14.73 (0.010) | 0.62 (0.012) | 1.07 (0.013) | 0.59 (0.011) | 0.67 (0.023) |
Li et al. (2005) present the magnitudes of 8 secondary standards in the field of SN 2004et. The zero-point differences, based on comparison of 7 secondary standards in the field of SN 2004et, between our photometry and that of Li et al. (2005) are 0.033 , -0.001 and 0.016 in and filters respectively. This shows that our photometric calibration is secure. We cannot compare the and band magnitudes as Li et al. (2005) mention the and band magnitudes for only 2 secondary stars. differences are based on the comparison of the 7 secondary stars in the field of SN 2004et.
Several short exposures, with exposure time varying from 60 sec to 1800 sec, were taken to image SN 2004et. The data have been binned in 2 2 pixel2 because the data are oversampled and data analysis is simplified having a higher signal-to-noise ratio per pixel with fewer pixels. The supernova was differentially calibrated with respect to the secondary stars 6, 7, 8 and 9 listed in Table 1. A full compilation of SN 2004et magnitudes in filters derived in this way along with errors is presented in Table 2.
| Date | Time | |||||
|---|---|---|---|---|---|---|
| (UT) | (JD) | (mag) | (mag) | (mag) | (mag) | (mag) |
| 2004 10 06.630 | 2453285.1296 | 12.44 0.016 | 12.95 0.014 | 12.60 0.019 | 12.27 0.013 | 11.94 0.019 |
| 2004 10 13.616 | 2453292.1162 | 12.88 0.032 | 12.50 0.027 | 12.16 0.027 | 11.88 0.029 | |
| 2004 10 15.584 | 2453294.0844 | 13.20 0.010 | 12.62 0.014 | 12.22 0.016 | 11.91 0.015 | |
| 2004 10 16.603 | 2453295.1031 | 13.15 0.011 | 13.21 0.013 | 12.62 0.013 | 12.23 0.020 | 11.88 0.015 |
| 2004 10 17.552 | 2453296.0517 | 13.26 0.018 | 13.26 0.010 | 12.63 0.026 | 12.24 0.021 | 11.87 0.031 |
| 2004 10 18.573 | 2453297.0726 | 13.40 0.013 | 13.31 0.013 | 12.66 0.021 | 12.23 0.030 | 11.88 0.024 |
| 2004 10 19.607 | 2453298.1072 | 13.50 0.023 | 13.37 0.016 | 12.63 0.019 | 12.21 0.036 | 11.89 0.031 |
| 2004 10 20.568 | 2453299.0677 | 13.63 0.010 | 13.41 0.013 | 12.23 0.019 | 11.90 0.018 | |
| 2004 10 21.554 | 2453300.0543 | 13.72 0.012 | 13.47 0.009 | 12.67 0.014 | 12.22 0.018 | 11.88 0.020 |
| 2004 10 22.560 | 2453301.0596 | 13.81 0.012 | 13.52 0.006 | 12.69 0.016 | 12.25 0.014 | 11.89 0.017 |
| 2004 11 03.570 | 2453313.0698 | 14.77 0.007 | 13.96 0.003 | 12.84 0.004 | 12.33 0.006 | 11.91 0.008 |
| 2004 11 04.542 | 2453314.0422 | 14.83 0.007 | 13.99 0.008 | 12.85 0.008 | 12.32 0.009 | 11.92 0.008 |
| 2004 11 05.570 | 2453315.0699 | 14.89 0.006 | 14.02 0.006 | 12.87 0.007 | 12.33 0.010 | 11.90 0.014 |
| 2004 11 06.548 | 2453316.0476 | 14.95 0.010 | 14.04 0.007 | 12.87 0.010 | 12.34 0.010 | 11.90 0.013 |
| 2004 11 08.550 | 2453318.0504 | 15.06 0.005 | 14.08 0.004 | 12.89 0.006 | 12.35 0.009 | 11.90 0.008 |
| 2004 11 13.550 | 2453323.0499 | 15.32 0.038 | 14.23 0.011 | 12.93 0.005 | 12.35 0.014 | 11.90 0.012 |
| 2004 11 14.543 | 2453324.0431 | 15.37 0.010 | 14.21 0.003 | 12.93 0.010 | 12.35 0.008 | 11.90 0.009 |
| 2004 11 16.538 | 2453326.0377 | 15.48 0.011 | 14.24 0.003 | 12.94 0.004 | 12.36 0.008 | 11.89 0.012 |
| 2004 11 18.541 | 2453328.0415 | 15.62 0.012 | 14.31 0.007 | 12.97 0.013 | 12.37 0.012 | 11.92 0.010 |
| 2004 12 02.572 | 2453342.0717 | 16.18 0.018 | 14.52 0.004 | 13.04 0.003 | 12.40 0.004 | 11.91 0.010 |
| 2004 12 03.587 | 2453343.0867 | 16.16 0.015 | 14.54 0.004 | 13.05 0.003 | 12.41 0.005 | 11.92 0.005 |
| 2004 12 04.574 | 2453344.0742 | 16.22 0.013 | 14.56 0.011 | 13.06 0.016 | 11.92 0.030 | |
| 2004 12 12.539 | 2453352.0389 | 16.54 0.017 | 14.69 0.004 | 13.11 0.007 | 12.44 0.007 | 11.92 0.010 |
| 2004 12 13.535 | 2453353.0353 | 14.71 0.005 | 13.14 0.003 | 12.48 0.004 | ||
| 2004 12 15.578 | 2453355.0783 | 14.73 0.002 | 13.15 0.001 | 12.47 0.002 | 11.96 0.002 | |
| 2004 12 16.551 | 2453356.0512 | 16.63 0.031 | 14.76 0.003 | 13.15 0.002 | 12.48 0.004 | 11.93 0.008 |
| 2004 12 18.560 | 2453358.0597 | 14.80 0.003 | 13.18 0.002 | 12.49 0.003 | 11.98 0.003 | |
| 2004 12 22.546 | 2453362.0456 | 12.50 0.012 | 11.99 0.009 | |||
| 2005 01 02.560 | 2453371.0601 | 12.10 0.006 | ||||
| 2005 10 13.615 | 2453657.1147 | 19.15 0.047 | 18.32 0.020 | 17.31 0.018 | 16.84 0.018 | |
| 2005 10 14.615 | 2453658.1147 | 19.15 0.047 | 18.31 0.020 | 17.31 0.018 | 16.84 0.017 | |
| 2005 10 27.560 | 2453671.0601 | 19.43 0.038 | 18.41 0.018 | 17.50 0.014 | ||
| 2005 10 29.576 | 2453673.0760 | 19.45 0.028 | 18.51 0.017 | 17.59 0.017 | ||
| 2005 11 02.598 | 2453677.0980 | 19.48 0.019 | 18.54 0.020 | 17.59 0.015 | ||
| 2005 11 04.544 | 2453679.0438 | 19.53 0.031 | 18.55 0.014 | 17.61 0.024 | 17.15 0.019 | |
| 2005 11 05.557 | 2453680.0571 | 20.26 0.069 | 19.49 0.022 | 18.59 0.015 | 17.65 0.015 | 17.16 0.020 |
| 2005 11 06.577 | 2453681.0770 | 20.27 0.081 | 19.53 0.018 | 18.61 0.017 | 17.70 0.014 | 17.23 0.017 |
| 2005 11 07.558 | 2453682.0576 | 19.54 0.026 | 18.61 0.017 | 17.67 0.016 | 17.21 0.016 | |
| 2005 11 09.530 | 2453684.0298 | 18.70 0.026 | 17.74 0.019 | 17.20 0.037 | ||
| 2005 11 22.561 | 2453697.0610 | 19.60 0.037 | 18.78 0.021 | 17.91 0.018 | ||
| 2005 11 23.560 | 2453698.0598 | 19.62 0.039 | 18.79 0.024 | 17.92 0.015 | ||
| 2005 11 24.551 | 2453699.0512 | 19.66 0.033 | 18.83 0.020 | 17.96 0.019 | ||
| 2005 12 03.600 | 2453708.1001 | 18.94 0.026 | 18.07 0.020 | 17.54 0.031 | ||
| 2005 12 05.570 | 2453710.0699 | 20.41 0.067 | 19.80 0.030 | 18.99 0.013 | 18.12 0.014 | 17.66 0.015 |
| 2005 12 06.545 | 2453711.0447 | 19.79 0.023 | 18.90 0.025 | 18.16 0.022 | 17.64 0.036 | |
| 2005 12 08.577 | 2453713.0766 | 20.66 0.244 | 19.83 0.040 | 19.04 0.022 | 18.15 0.021 | 17.64 0.026 |
| 2005 12 09.556 | 2453714.0565 | 19.85 0.044 | 19.03 0.029 | 18.11 0.020 | 17.68 0.026 | |
| 2005 12 18.553 | 2453723.0534 | 19.11 0.023 | 18.29 0.014 | |||
| 2005 12 19.554 | 2453724.0538 | 19.11 0.038 | ||||
| 2005 12 20.567 | 2453725.0674 | 19.01 0.024 | 18.23 0.022 | 17.73 0.047 | ||
| 2005 12 21.550 | 2453726.0502 | 19.14 0.042 | 18.33 0.019 | 17.86 0.051 | ||
| 2006 01 04.552 | 2453738.0524 | 19.38 0.037 | 18.59 0.024 | |||
| 2006 01 05.556 | 2453739.0561 | 20.22 0.099 | 19.35 0.037 | 18.58 0.036 |
2.3 GMRT Radio Observations and Data Analysis
We observed SN 2004et with the Giant Meterwave Radio Telescope (GMRT) on January 02, 2005. GMRT is a synthesis array radio telescope consisting of 30 dish antennae of diameter 45 m each. The observations in a frequency band centered at 1390 MHz, with a bandwidth of 16 MHz (divided into a total 128 frequency channels). The total no of antennae available for our observations were 27. The total time spent on the observation was 4 hours, out of which we spent 2.5 hours tracking the target source Field of View (FoV). 3C48 was used as a flux calibrator. The flux density of 3C48 was derived using Baars formulation (Baars et al. 1977) extrapolated to the observed frequency. For phase calibration, we used the source from VLA catalogue 2022+616. Sources 3C48 and 2022+616 were also used for bandpass calibration. 3C48 was observed twice, for 10 minutes each once at the start of the observations and once towards the end. The phase calibrator were observed for 6 minutes after every 25 minutes observation of the supernova FoV. Observation of the phase calibrator at small time intervals was important not only for tracking the instrumental phase and gain drifts, atmospheric and ionospheric gain and phase variations, but also for monitoring the quality and sensitivity of the data and for spotting occasional gain and phase jumps.
The data was analysed using Astronomical Image Processing System (AIPS) software developed by National Radio Astronomy Observatory (NRAO). One clean channel was picked up and VPLOT was used to look for dead antennae and obviously bad baselines. Bad antennae and corrupted data were removed using standard AIPS routines. Data were then calibrated and images of the fields were formed by Fourier inversion and CLEANing using AIPS task “IMAGR”. For 1390 MHz observations, the bandwidth smearing effect was negligible and imaging was done after averaging 100 central frequency channels. The whole field was divided into 2 subfields to take care of the wide field imaging. We performed a few rounds of phase self calibration to remove the phase variations due to the bad weather and related causes and improved the images a good deal.
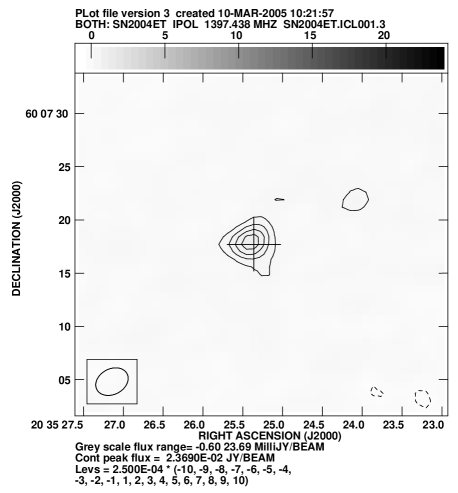
The flux density of 3C48 using Baars formulation is 16.15 Jy. The flux density of the phase calibrator was Jy. AIPS task “JMFIT” was used to fit the Gaussian at the SN position and obtain the flux density. The flux density of SN 2004et was found to be mJy. The map rms of the supernova FoV was 90 Jy and the map resolution was . The J2000 position of the SN 2004et obtained from our GMRT observations in RA and Dec was and respectively, consistent with the optical position of the supernova. Figure 2 shows the radio contour map of SN 2004et FoV.
3 X-Ray Analysis
3.1 X-ray spectra
We extracted counts and spectra in the 0.5–8 keV bandpass from the location of the SN using ACIS Extract version 3.107 (Broos et al. 2002). The source extraction region was chosen to enclose 90% of the point spread function at 1.5 keV, which resulted in a roughly circular region of 1″ radius. We obtained 204, 153, and 156 counts for the three observations. Our background region was a source-free annulus centered on the SN with an inner radius of 6″ and an outer radius of 27″. This background region contained 100 counts in each observation; we therefore expect the source extraction region to contain 0.14 background counts on average. Response files were made using ACIS Extract, which calls the CIAO tools mkacisrmf and mkarf.
We grouped the spectra to contain at least 15 counts/bin and fit them in Sherpa (Freeman et al. 2001) using standard statistics. We fit two simple models: an absorbed power law and an absorbed mekal plasma with elemental abundances allowed to vary. In the mekal fits, if an elemental abundance was consistent with solar, i.e., its 1 confidence interval included the solar value, we froze that abundance and refit in order to find any potential non-solar abundances. In all cases (power law and mekal), the absorbing column was consistent with the value of inferred from the measurement of (Zwitter et al. 2004), using the conversion of (Predehl & Schmitt 1995). We therefore froze the column density at this value and refit the spectra. The results can be found in Table 3. We also give the unabsorbed flux over the Chandra bandpass; the uncertainty in this flux estimate is derived from the uncertainty in the model normalization, found via the projection command in Sherpa.
| ObsID | Date (UT) | Exp | T | PL Index | [0.5–8 keV] | /dof | Mekal kT | [0.5–8 keV] | /dof | Non-solar Abund. | |
|---|---|---|---|---|---|---|---|---|---|---|---|
| (s) | (d) | () | (keV) | () | |||||||
| 4631 | 2004-Oct-22.2 | 29740.2 | 30.2 | 1.3 | 11.5/12 | 20 | 11.9/12 | — | |||
| 4632 | 2004-Nov-06.0 | 27980.4 | 45.0 | 1.6 | 17.2/8 | 3.9 | 4.5/4 | O, Si, Ca, Fe | |||
| 4633 | 2004-Dec-03.5 | 26615.5 | 72.5 | 1.9 | 5.9/9 | 2.8 | 2.2/8 | Ca |
Notes: T = time since explosion, taken to be 2004-Sep-22.0 (Li et al. 2005); PL = power law; all flux es are unabsorbed; confidence intervals are 1

Although these models may be too simplistic, they both show that the X-ray spectrum softens with time, and they are both in fairly good agreement on the unabsorbed flux. Given the low statistical quality of the spectra, more complex models are not warranted. We note that, although the data do not have much power to distinguish different spectral models, both the power law model and the Mekal model with solar abundances provide statistically unacceptable fits to the second observation (without letting the abundances vary, the Mekal fit had a /dof = 17.4/8). The discrepancy between the data and these models could be due to emission from O, Fe, Si, and Ca near 0.7, 1.1, 2.1, and 3.8 keV, respectively, as indicated by the mekal spectra fits with these abundances allowed to vary (see Figure 3). However, this is not conclusive. The best-fit abundances are , , , and , all values with respect to solar.
Rho et al. 2007 reported that the first observation is best fitted by a “thermal model” with a temperature of keV and a lower limit of 0.5 keV. They also report a significantly enhanced column of . However, our Mekal model prefers a much higher temperature for the first observation, keV, with a lower limit of 14 keV, and the index of our power law model also suggests a harder spectrum than a 1.3 keV plasma would be expected to produce. We are unable to reproduce the low temperature found by Rho et al. 2007, with either the Mekal model or Raymond-Smith or thermal bremsstrahlung models. An absorbed Raymond-Smith model (with the column density allowed to vary) gives a temperature of keV (with ). An absorbed bremsstrahlung model gives a temperature of keV (with ). The reason for this discrepancy between our results and those of Rho et al. 2007 are unclear, but their thermal model may have a fairly different distribution of flux than the ones tried here..
3.2 X-ray Evolution
We characterize the X-ray luminosity evolution as a power law in time, . We use the average of the fluxes from both models as the best estimate of the flux from each observation. Using a distance of 5.5 Mpc, the X-ray luminosities are , , and erg . The best fit is . The X-ray light curve is plotted in Figure 4. The spectral evolution can be seen by separately plotting the soft band (0.5–2 keV) and hard band (2–8 keV) fluxes (Figure 4). The soft X-ray luminosity is nearly constant, while the hard band decays with a power law index of . This is very different than the evolution of the type IIP 1999em observed by Chandra (Pooley et al. 2002); in that case, both the hard and soft bands were seen to decay.
We further explore the spectral evolution by examining the temperature evolution, as estimated by the single-temperature Mekal models (Table 3). We plot the X-ray temperature as a function of time in Figure 5. The evolution can be roughly characterized as a power law in time, , with a best fit .


4 Photometric Evolution
In this section we present the results of our photometric observations. Since this supernova is located 247.′′1 east and 115.′′4 south of the nucleus of NGC 6946, the contribution from the galaxy is negligible in determining the supernova magnitudes.
4.1 Reddening towards SN 2004et
The high resolution spectra obtained by Zwitter et al. (2004) shows a relatively featureless spectrum with very broad, low contrast H emission but the presence of sharp interstellar Na I absorption lines. The equivalent width of Na I DII lines corresponds to an estimated total reddening of E(B-V) = 0.41 mag. The galactic extinction towards SN 2004et is E(B-V) = 0.34 mag using the reddening maps of Schlegel et al. (1998) which corresponds to A = 1.06 mag for a RV = 3.1. But the total extinction is E(B-V) = 0.41 mag, thus the rest of it may be attributed due to the host galaxy. Li et al. (2005) adopt a total reddening of E(B-V) = 0.41 0.07 mag towards SN 2004et. The lower limit of this corresponds to no reddening due to the host galaxy. We adopt a total reddening (galactic + host) of E(B-V) = 0.41 0.07 mag for our further analysis.
4.2 Light Curves
The photometric data obtained from 14 days to 470 days since explosion at 53 epochs is compiled in Table 2. We do not have observations near the explosion epoch which are very important to study the overall temporal evolution of the light curve. For this purpose, we have combined the early time data points reported by Li et al. (2005) and the prediscovery magnitudes by Klotz et al. (2004) and collaborators Yamaoka et al. (2004). A Few V band data points by Lindberg (2004) are included at the transition from plateau to tail. The data set by Li et al. (2005) matches best with ours as the comparison stars for the two data sets are similar, as mentioned in Section 2. This allows us to cross compare our photometry with other data available in the literature. U band observations, though small in number, were obtained whenever possible since they are valuable to construct the bolometric light curve especially at early times. The combined light curve is shown in figure 6, and is typical of type II plateau supernovae. Figure 6 also shows the light curves of SN 1999em and SN 1999gi shifted arbitrarily to match those of the SN 2004et light curves. There is a rapid decline in the U band which is followed by a slow decline of the B band during the first 100 days after the explosion. The decline in the B band during the first 100 days as estimated by Sahu et al. (2006) is = 2.2 mag. Patat et al. (1994) classified type II supernovae as plateau and linear on the basis of the B band decline rates. Type IIP supernovae have 3.5 compared to type IIL which have 3.5. The obtained value of for SN 2004et establishes it as a type IIP supernova atleast according to Patat’s classification scheme.

The light curve clearly shows a pronounced plateau of constant luminosity in the bands. The plateau length is estimated to be about 110 10 days from the V band light curve. Type IIP supernovae after the explosion, start cooling slowly to the recombination temperature of hydrogen and radiate energy deposited into hydrogen from the initial shock. This recombination gives rise to a pronounced plateau in the light curve during which the expansion and cooling of the photosphere balance each other so that the luminosity remains almost constant. Immediately after the plateau phase, we notice a steep decline in the V band light where the magnitude falls from 13.50 at 113 d to 15.32 at 142 d after the explosion. This fall of 2 mag in 30 d is clearly seen in the V band light curve. There is a drop in the observed flux in all other passbands after the plateau phase. This fall indicates that the hydrogen recombination wave has receded completely through the massive hydrogen envelope and the supernova now enters the nebular phase. We lack the early nebular phase observations. The decline rates stated by Sahu et al. (2006) from 180 d to 310 d after the explosion in the early nebular phase in B, V, R and I bands are 0.64, 1.04, 1.01 and 1.07 mag respectively. The flux variation in this phase is marked by the radioactive decay of 56Co to 56Fe with an expected decay rate of 0.98 mag/100 days particularly in the V band (Patat et al. 1994). Except for the B band, the decline rates during the early nebular phase in V, R and I bands agree fairly well with the expected decay rate of 56Co to 56Fe. suggesting that little or no -rays escaped during this time. Figure 7 shows the later nebular phase of the light curve from 386 d to 469 d since explosion with the slope of 1.24 mag/(100 days) in the V band. Post 370 d the decline rate during the later nebular phase in bands is 1.01, 1.24, 1.47 and 1.49 mag/(100 days). The decay rate beyond 370 d are quite steep as compared to those in the early nebular phase. The decay rate in the nebular phase deviates from the 56Co to 56Fe decay implying the leakage of -rays and the supernova becoming transparent to the rays or dust formation in the supernova ejecta. Sahu et al. (2006) suggest dust formation in the supernova ejecta around 320 d.

4.3 Color Evolution
In figure 8 we show the color evolution of SN 2004et along with that of SN 1999em, SN 1999gi, SN 1997D and SN 1990E for comparison. The explosion epochs for these supernovae are well established and taken to be JD 2451475.6 (Leonard et al. 2002a), JD 2451526.2 (Leonard et al. 2002b), 2450430.0 (Benetti et al. 2001) and 2447932.0 (Schmidt et al. 1993) for SN 1999em, SN 1999gi, SN 1997D and SN 1990E, respectively. The colors of these supernovae were corrected for a total reddening (galactic + host) adopting the following E(B-V) values of 0.41, 0.06, 0.21, 0.02 and 0.48 for SN 2004et, SN 1999em, SN 1999gi, SN 1997D and SN 1990E, respectively. The U-B and B-V color evolution of SN 2004et is slower than that of SN 1999em which has also been studied by Li et al. (2005) during the first month of evolution. For comparison we show the color evolution of the proto typical faint SN 1997D. At the end of the plateau phase the colors of SN 1997D show a sharp rise and an excess in color as compared to other supernovae. This has been recognised to be a characteristic of faint low-luminosity supernovae such as SN 1997D, SN 1999eu (Pastorello et al. 2004). Color evolution of SN 1990E is also quite rapid but it does not reach a significant excess except in V-I color. Till 100 days after the explosion the overall colors of SN 2004et are bluer as compared to other supernovae. Lack of observations at the transition from plateau to tail phase restricts us to comment on the color evolution. Sahu et al. (2006) mention that the (B-V) and (V-R) colors of SN 2004et are similar to other SN IIP whereas the (R-I) color of SN 2004et is still bluer as compared to SN 1999em beyond 200 days. No unusual change in color is noticed around the dust formation time.

4.4 Temporal Evolution of Photospheric Radius and Color Temperature during the Plateau Phase
The temporal evolution of radius and color temperature is studied during the plateau phase of SN 2004et by the Expanding Photosphere Method (EPM) summarized by Hamuy et al. (2001). The methodology in brief is discussed in this section. Hamuy et al. (2001) assume that if the continuum radiation arises from a spherically symmetric photosphere, the photometric color and magnitude determines the angular radius of photosphere given by
| (1) |
where R is the photospheric radius, D is the distance to the supernova, Bλ(T) is the Planck function at the color temperature of the blackbody radiation, fλ is the apparent flux density and A() is the extinction. Here accounts for the fact that a real supernova does not radiate like a blackbody at a unique color temperature. The implementation of this requires one to make blackbody fits to the observed magnitudes. This involves the determination of synthetic broadband magnitudes from Planck spectra. Hamuy et al. (2001), now compute b(T), the magnitude of Bλ(T) for a filter with central wavelength , to which the following polynomial is fit in the temperature range of 4000 to 25,000 K
| (2) |
The values of the coefficients C are listed in Table 13 of Hamuy et al. (2001). The color temperature are now computed at each epoch using these fits for any combination of magnitude by a minimization technique. The dilution factor () is calculated for our photometric system by performing polynomial fits to given by Hamuy et al. (2001) mentioned below
| (3) |
where S is the filter combination used to fit the atmosphere models with blackbody curves. The coefficients for different filter combinations are listed in Table 14 of Hamuy et al. (2001). Once the color temperature and the values of for different filter combinations are calculated, the photospheric radius at each epoch can be obtained using equation 1 for a known supernova distance D.
Adopting the above approach by Hamuy et al. (2001) we compute the color temperature using filters and the corresponding photospheric radius for the plateau phase of SN 2004et using (galactic+host) = 1.27. The temporal evolution of color temperature and radius is shown in figure 9. We find that the initial color temperature was 12100 K and the supernova cooled to 5000 K till 90 days after the explosion. While the photosphere was cooling during the first 90 days in the plateau phase, the photospheric radius was increasing due to the constant expansion of the ejecta. It is this balance between the steady increase in radius and the decrease in temperature which very well explains the constant luminosity plateau seen in SN IIP light curves.

4.5 The Bolometric Light Curve
The integrated flux in bands gives a meaningful estimate of the bolometric luminosity. The bolometric luminosity in the tail phase provides an accurate estimate of the 56Ni mass ejected in the explosion. The distance to the host galaxy NGC 6946 is well estimated using different methods such as the HI Tully-Fisher relation (Pierce 1994), the CO Tully-Fisher relation (Schoniger & Sofue 1994) and the Expanding Photosphere method (EPM) for type II SNe (Schmidt et al. 1994). We adopt a mean distance of 5.5 1.0 Mpc. To construct the bolometric light curve, we consider here the epochs which have observations in all bands. Our data set is supplemented by the early time data by Li et al. (2005). The UVOIR bolometric light curve is thus constructed using the de-reddened magnitudes and the known distance to NGC 6946. The correction for the missing IR flux has been applied by comparing with the bolometric light curve for SN 1987A. The redshift of the host galaxy NGC 6946 is very small (z = 0.00016; from NED), we have therefore neglected the k-correction. The obtained magnitudes were converted to flux using calibrations by Bessel et al. (1998). The U-band contribution at 8 day is 35 percent and that from the Ic-band is 11 percent. The contribution from the U band decreases towards the end of the plateau phase whereas that from the I band increases. The similar trend is there for SN 1987A. In figure 11 we show the percentage contribution of flux in different bands of SN 2004et during the plateau and the late nebular phases. For a comparison, percentage contribution of flux in the case of SN 1987A in different bands has also been shown. We notice that during the late nebular phase the contribution from the U band starts to increase and is 5 percent and that from Ic band decreases and reached 28 percent at 476 d. The U band contribution during the initial days is significant as compared to Ic and Rc bands. We have taken into account any contribution from the near IR bands while constructing the UVOIR bolometric light curve. In figure 10 we show the UVOIR bolometric light curve constructed from bands as asterisks. The open circles in the figure shows the contribution from the bands alone, showing that the U-band flux is dominant during the early phase. The open triangles show the bolometric light curve. The figure clearly shows that we miss out quite a lot of flux if we do not account for the contribution from the near IR bands. The bolometric luminosity of the exponential tail gives an estimate of 56Ni mass ejected during the explosion by a direct comparison to the bolometric light curve of SN 1987A (shown by dashed line in figure 10). The estimation of 56Ni mass using the bolometric light curve is discussed in detail in the next section.


4.6 Physical Parameters
4.6.1 Estimate of ejected Nickel mass
The tail phase of the light curve of a type IIP supernova is thought to be powered by the radioactive decay of 56Co to 56Fe. The luminosity in the tail phase is directly proportional to the amount of nickel produced in the explosion. To estimate the amount of nickel produced in the explosion of SN 2004et, we use here different methods. These methods are briefly described below.
-
•
Nickel mass from the bolometric luminosity of the exponential tail
The nickel mass derived from the bolometric luminosity of the exponential tail as described by Hamuy (2003) assumes that all the -rays during the radioactive decay of 56Co to 56Fe are fully thermalized. It is to be noted here that 56Co is the daughter nucleus of 56Ni, thus the bolometric luminosity in the exponential tail is proportional to the ejected 56Ni mass. The late time decline rates for SN IIP are consistent with the decay of 56Co to 56Fe. The V band () magnitude in the exponential tail is first converted into bolometric luminosity () in erg/sec using a total extinction of = 1.27, a distance of 5.5 1.0 Mpc and applying a bolometric correction of BC = 0.26 0.06. The nickel mass is then estimated by using eq. (2) of Hamuy (2003). We estimate the nickel mass using this method at two different points in the tail and obtain an average value of nickel ejected in the explosion as = 0.06 0.03 . -
•
Nickel mass from ‘steepness of decline’ S correlation
Elmhamdi et al. (2003) present a correlation between the rate of decline from plateau to tail in the V band and the nickel mass. Elmhamdi et al. (2003) define a steepness ‘’ parameter, which is the maximum gradient during transition in mag/day. Elmhamdi et al. (2003) using a sample of type IIP supernova conclude that the steepness ‘’ anticorrelates with the 56Ni mass. The smaller the amount of 56Ni, the steeper will be the transition from the plateau to tail. For SN 2004et, we do not have a well sampled V band light curve during the transition from the plateau to the tail. Hence the determination of will result in large uncertainties. Using the available data set we obtain S = 0.07 0.02 which results in = 0.056 0.016 M⊙ using eq. (3) of Elmhamdi et al. (2003).
Sahu et al. (2006) also estimate the nickel mass by comparing the tail phase bolometric luminosity with that of SN 1987A during 250 d to 300 d if we assume that the ray deposition for both SN 2004et and SN 1987A is the same. The estimated mass of is 0.048 0.01 M⊙ for a value of 0.075 M⊙ for SN 1987A (Turatto et al. 1998). But we lack the early nebular phase observations and towards the late nebular phase the ray deposition for SN 2004et and SN 1987A is not really the same and there is evidence of dust formation around 310 days. Thus, we do not adopt this method for nickel mass estimation.
We discussed here different methods to determine the amount of nickel ejected in the explosion and see that values obtained are consistent with each other within errors.
4.6.2 Progenitor star properties
Litvinova & Nadëzhin (1985) investigated the course of type II supernovae by constructing hydrodynamical models. They investigated the dependence of supernova outburst on three basic parameters: the ejected mass of the envelope (Mej), the pre-supernova radius (R0) and the energy of explosion (E). Litvinova & Nadëzhin (1985) obtained approximate expressions for Mej, R0 and E in terms of three observational parameters: the plateau duration (tp), the absolute V magnitude at the mid plateau epoch (MV) and the expansion velocity of the photosphere at the mid plateau epoch (Vph). Similarly, Popov (1993) derived somewhat different expressions for Mej, R0 and E based on the analytical models. The input parameters required in the model are the plateau duration (tp), the photospheric velocity (Vph) and the absolute magnitude (MV).
The detailed photometric observations of SN 2004et show that the plateau length (tp) was 110 10 days and the absolute V magnitude (MV) at the mid of the plateau is -17.08 0.39. The spectroscopic observations of weak iron lines indicate a mid plateau velocity (Vph) of 3560 100 km/sec as reported by Sahu et al. (2006). We use the photospheric velocity given by Sahu et al. (2006) at the mid plateau epoch for further analysis. Using the relations by Litvinova & Nadëzhin (1985) and Popov (1993) we derive the parameters Mej, R0 and E for SN 2004et which are listed in Table 4. The obtained estimates of Mej, R0 and E using expressions by Litvinova & Nadëzhin (1985) and Popov (1993) are consistent within errors.
| Ejected | Pre-supervova | Explosion | |
|---|---|---|---|
| Mass | Radius | Energy | |
| Mej (M⊙) | R0 (R⊙) | E () (erg) | |
| Litvinova | 16 5 | 530 280 | 0.98 0.25 |
| Nadëzhin | |||
| Popov | 8 4 | 1251 937 | 0.60 0.32 |
If approximately 1.5 M⊙ is enclosed in the neutron star and 0.5 - 1.0 M⊙ is lost by the wind, we obtain a range of roughly 10 to 20 M⊙ for the progenitor of SN 2004et. Sahu et al. (2006) find that the [OI] luminosities of SN 2004et and SN 1987A are comparable. The [OI] luminosity of SN 1987A corresponds to an Oxygen mass in the range 1.5 - 2 M⊙. This Oxygen mass corresponds to a main sequence mass of 20 for SN 2004et. Li et al. (2005) derive the progenitor mass by analysing the high-resolution CFHT pre-supernova images of NGC 6946 and suggest the progenitor to be a yellow supergiant of 15 M. Further details on the evolutionary sequence of the progenitor can be obtained from Li et al. (2005). The progenitors of SN IIP are generally considered to be red supergiants with thick hydrogen envelopes which gives rise to the plateau phase in the optical light curve and a typical P-Cygni spectral profile. The spectroscopic analysis at 9 and 20 days after the explosion carried out by Li et al. (2005) shows a lack of a typical P-Cygni profile. Another interesting feature of SN 2004et to note here is the radio emission detected on October 05, 2004 (Stockdale et al. 2004) just 14 days after the explosion which clearly suggests the presence of dense circumstellar material. Therefore, it is likely that the progenitor experienced a RSG phase close to the time of explosion. Chevalier et al. (2006) modelled the radio data and found a progenitor mass of 20 M for SN 2004et which includes the mass loss rate obtained from radio observations. The measurements of the progenitor star by Li et al. (2005) were teken at ground based resolution and it is possible that the star observed was blended with another star that did not partake in the explosion. The progenitor masses for SN 2004et obtained using different methods is consistent with the results within uncertainties. The light curves and the pre-supernova radius 5 derived here suggests that the progenitor of SN 2004et is likely a red supergiant.
| Parent | Distance | MV | E (10 | R (R⊙) | Mejected | Mms | Estimated | |||
|---|---|---|---|---|---|---|---|---|---|---|
| Supernova | Galaxy | 56Ni | ||||||||
| (Mpc) | (mag) | (mag) | (days) | (ergs) | (M⊙) | (M⊙) | (M⊙) | |||
| 1987A | LMC | 0.05 | 0.60 | 40 | 1.3 | 40 | 15 | 20 | 0.075 | |
| 1990E | NGC 1035 | 21.03 | 1.5 | -16.93 | 13110 | 3.4 | 162 | 48 | 0.073 | |
| 1997D | NGC 1536 | 13.43 | 0.07 | -14.65 | 50 | 0.1 | 85 | 61 | 8-12 | 0.002 |
| 1999em | NGC 1637 | 8.20.6 | 0.31 | -16.48 | 95 | 1.2 | 249 | 27 | 121 | 0.042 |
| 1999gi | NGC 3184 | 11.1 | 0.65 | -15.68 | 95 | 1.5 | 81 | 43 | 15 | 0.018 |
| 2003gd | M74 | 9.31.8 | 0.43 | -15.92 | 67 | 6 | 8 | 0.016 | ||
| 2004A | NGC 6207 | 20.33.4 | 0.19 | -16.24 | 80 | 11 | 9 | 0.046 | ||
| 2004dj | NGC 2403 | 3.470.2 | 0.22 | -15.88 | 10020 | 0.86 | 155 | 19 | 20 | 0.020.01 |
| 2004et | NGC 6946 | 5.51.0 | 1.27 | -17.08 | 11010 | 0.980.25 | 530280 | 165 | 20 | 0.060.03 |
| 2005cs | M51 | 8.4 | 0.34 | -15.2 | 90-120 | 7-12 | 10-2 |
* References: SN 1987A: Hamuy et al. 2003, Woosley et al. 1989; SN 1990E: Schmidt et al. 1993, Hamuy et al. 2003; SN 1997D: Toratto et al. 1998, Chugai et al. 2000; SN 1999em: Leonard et al. 2002, Hamuy et al. 2003; SN 1999gi: Leonard et al. 2002, Hamuy et al. 2003; SN 2003gd: Hendry et al. 2005; SN 2004A: Hendry et al. 2006; SN 2004dj: Vinko et al. 2006; SN 2004et: Present Work (the progenitor star properties are those obtained from Litvinova & Nadëzhin (1985)); SN 2005cs: Pastorello et al. 2006.
5 A comparison with other SN IIP
The light curves of SN 2004et are similar to those of typical type IIP supernovae SN 1999em and SN 1999gi during the plateau phase shown in figure 6. During the transition, the V band light curve of SN 2004et matches well with SN 1999gi. Color evolution of SN 2004et is studied in figure 8 and we see that the U-B and B-V colors of SN 2004et evolves slowly than that of SN 1999em. SN 2004et appears to be more like a normal type IIP apart from the difference in U-B and B-V color evolution with SN 1999em. The spectrum of SN 2004et has a bluer continuum than SN 1999em (Li et al. 2005). The peculiar P-Cygni profile in H is dominated by the emission component unlike the typical P-Cygni profile in SN 1999em. SN 2004et evolves slower than SN 1999em in the UV part of the spectrum which explains the slow photometric evolution of U-B and B-V colors. Höflich et al. (2001) based on theoretical models find that though the peak luminosity varies among SN IIP, but the average absolute brightness during the plateau phase remains more or less the same with -17.6 0.6 mag. In figure 12 we compare the absolute V band light curves of SN 2004et with those of SN 2004dj, SN 2004A, SN 2003gd, SN 1999em, SN 1999gi, SN 1997D, SN 1990E and SN 1987A. The parameters of these supernovae along with references are mentioned in Table 5. The absolute V band light curve of SN 2004et during the plateau phase matches very well with that of SN 1990E. The bolometric luminosities for these two supernovae are similar during the plateau phase but the tail luminosity of SN 2004et is lower than that of SN 1990E. This is because of the lower 56Ni mass synthesised during the explosion of SN 2004et as compared to SN 1990E.
Chevalier et al. (2006) place the supernovae in two mass groups, 8 - 13 M and 13 - 18 M, the low mass and the high mass group respectively. The progenitor mass of different type IIP supernovae are listed in Table 5. There exist clearly two groups of supernovae with high mass progenitors (SN 1999em, SN 1999gi, SN 2004dj, SN 2004et) and low mass progenitors (SN 1997D, SN 2003gd, SN 2004A, SN 2005cs). Thus, placing SN 2004et progenitor in the upper end of the mass range of SN IIP.

6 X-ray emission
We interpret the X-ray emission in terms of the circumstellar interaction model for type IIP SNe discussed by Chevalier et al. (2006) and references therein. The first two observations have temperatures above K (and the last is only slightly below this), a regime in which the reverse shock is expected to be nonradiative and free-free emission dominates. The X-ray luminosity is given by their eq. (9), which comes from Fransson, Lundqvist, & Chevalier (1996):
where is 0.86 for solar abundances, is the index of the ejecta density profile (), is the temperature in units of K, is the mass loss rate of the progenitor in units of , is the wind velocity in units of 10 , is the shock velocity in units of , and is the time since explosion.
Following the discussion of 2004et in Chevalier et al. (2006), we take and use an expansion velocity of 15,000 at 10 days (based on the maximum velocity of 14,200 found by Li et al. 2005). The shock velocity is expected to evolve as (Chevalier et al. 2006). The typical wind velocity for a yellow supergiant is not well known; red supergiants are expected to have winds with velocities of 10–15 .
We use each of our three X-ray measurements to estimate the mass-loss of the progenitor, and find values of = 2.2, 2.1, and 2.5, respectively, assuming that the reverse shock is responsible for the X-ray emission. We can check the expected strength of the circumsteller shock using eq. (8) of Chevalier et al. (2006). This predicts (over the 0.5–8 keV band) of 2.9, 0.8, and erg s-1, indicating that the reverse shock does indeed dominate.
However, there are some discrepancies between the data and this model. For example, the expected evolution of the total X-ray luminosity when free-free emission dominates as (Chevalier & Fransson 1994), much different than the evolution seen. One possibility is that the harder band (2–8 keV) X-ray emission is due to the reverse shock, and it shows roughly the expected evolution (Figure 4). The softer band (0.5–2 keV) emission represents some (unexplained) steady component. Under this assumption, we calculate the mass-loss using only the 2–8 keV emission and find = 2.1, 1.8, and 2.0 for each of the three observations respectively (again for ). The temperature evolution is much more rapid than expected in the reverse shock model, in which for (Fransson et al. 1996). However, if there are two distinct components of the emission (a steady soft component and a decaying hard component), these simple single-temperature models may be misleading. In addition, a single-temperature model of just the emitting shock region may be inaccurate (e.g., see the discussion in Nymark, Fransson, & Kozma 2006).
A faster temperature evolution is expected for a smaller value of , but even results in a much slower evolution () than is seen. However, if a smaller is part of the explanation of the rapid temperature evolution, the mass loss estimates would increase. For , we calculate = 5.3, 6.0, and 7.5 for each of the three observations, respectively.
7 Radio emission at 1.4 GHz
SN 2004et was detected at radio wavelengths by Stockdale et al. (2004) using the VLA on 2004 October 5.128 UT which is just 14 days after the explosion. It was extensively monitored at 22.5 GHz, 14.9 GHz, 8.46 GHz (Stockdale et al. 2004) and 4.99 GHz (Beswick et al. 2004) . Chevalier et al. (2006) present the data in other frequencies along with the modelled light curve. We have the lowest frequency observation available here at 1.39 GHz using the GMRT.
Chevalier et al. (2006) have presented modelled light curves at different radio frequencies using two different combinations of and , where is the fraction of total blast wave energy in post shock magnetic field and that in relativistic particles. The two combinations are = 0.0013, = 0.04 and = 0.2, = 0.001. The details of the model can be obtained from Chevalier et al. (2006). We have scaled the radio light curves at different frequencies presented by Chevalier et al. (2006) to 1.39 GHz frequency. The scaled light curve obtained for 1.39 GHz for the two different combinations of and are shown in figure 13. We see that the observed flux at 1.39 GHz is close to that expected in both light curves, but it is in somewhat better agreement with that for the combination = 0.2, = 0.001.

Based on the 2–8 keV luminosity of X-ray observations adopting n = 10, we estimate a mass-loss rate for the progenitor star of for an assumed wind velocity of 10 similar to the standard mass loss prescription of = 1.3 – 3 for a progenitor mass of 15 . The value of is determined by the turn on time but it also depends on the temperature of the circumstellar medium. The radio model of Chevalier et al. (2006) lead to an estimate of 10. With as determined from X-ray observations, we deduce that the temperature of the unshocked circumstellar medium (CSM) is Tcs 104 K.
8 Conclusions
The conclusions of the present paper are summarized below:
-
•
We present the Chandra X-ray observations of a type IIP supernova SN 2004et at three epochs. We extract the X-ray spectra and try to fit two simple models – an absorbed power law and an absorbed mekal plasma model. We notice that the spectra softens with time. The X-ray luminosity is well characterised by .
-
•
An extensive photometric coverage starting from 14 to 470 days since explosion is presented. The explosion date is well constrained at Sept. 22.0, 2004 (JD 2453270.5) based on the pre-discovery magnitudes which is about 5 days before the discovery on Sept. 27.0, 2004. SN 2004et showed a pronounced plateau phase with a plateau duration of 110 10 days. The average absolute V magnitude during the plateau phase is -17.08. The light curves and color curves of SN 2004et were compared with those of SN 1999em and SN 1999gi. The U-B and B-V color evolution of SN 2004et is different than SN 1999em and they evolve slowly compared to SN 1999em.
-
•
Temporal evolution of photospheric radius and color temperature is studied during the plateau phase using the technique by Hamuy et al. (2003). The temperature decreases from 12100 K to 5000 K with an increase in the photospheric radius.
-
•
The bolometric light curve of SN 2004et is constructed by integrating the flux in bands using a distance estimate of 5.5 1.0 Mpc to NGC 6946 and the known reddening of E(B-V) = 0.41 0.07. The tail bolometric luminosity was compared to that of SN 1987A.
-
•
The ejected 56Ni mass estimated in the explosion is 0.06 0.03 M⊙. The physical parameters such as the ejected mass (Mej), the pre-supernova radius (R0) and the explosion energy (E) are estimated using the expressions given by Litvinova & Nadëzhin (1985) based on hydrodynamical models and those given by Popov (1993) based on the analytical models. This gives the ejected mass in the range 8 16 M⊙ and a progenitor star of 20 M⊙.
-
•
The radio observations at 1.4 GHz were carried out from GMRT. The 1.4 GHz observation was compared with the predictions of the model proposed by Chevalier et al. (2006). Thus, the model by Chevalier et al. (2006) reproduces and explains the light curve at 1.4 GHz, fairly.
-
•
The bulk of the X-ray emission detected by Chandra is due to a reverse shock. The 2–8 keV luminosity roughly follows the expected evolution of free-free emission from the reverse shock. The 0.5–2 keV luminosity stays roughly constant. Based on the 2–8 keV luminosity, we estimate a mass-loss rate for the progenitor star of for an assumed wind velocity of 10 .
Acknowledgement
We thank all the observers at Aryabhatta Research Institute of Observational Sciences (ARIES) who granted their valuable time and support for the continous observations of this event over a span of almost one and a half years. We are thankful to GMRT staff for carrying out our observations. GMRT is operated by the National Center for Radio Astrophysics of the Tata Institute of Fundamental research. We thank the anonymous referee for useful comments which helped to improve the manuscript. IRAF is distributed by the National Optical Astronomy Observatories, which are operated by the Association of Universities for Research in Astronomy, Inc., under contract to the National Science Foundation. AIPS is run by National Radio Astronomy Observatory (NRAO). D. P. gratefully acknowledges the support provided by NASA through Chandra Postdoctoral Fellowship grant PF4-50035 awarded by the Chandra X-Ray Center, which is operated by the Smithsonian Astrophysical Observatory for NASA under contract NAS8-03060. WHGL acknowledges support from Chandra.
References
- (1) Baars J. W. M., Genzel R., Pauliny-Toth I. I. K., Witzel A., 1977, A&A, 61, 99
- (2) Benetti S., Turatto M., Balberg S. et al., 2001, MNRAS, 322, 361
- (3) Bessell M. S., Castelli F., Plez B., 1998, A&A, 333, 231
- (4) Beswick R. J., Muxlow T. W. B., Argo M. K. et al., 2004, IAU Circular 8435
- (5) Broos, P. S., Townsley, L. K., Getman, K., & Bauer, F. E. 2002, ACIS Extract, An ACIS Point Source Extraction
- (6) Chevalier R. A., & Fransson C. 1994, ApJ, 420, 268
- (7) Chevalier R. A., Fransson C. & Nymark T. K., 2006, ApJ, 641, 1029
- (8) Chugai N. N., Utrobin V. P., 2000, A&A, 354, 557
- (9) Elmhamdi A., Chugai N. N. & Danziger I. J., 2003, A & A, 404, 1077
- (10) Fransson C., Lundqvist P., & Chevalier R. A. 1996, ApJ, 461, 993
- (11) Freeman, P., Doe, S., & Siemiginowska, A. 2001, Proc. SPIE, 4477, 76
- (12) Hamuy M., Suntzeff N. B., González R. et al., 1988, AJ, 95, 1
- (13) Hamuy M., Pinto P. A., Maza J. et al., 2001, ApJ, 558, 615
- (14) Hamuy M., 2003, ApJ, 582, 905
- (15) Hendry M. A., Smartt S. J., Maund J. R. et al., 2005, MNRAS, 359, 906
- (16) Hendry M. A., Smartt S. J., Crockett R. M. et al., 2006, MNRAS, 369, 1303
- (17) H flich P., Straniero O., Limongi M., et al., 2001, RMxAC, 10, 157
- (18) Itagaki K. & Yamaoka H., 2004, IAU Circular 8413
- (19) Klotz A., Pollas C. & Boer M., 2004, IAU Circular 8413
- (20) Landolt A. R., 1992, AJ, 104, 340
- (21) Leonard D. C., Filippenko A. V., Gates E. L. et al., 2002a, PASP, 114, 35
- (22) Leonard D. C., Filippenko A. V., Li W. et al., 2002b, AJ, 124, 2490
- (23) Li W. & Filippenko A. V., 2004, IAU Circular 8413
- (24) Li W., Filippenko A. V., Van Dyk S. D. et al., 2004, IAU Circular 8414
- (25) Li W., Van Dyk S. D., Filippenko A. V. et al., 2005, PASP, 117, 121
- (26) Litvinova I. Y. & Nadëzhin D. K., 1985, SAVL, 11, 145
- (27) Lindberg H., 2004, http://www.astrosurf.com/snweb2/2004/ 04et/04etMeas.htm
- (28) Maund J. R., Smartt S. J., Kudritzki R. P., et al., 2004, Nature, 427, 129
- (29) Nymark T. K., Fransson C., & Kozma C. 2006, A&A, 449, 171
- (30) Pastorello A., Zampieri L., Turatto M., et al., 2004, MNRAS, 347, 74
- (31) Pastorello A., Sauer D., Taubenberger S. et al., 2006, MNRAS, 370, 1752
- (32) Patat F., Barbon R., Cappellaro E. et al., 1994, A & A, 282, 731
- (33) Pierce M. J., 1994, ApJ, 430, 53
- (34) Pooley D., et al. 2002, ApJ, 572, 932
- (35) Popov D. V., 1993, ApJ, 414, 712
- (36) Predehl P. & Schmitt J. H. M. M., 1995, A & A, 293, 889
- (37) Rho J., Jarrett T. H., & Chevalier R. 2007, CBET 810
- (38) Sahu D. K., Anupama G. C., Srividya S., Muneer S., 2006, MNRAS, 372, 1315
- (39) Schmidt B. P., Kirshner R. P., Schild R. et al., 1993, AJ, 105, 6
- (40) Schmidt B. P., Kirshner R. P., Eastman R. G., et al., 1994, ApJ, 432, 42
- (41) Schoniger F. & Sofue Y., 1994, A&A, 283, 21
- (42) Stockdale C. J., Weiler K. W., Van Dyk S. D. et al., 2004, IAU Circular 8415
- (43) Turatto M., Mazzali P. A., Young T. R., et al. 1998, ApJL, 498, L129
- (44) Suntzeff N. B. & Bouchet P., 1990, AJ, 99, 650
- (45) Van Dyk S. D., Garnavich P. M., Filippenko A. V., et al., 2002, PASP, 114, 1322
- (46) Vinkó J., Takáts K., Sárneczky K. et al., 2006, MNRAS, 369, 1780
- (47) Woosley S. E., Hartmann D., Pinto P. A., 1989, ApJ, 346, 395
- (48) Zwitter T., Munari U. & Moretti S., 2004, IAU Circular 8413