Hysteresis of spectral evolution in the soft state of black-hole binary LMC X–3
Abstract
We report the discovery of hysteresis between the x-ray spectrum and luminosity of black-hole binary LMC X–3. Our observations, with the Proportional Counter Array on the Rossi X-ray Timing Explorer, took place entirely within the soft spectral state, dominated by a spectral component that was fitted well with a multicolor disk blackbody. A power-law component was seen only during times when the luminosity of the disk blackbody was declining. The x-ray luminosity at these times was comparable to that seen in transient systems (x-ray novae) when they return to the hard state at the end of an outburst. Our observations may represent partial transitions to the hard state; complete transitions have been seen in this system by Wilms et al. (2001). If they are related to the soft-to-hard transition in transients, then they demonstrate that hysteresis effects can appear without a full state transition. We discuss these observations in the context of earlier observations of hysteresis within the hard state of binaries 1E 1740.7–2942 and GRS 1758–258 and in relation to published explanations of hysteresis in transients.
1 Introduction
There are five persistently active black-hole-binary candidates: LMC X–3, LMC X–1, Cyg X–1, 1E 1740.7–2942 and GRS 1758–258. The latter two are candidates by courtesy, since their masses have not been measured from their orbital parameters. Super-Eddington systems like SS 433 and Cyg X–3 are excluded from this list because neither pulsations or bursts would be expected even if they contain neutron stars, making identification of the compact object difficult. Also excluded from this definition are systems with a very large variability that spend long periods with little or no emission, such as GRS 1915+105 and GX 339–4; these are intermediate between the persistent sources and the x-ray novae, which have rare, bright, discrete outbursts lasting weeks to months. Within the class of five systems thus defined, there is a wide range of secondaries. In order of descending mass, Cyg X–1 has an O9.7Iab (blue supergiant) companion (Gies & Bolton, 1986), LMC X–1 a blue giant of type O7III (Cowley et al., 1995), LMC X–3 a massive B3V main sequence star (Warren & Penfold, 1975), and GRS 1758–258 and 1E 1740.7–2942 are thought to contain low-mass red giants (Martí et al., 1998; Rothstein et al., 2002; Smith, Heindl & Swank, 2002a).
Cyg X–1, being the brightest of these systems and the first discovered, has long been treated as the canonical persistent black-hole binary, and models of the accretion and x-ray emission processes have often concentrated on explaining its behavior. In Cyg X–1, the x-ray luminosity is higher when the spectrum is soft (dominated by the thermal component, with an additional power-law component of index –2.4) and lower when the spectrum is hard (power-law dominated, with index –1.7). There is no time delay; the two quantities evolve simultaneously (e.g., Smith, Heindl & Swank, 2002b; Pottschmidt et al., 2003). A different behavior is seen in outbursts of x-ray novae: a transition from hard to soft at the peak of luminosity, followed by the reverse transition at a much lower level during the decay of the outburst. This has been called “hysteresis” and has been observed and discussed extensively in the literature (e.g., Miyamoto et al., 1995; Homan et al., 2001; Maccarone & Coppi, 2003).
In earlier papers (Main et al., 1999; Smith, Heindl & Swank, 2002b; Pottschmidt et al., 2006) we demonstrated a hysteresis effect for changes within the hard state in the persistent binaries 1E 1740.7–2942 and GRS 1758–258. The result, clear in both sources, is that the power-law index correlates with the opposite of the derivative of the photon flux; i.e. the spectrum is softest while the photon flux is dropping. Further, there is a time-delay: the power-law index leads the change in photon flux by about 10 dy. In Main et al. (1999) we only had a single, slow rise and fall in photon flux to observe in each source; at that time, the pattern of changes could have been a simple time delay. In the later papers, there are both gradual and abrupt drops in photon flux, and we can see that the characterization of spectral dependence on the derivative is correct: the spectrum softens much more violently when the count rate drops more quickly.
Our qualitative explanation for this behavior is discussed in §4.1 Briefly, we assumed that a hot corona upscatters nearly all the x-rays from a thin disk present even in the hard state (Chakrabarti, 1997). The coronal and disk accretion flows are fed simultaneously, and when the mass flow drops it drops first in the corona – softening the spectrum – and, after a viscous delay, in the thin disk, lowering the count rate (Chakrabarti and Titarchuk, 1995). Adopting a picture so obviously oversimplified was justified by its ability to explain several different features of the data, both slow changes over months (Main et al., 1999) and two rapid changes over days: a sudden shutoff of GRS 1758–258, in which the hard component vanished first (Smith et al., 2001), and a brief, temporary hardening in 1E 1740.7–2942, with no change in photon flux, interpreted as a brief “puff” of extra coronal material, too short to have a noticeable influence on the disk later on (Smith, Heindl & Swank, 2002b).
2 Observations
In March 2005, we began twice-weekly observations of LMC X–3 with the Rossi X-ray Timing Explorer (RXTE), as an extension to our original monitoring program of 1E 1740.7–2942 and GRS 1758–258. The system had been observed many times by RXTE in the past, but never with the frequency necessary to systematically observe time evolution on the expected viscous timescale of days to weeks. Since LMC X–3 is usually in the soft state, our intention was to see if there was any hysteresis among the measurable quantities in the soft-state spectrum: temperature and flux of the thermal component and index and flux of the power law. Since LMC X–3 does not have a supermassive companion, and probably accretes via Roche-lobe overflow rather than a wind, we thought it might show effects at the viscous timescale. The second goal of the program, after the search for hysteresis, was to serve as a trigger for deeper observations of the rare hard state. There has not been a transition to the hard state during our monitoring so far.
The RXTE observations used here were target #03 of proposals 91105 and 92095, for a total of 139 pointings as of August 2006 (the campaign is still in progress). The Proportional Counter Array (PCA) data were analyzed with version 5.3.1 of FTOOLS including version 11.3.1 of XSPEC (Arnaud, 1996). Since the data were not of high statistical significance, particularly in the power law component, it was necessary to minimize the number of free parameters in the fit. We began with the simple model of a multicolor disk blackbody (Mitsuda et al., 1984) plus a power law. We froze the equivalent hydrogen column at cm-2 (Page et al., 2003). The statistics in the power law component were often not good enough to simultaneously constrain the index and intensity well. Since the power law index of black hole binaries in the soft state often saturates at a value near 2.5 (Titarchuk & Shaposhnikov, 2005), we decided to freeze the index at a value typical for LMC X–3.

We analyzed 22 deep pointings ( 10 ks) to LMC X–3 from earlier in the RXTE mission (MJD 50318 to 51267) to see if they had a relatively narrow distribution of indices and select the best value. Because the counting statistics in the bright disk blackbody component are orders of magnitude better than those in the power-law tail, we found that tiny discrepancies between the model and the data in the 3–6 keV band would force the best overall fit to be very poor in the power-law-dominated part of the spectrum (above 10 keV) (Wilms et al., 2001): the power-law indices were clearly much too soft. When we restricted these fits to the 6–20 keV range, the model fit much better where the power law dominated, and gave harder indices. A similar result was obtained by adding a 1% systematic error to the data points and fitting over the full range (3–20 keV). The softer indices from our first attempt at fitting were consistent with those reported by Nowak et al. (2001). Figure 1 shows the new power-law indices from the deep pointings. The mean of the distribution (optimally weighted) is 2.34 and the reduced for the hypothesis of a constant value is 0.82. We kept the power-law index fixed at this value for the fits to our monitoring observations. This gave us three parameters for each fit: the power-law flux, disk blackbody flux, and disk blackbody temperature.
3 Results
We expect a close correlation between the disk blackbody flux and temperature in the absence of any change in geometry such as a change in the inner radius or a change in inclination. This correlation is indeed present, as shown in Figure 2. The model shown with the data is the disk blackbody of Mitsuda et al. (1984) integrated from 2–10 keV, as was the fit to each observation. It has been normalized to match the data but there are no other free parameters. As expected, there is no hysteresis between these parameters (which would spoil the correlation); this suggests that there was no major change in the disk inner radius or inclination angle over the 1.5 yr of this campaign. This comfirms the results of Ebisawa et al. (1993) and Wilms et al. (2001), although see Merloni, Fabian & Ross (2000) for complications related to the interpretation.

Since these parameters are so closely correlated, either can be equivalently compared to the power-law flux. Figure 3 shows the power-law normalization and disk-blackbody flux as a function of time. A hysteresis effect is immediately obvious: every peak in the power-law flux is related to a drop in the blackbody flux, and the size of the peak is proportional to the size of the drop. Since the effect is asymmetrical in time and repeated several times, it cannot be due to any issue of the fitting procedure (e.g. deviations from a true disk blackbody distorting the power-law fit), since such effects would have no sensitivity to the time-ordering of the observations.
If we assume that there is an optically thin corona above an optically thick, geometrically thin thermal disk, then the photon flux from the thermal component, , depends primarily on the mass accretion rate proceeding through the thin disk and not on its surface density . The accretion rate is proportional to the power of the observed flux (Frank, King & Raine, 2002). In steady state, there is also a relation between and , but we want to retain the possibility of being out of equilibrium with respect to the viscous time scale. The flux seen in the Comptonized power-law tail, , should go approximately as ; so we can approximate by .
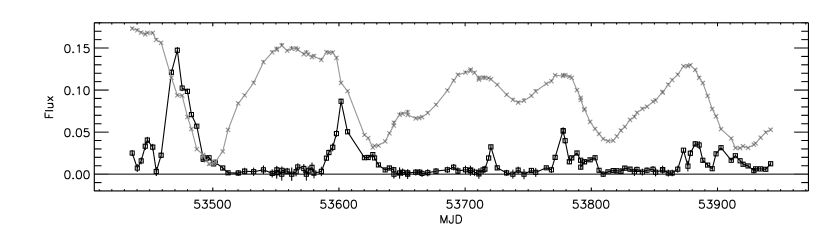
Figure 4 shows and with these assumptions. For a highly sub-Keplerian corona in near free-fall, as was assumed in Smith, Heindl & Swank (2002b), but the result of Figure 4 is more general if interpreted as and without this assumption. We see that the corona turns on and shuts off rather symmetrically (this would not be apparent when looking at the raw data of Figure 3). The corona seems to be present during the decline of and shuts off only when begins to rise again.


The size of the peak in seems to increase as the following dip in gets deeper. To quantify this, we identify five discrete episodes of power-law emission, peaking at MJD 53487, 53602, 53720, 53778, and 53914. The next minima in the curve of appear at MJD 53497, 53627, 53742, 53813, and 53918, an average of 19 days later. Figure 5 shows the maxima in as a function of the reciprocal of the corresponding minimum . Figure 6 shows the same maxima of coronal density plotted, instead, against the maximum steepness of the associated decline (in arbitrary units). More data are needed to see which correlation better characterizes the situation.
4 Discussion
4.1 Interpretation in a two-flow picture
Chakrabarti and Titarchuk (1995) originated the concept we used in Smith, Heindl & Swank (2002b), of two separate accretion flows, one Keplerian and one sub-Keplerian, co-existing at all radii, that could be fed separately. Hysteresis effects come about due to the viscous delay in the Keplerian disk; the changes in accretion rate propagate to the central regions, where x-rays are created and upscattered, first in the sub-Keplerian flow and only later in the Keplerian flow. We have used the adjective “independent” to indicate that in this picture the state of the corona is not entirely and uniquely determined by the instantaneous state of the thin disk. It has been pointed out, rightly, that the flows are not literally independent of each other, since they will interact via the exchange of energy by radiation and conduction and the exchange of matter by condensation and evaporation (Meyer, Liu, & Meyer-Hofmeister, 2007).
In Main et al. (1999) and Smith, Heindl & Swank (2002b) we discussed the hysteresis we found in the hard-state persistent systems 1E 1740.7–2942 and GRS 1758–258 in terms of this two-flow picture. The spectrum, consisting entirely of the inverse-Comptonized hard power law, was softest just before and during the decline of the count rate. We postulated that the inner thin disk continued to exist beneath the Comptonizing corona; thus the total number of photons observed (all in the power-law component) was taken as equivalent to the number of thermal seed x-rays generated in the standard thin disk. Recent spectral analysis of the hard state in GX 339–4 and Cyg X–1 (Miller et al., 2006) lends strong support to this picture of a hard state with no truncation of the thin disk, at least in some cases.
We interpreted the hysteresis between the observed parameters (power law index and count rate) as indicating that the material in the Comptonizing corona drops just before the underlying thin disk begins to decline. This might be expected from a drop in a “master” accretion rate that feeds both components in a fixed ratio. The hysteresis is the natural effect of the sub-Keplerian corona responding faster than the Keplerian disk (Chakrabarti and Titarchuk, 1995). The period of soft emission in which the sub-Keplerian material has accreted away and the thin disk is still slowly dropping, we call a “dynamical soft state,” with the transition of GRS 1758–258 in 2001 as the canonical example (Smith et al., 2001). The contrasting “static” soft state would occur when the accretion rate is high enough that the corona is unstable to collapse by bremsstrahlung cooling. This has never been observed in 1E 1740.7–2942 or GRS 1758–258, which stay well below 10% of the Eddington luminosity for a black hole.
Since the thermal blackbody emission is clearly visible throughout all our data from LMC X–3, and since it also seems that the disk geometry isn’t changing (Figure 2), the interpretation here is more direct than for the hard-state systems: the directly-measured thermal flux is now the proxy for the accretion rate in the inner disk, while the percentage of the total flux that is in the power-law tail is the proxy for the amount of material in the inner corona (see above). The power-law flux, rather than the power-law index, is used since the corona is now very optically thin rather than marginally optically thick as it is in the hard state.
Figure 4 then suggests that the coronal density is high while the thin disk is decreasing, and at its minimum. If our interpretation of the hard-state systems was correct, then, the new soft-state data from LMC X–3 are showing a very different effect in the underlying accretion flows: rather than the “master” accretion rate rising and falling together for both flows, it may instead be temporarily diverted so as to favor the corona over the thin disk, “starving” the latter while the former is high.
4.2 Unification with other types of hysteresis
Previously, hysteresis has mostly been studied in the case of transient outbursts (called x-ray novae or soft x-ray transients) from black hole (Miyamoto et al., 1995) or neutron star (Maccarone & Coppi, 2003) binaries with low-mass companions. Are we now faced with three physically unrelated types of hysteresis, for hard persistent systems, soft persistent systems, and transients, all with similar timescales of days to weeks? Perhaps some unification is possible.
The hysteresis seen in the persistent hard-state systems, associated with either slight softenings or full transitions to the dynamical soft state, may operate the same way as the hard-to-soft transitions at the peak of x-ray novae. A recent study of this transition in many transients (Gierlinski & Newton, 2006) finds that they can be divided into two classes by the rate of the transition – those that make the transition quickly tend to do so at lower luminosity, and the transitions at highest luminosities tend to proceed slowly. Gierlinski & Newton (2006) refer to these as “dark/fast” and “bright/slow” transitions. They note that the dark/fast type can occur over a range of luminosities in the same binary (for example, GX 339–4). Comparison to our results for hard-to-soft transitions in 1E 1740.7–2942 and GRS 1758–258 suggests that the dark/fast transitions can be identified with our dynamical soft state, and the bright/slow transitions with what we called the static soft state.
The increases in the power-law tail in the soft state of LMC X–3, interpreted as partial transitions toward the hard state, may be related to the soft-to-hard transitions at the end of x-ray nova outbursts (Kalemci et al., 2004). Maccarone (2003) studied the soft-to-hard transitions in a large sample of black-hole and neutron-star transients, and found that they generally occur between 1% and 4% of Eddington luminosity. The lowest luminosities in Figure 2, corresponding to the periods with the hardest overall spectrum, occur around 1erg cm-2s-1. Assuming a distance of 50 kpc and a black-hole mass of 5 solar masses for LMC X–3, this corresponds to about 1% of Eddington luminosity, suggesting that these partial transitions – as well as the complete ones seen by Wilms et al. (2001) – could be analogous to the transitions in the tails of the transients.
4.3 Other models of hysteresis
A number of other physical models have been presented to explain the hysteresis effect in transients.
Watanabe & Fukue (1996) described the effect of radiation drag on the coronal flow. In this picture, hot coronal gas is affected by two radiation fields: strong radiation from the compact object (in our case, substitute the innermost portion of the disk) and local radiation from the nearby part of the thin disk. The former tends to cause the coronal gas to fall in and accrete, while the latter tends to keep it in place. As changes in accretion rate propagate through the thin disk, it will go through states with a different ratio of luminosities in the inner and outer parts. When the inner disk is more luminous than the outer, most of the corona will flow inwards while it evaporates, while in the opposite case there will be more corona remaining above the disk at all radii. Here, although the coronal density cannot be determined entirely by the local conditions in the thin disk, it is determined entirely by the state of the whole thin disk, which is out of viscous equilibrium. The radiation drag picture can still show hysteresis even without independently specifying input accretion rates for the two flows, and thus has the potential of explaining hysteresis phenomena with fewer free parameters.
Meyer-Hofmeister, Liu, & Meyer (2005) and Liu, Meyer, & Meyer-Hofmeister (2005) discuss the effect of irradiation on heating and cooling of the corona, rather than drag. The x-rays from the innermost part of the flow affect the corona further out. In the hard state, the hard radiation heats the corona at larger radii, encouraging it to remain in the hard state during the rise of a transient. In the soft state, the soft radiation cools the corona as it tries to reform during the outburst decay; the soft state thus helps to perpetuate itself down to lower luminosities.
Machida, Nakamura, & Matsumoto (2006) describe a mechanism in which magnetic pressure can forestall the bremsstrahlung-cooling instability by which a sub-Keplerian, optically thick flow collapses into an optically thick disk. They thus explain why the hard state can be maintained to high luminosities in the rise phase of a transient. Our new results for LMC X–3 probably require another explanation, however, since the system never leaves the soft state.
Most recently, Meyer, Liu, & Meyer-Hofmeister (2007) discussed the hysteresis in transient outbursts in terms of evaporation and condensation of the inner part of the thin disk. In this picture, the extension of the soft state to low luminosities in transients during the decline of the outburst is due to re-condensation to a thin disk at small radii, even when the flow is purely advection-dominated at intermediate radii. Meyer, Liu, & Meyer-Hofmeister (2007) suggest that the reason Cyg X–1 shows no hysteresis is that the innermost recondensation disk never entirely disappears, even in the hard state, since the accretion rate never gets very small. Our current result poses a challenge to this model: from Figure 2, it is clear that the inner disk exists down to the last stable orbit throughout our data set, yet there is a strongly hysteretic behavior still present.
Maccarone & Coppi (2003) also suggested that the lack of hysteresis in Cyg X–1 is due to the relatively small changes in luminosity accompanying state transitions. However, our earliest results on hard-state hysteresis (Main et al., 1999) seem to be at odds with that conclusion, since on those occasions 1E 1740.7–2942 and GRS 1758–258 showed hysteresis during very minor changes in luminosity (less than a factor of two). We continue to suggest that the size and viscous timescale of the disk, expected to be very small for a wind accretor, is the relevant parameter that distinguishes Cyg X–1 from the other systems.
References
- Arnaud (1996) Arnaud, K. A. 1996, ASP Conf. Proc. 101, Astronomical Data Analysis Software and Systems V, ed. G. Jacoby & J. Barnes (San Francisco: ASP), 17
- Chakrabarti and Titarchuk (1995) Chakrabarti, S. K. & Titarchuk, L. G. 1995, ApJ, 455, 623
- Chakrabarti (1997) Chakrabarti, S. K. 1997, ApJ 484, 313
- Cowley et al. (1995) Cowley, A. P., Schmidtke, P. C., Anderson, A. L., and McGrath, T. K. 1995, PASP 107, 145
- Ebisawa et al. (1993) Ebisawa, K. et al. 1993, ApJ, 403, 684
- Frank, King & Raine (2002) Frank, J., King, A., & Raine, D. 2002, Accretion Power in Astrophysics, 3rd ed. (Cambridge)
- Gierlinski & Newton (2006) Gierlinski, M., and Newton, J. 2006, MNRAS, 370, 837
- Gies & Bolton (1986) Gies, D. R. and Bolton, C. T. 1986, ApJ 304, 371
- Homan et al. (2001) Homan, J. et al. 2001, ApJS 132, 377
- Kalemci et al. (2004) Kalemci, E., Tomsick, J. A., Rothschild, R. E., Pottschmidt, K., and Kaaret, P. 2004, ApJ, 603, 231
- Liu, Meyer, & Meyer-Hofmeister (2005) Liu, B. F., Meyer, F., and Meyer-Hofmeister, E. (2005), A&A 442, 555
- Maccarone (2003) Maccarone, T. J. 2003, A&A, 409, 697
- Maccarone & Coppi (2003) Maccarone, T. J. and Coppi, P. S. 2003, MNRAS 338, 189
- Machida, Nakamura, & Matsumoto (2006) Machida, M., Nakamura, K. E. and Matsumoto, R. 2006, PASJ 58, 193
- Main et al. (1999) Main, D. S., Smith, D. M., Heindl, W. A., Swank, J., Leventhal, M., Mirabel, I. F., & Rodríguez, L. F. 1999, ApJ, 525, 901
- Martí et al. (1998) Martí, J., Mereghetti, S., Chaty, S., Mirabel, I. F., Goldoni, P., and Rodríguez, L. F. 1998, A&A 338, 95
- Merloni, Fabian & Ross (2000) Merloni, A., Fabian, A. C., and Ross, R. R. 2000, MNRAS, 313, 193
- Meyer-Hofmeister, Liu, & Meyer (2005) Meyer-Hofmeister, E., Liu, B. F., and Meyer, F. (2005), A&A 432, 181
- Meyer, Liu, & Meyer-Hofmeister (2007) Meyer, F., Liu, B. F., and Meyer-Hofmeister, E. (2007), A&A 463, 1
- Miller et al. (2006) Miller, J. M., et al. (2006), ApJ 653, 525
- Mitsuda et al. (1984) Mitsuda, K., et al. 1984, PASJ 36, 741
- Miyamoto et al. (1995) Miyamoto, S., Kitamoto, S., Hayashida, K., and Egoshi, W. 1995, ApJL, 442, L13
- Nowak et al. (2001) Nowak, M. A., Wilms, J., Heindl, W. A., Pottschmidt, K., Dove, J. B., and Begelman, M. C. 2001, MNRAS 320, 316
- Page et al. (2003) Page, M. J., Soria, R., Wu, K., Mason, K. O., Cordova, F. A., and Priedhorsky, W. C. 2003, MNRAS 345, 639
- Pottschmidt et al. (2003) Pottschmidt, K. et al. 2003, A&A 407, 1039
- Pottschmidt et al. (2006) Pottschmidt, K., Chernyakova, M., Zdziarski, A. A., Lubiński, P., Smith, D. M., and Bezayiff, N. 2006, A&A 452, 285
- Rothstein et al. (2002) Rothstein, D. M., Eikenberry, S. S., Chatterjee, S., Egami, E., Djorgovski, S. G., and Heindl, W. A. 2002, ApJ 580, 61
- Smith et al. (2001) Smith, D. M., Heindl, W. A., Markwardt, C. B., & Swank, J. H. 2001, ApJL 554, L41
- Smith, Heindl & Swank (2002a) Smith, D. M., Heindl, W. A., & Swank, J. H. 2002a, ApJ 578, 129
- Smith, Heindl & Swank (2002b) Smith, D. M., Heindl, W. A., & Swank, J. H. 2002b, ApJ 569, 362
- Titarchuk & Shaposhnikov (2005) Titarchuk, L, and Shaposhnikov, N. 2005, ApJ 626, 298
- Warren & Penfold (1975) Warren, P. R. and Penfold, J. E. 1975, MNRAS 172, 41
- Watanabe & Fukue (1996) Watanabe, Y., & Fukue, J. 1996, PASJ 48, 841
- Wilms et al. (2001) Wilms, J., Nowak, M. A., Pottschmidt, K., Heindl, W. A., Dove, J. B., and Begelman, M. C. 2001, MNRAS 320, 327