The Continuing Saga of the Explosive Event(s) in the M87 Jet: Is M87 a Blazar?
Abstract
We review the recent data on the knot HST-1 in the M87 jet in the context of typical blazar behavior. In particular we discuss the wide-band flare of 2005 which peaked at a factor of 50 to 80 times the intensity observed in 2000; the superluminal radio features; and the arguments that support the hypothesis that HST-1 was the source of the excess TeV emission found by H.E.S.S. in 2005. To the extent that M87 can be classified as a blazar, perhaps observed at a somewhat larger angle to the line of sight compared to most blazars, all of these blazar properties originate at a distance greater than 100 pc from the nucleus, and thus cannot be associated with the location of the ’launching of the jet’.
SAO, 60 Garden St. Cambridge, MA 02138
KIPAC, Stanford University, Stanford CA 94305
STScI, 3700 San Martin Drive, Baltimore, MD 21218
Florida Institute of Technology, 150 West University Boulevard, Melbourne, FL 32901
Astronomy Dept., University of Maryland, College Park, MD 20742
1. Introduction
1.1. Preamble
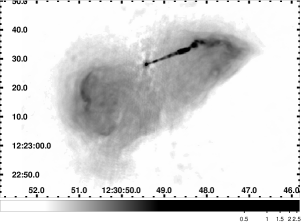
As a reminder: when viewing a radio image (fig. 1) of a non-thermal source, we think we see a (distorted) view of an emitting volume containing relativistic electrons and magnetic fields.
-
•
the morphology is distorted by projection effects & relativistic aberration
-
•
the intensity is distorted by relativistic beaming
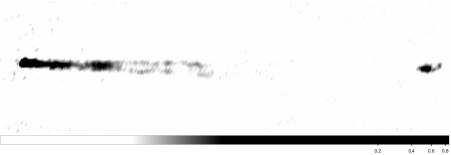
However, when viewing an X-ray image (fig. 2) of an FRI jet which is believed to also represent synchrotron emission (Harris & Krawczynski 2006), in addition to the same attributes as the radio, all emission regions are also acceleration regions: i.e. high energy electrons are being produced throughout the emitting volumes.
1.2. History
The initial description of X-ray variability in the M87 jet was published in Harris et al. (2003). This was followed by Perlman et al. (2003) on the corresponding optical variability. The major flare of HST-1 was described in Harris et al. (2006) and the VLBA results on HST-1 were published in Cheung, Harris, and Stawarz (2007).
1.3. This paper
In this contribution we review the evidence that M87 resembles a blazar. The basic argument hinges on 3 attributes: (1) the flaring behavior of the knot HST-1; (2) the superluminal proper motions found in HST-1; and (3) the probable association of enhanced TeV emission with HST-1. If M87 were to be much further away than it is, so that HST-1 would not be resolved from the nucleus, all of these phenomena would be interpreted as coming from the immediate vicinity of the super massive black hole (SMBH) rather than from a feature in the jet lying more than 100 pc from the SMBH. Insofar as we have found blazar behavior arising from a knot in the jet, it seems clear that the basic blazar paradigm needs substantial revision.
We first describe the X-ray lightcurves of the nucleus, HST-1, knot D & knot A; then the VLBA data on superluminal motions of components within HST-1; and finally, the TeV connection. We take the distance to M87 to be 16 Mpc so that 1′′=77pc.
2. X-ray Photometry and Light Curves
It is relatively straight forward to separate the core from HST-1 when there is no pileup (fig. 2) since we can remove pixel randomization and model the Point Spread Function (PSF). To first order we can also recover the energy of the piled events by weighting each event with its energy and summing 0.2-17 keV. We can also recover the events rejected in standard processing because of grade migration by using the evt1 file with no grade filtering.
The resulting lightcurves are shown in fig. 3 (left panel). In April 2005, HST-1 attained a peak intensity more than 50 times that observed in 2000 July. The nucleus is variable but does not display any sort of similar event. Knot A shows a slow decline, most likely caused by the buildup of contaminant of the ACIS detector: the ’light-bucket’ method of measuring the total charge (ev/s) does not incorporate the changing effective area (see Harris et al. 2006).
The major flare of HST-1 and its affect on the nucleus and knot D are shown in fig. 4 (left panel). Although the major hump in the light curve of the nucleus in early 2005 can be mostly smoothed out by subtracting 5% of HST-1, another effect, the ’bleeding’ from release of trapped charge at readout time causes a secondary enhancement to the side of the PSF away from the readout buffer. Since this asymmetric effect changes location on the sky with the roll angle of the satellite, during an M87 observing year (Nov-Aug) it contaminates first the nucleus and then knot D. The end of March is when the readout direction is perpendicular to the jet so that is the separation date and explains the offsets between the contaminated lightcurves of the nucleus and knot D compared to HST-1.
Other losses which are difficult to correct include ’eat-thy-neighbor’ (a photon from the nucleus falls within the 3x3 pixel region of one from HST-1 during the same frame time), on-board rejection of some grades, and when part of the charge of piled events falls outside the 3x3 pixel region.
The only recourse to estimate these losses is readout streak photometry. Although this entails poor s/n since the effective background is high and the effective exposure is short, in fig. 4 (right panel) we show that the true peak of HST-1 is significantly higher than what we had thought.
3. Superluminal proper motions in HST-1
We started monitoring the M87 jet with the VLA111The National Radio Astronomy Observatory is a facility of the National Science Foundation operated under cooperative agreement by Associated Universities, Inc. in 2003 at 8 GHz and higher in the A and B configurations which provide sufficient angular resolution to separate HST-1 from the nucleus. To avoid data gaps when the VLA is in C & D arrays, we started VLBA monitoring in 2005, primarily at 1.6 GHz. The resulting lightcurves for HST-1 are shown in fig. 3 (right panel), where it can be seen that the X-ray flare was roughly duplicated in the radio band (the optical lightcurve is similar).
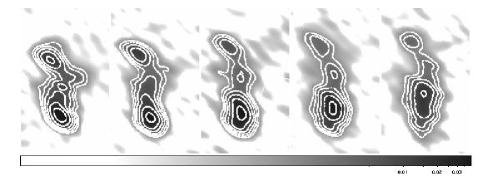
The inner (VLBA) jet is not known to be superluminal and we did not detect any obvious motion although the jet has a quasi-continuous structure and it is difficult to identify distinct components. Instead of an unresolved structure for HST-1, the VLBA data revealed a complex radio structure and superluminal proper motions with values up to 4c. Details are given in Cheung et al. (2007) and we show a synopsis in fig. 5. Extrapolating the observed motions back in time suggests that the various features originated from the upstream (quasi-stationary) end of HST-1 in the 2001-2002 time frame. The obvious conclusion is that the major intensity flare of HST-1 is closely associated with the ’launching’ of super-luminal radio components from a ’favored location’ (the upstream end of HST-1); see Stawarz et al. (2006) for a discussion of possible reasons as to why HST-1 occurs at this location in the jet.
4. The TeV connection
The H.E.S.S. group reported a higher -ray flux in 2005 than in adjoining years (Aharonian et al. 2006). They argued that because of rapid variability, the likely origin of the TeV emission was the nucleus (i.e. close to the SMBH).
As discussed in Cheung et al. (2007) the evidence that the TeV excess emission originated in HST-1 rather than from the nuclear region includes:
-
•
The X-ray emission for HST-1 peaked at the same time as the TeV high state.
-
•
Inverse Compton emission is a mandatory process in any relativistic plasma. Both starlight and the synchrotron spectrum peak near 1014 Hz and thus TeV emission is expected from electrons of Lorentz factor 106 (known to exist because of the observed synchrotron UV to X-ray emission). The expected intensity is approximately what was observed.
-
•
The IC and synchrotron spectral indices have similar values.
-
•
The photon-photon opacity for TeV photons of the alternate location near the SMBH is much greater than 1.
In principle, we might expect to determine the origin of the TeV emission from a detailed comparison of the light curves of different components. The data are ambiguous because of the contamination suffered by the nucleus and by the gap in our Chandra coverage during most of the H.E.S.S. fast variability. In fig. 6 we show the relevant lightcurves for the interval of interest in 2005.

5. Summary
In general, once we find something unique like the first pulsar, we then find many more and are able to study the class of such objects. In the case of M87, it seems to us there are two possibilities.
Either the blazar-like behavior of HST-1 is unique and we now have to search for similar events in other jets (nothing like this has so far been detected in the Cen A jet, despite many observations over many years), or M87 is a blazar and the current paradigm for blazar emission should be modified to divorce any reliance on the notion that blazar characteristics are intimately associated with close proximity to the SMBH.
Neither of these options is supported by the failure to detect offsets between the purported nucleus of blazars and the origin of superluminal radio components, despite a large accumulation of VLBA data on quasars and blazars (e.g. the MOJAVE project).
Acknowledgments.
We thank K. Kellermann and M. Lister for comments on VLBA observations of blazars and acknowledge cooperative involvement with S. Wagner, D. Horns (HESS); V. Vassiliev, H. Krawczynski, R. Mukerjee (VERITAS); K. Mannheim and T. Bretz (MAGIC). We also thank the Chandra Director’s Office for approving a target of opportunity proposal that allowed us to get several observations of M87 in 2007 February and March dark times when the TeV systems were observing M87. These data are included in the lightcurves presented here, but a detailed analysis is still underway. This work was partially supported by NASA grants GO5-6118X, GO6-7112X, and GO7-8119X.
References
- Aharonian et al. (2006) Aharonian, F., et al. (H.E.S.S. collaboration). 2006, Science, 314, 1424
- Cheung et al. (2007) Cheung, C.C., Harris, D.E., & Stawarz, Ł. 2007, ApJL, 663, L65
- Harris et al. (2003) Harris, D. E. et al. 2003, ApJ, 586, L41
- Harris et al. (2006) Harris, D. E., et al. 2006, ApJ, 640, 211
- Harris & Krawczynski (2006) Harris, D. E. & Krawczynski, H. 2006, ARAA 44, 463
- Perlman et al. (2003) Perlman, E. S., et al. 2003, ApJ599, L65
- Stawarz et al. (2006) Stawarz, Ł., et al. 2006, MNRAS, 370, 981