Spitzer observations of V4332 Sagittarii: Detection of Alumina Dust
Abstract
We present broad-band 24, 70 and 160 photometry, 5-35 and 55-90 spectra of the eruptive variable V4332 Sgr from Spitzer observations. The distinguishing feature of the 5-35 spectrum is an unusually broad absorption feature near at the position generally associated with silicate-rich dust. Through radiative transfer modeling, we show that this broad feature cannot arise from silicates alone but requires the inclusion of alumina (Al2O3) as a dust condensate. The case for including Al2O3 is strengthened further by the presence of the AlO radical, a potentially important molecule in forming Al2O3. The present detection indicates that porous alumina manifests itself through a broadening of the 9.7 silicate feature and additionally displays, on the shoulder of the silicate feature, a component at . We discuss how further observations of V4332 Sgr may have the potential of verifying some general predictions of the dust condensation process.
Subject headings:
infrared: stars-novae, cataclysmic variables - stars: individual (V4332 Sagittarii)1. Introduction
Alumina (Al2O3) is considered to play a significant role in dust formation around oxygen-rich cool stars. Thermodynamic equilibrium calculations indicate that it, along with titanium oxides, is one of the earliest condensates in the mineralogical condensation sequence (Tielens, 1990; Gail & Sedlmayr, 1999). Observationally, there is some debate and uncertainty regarding the spectral signatures that can be ascribed to alumina that permit a firm conclusion to be drawn for the presence of alumina. In particular features at 11.3 and 13 , seen in the spectra of O-rich AGB and supergiant stars have often been attributed to alumina (e.g., Speck et al., 2000, and references therein). Additionally, various authors have shown that the inclusion of alumina grains in dust models yields better fits to the observed profile of the silicate feature at 9.7 (especially when the feature is broad) and also reproduces better the overall infrared spectral energy distribution (SED) in selected AGB and OH/IR stars (Speck et al., 2000; Maldoni et al., 2005; DePew et al., 2006). In this paper, we present evidence for alumina dust detection from Spitzer Space Telescope observations of the nova-like variable V4332 Sgr. The distinguishing feature of its mid/far IR spectrum is a deep, unusually broad absorption feature at 10 . We show that this feature cannot be reproduced by silicate dust alone and that it is necessary to invoke the presence of amorphous alumina grains to explain it.
V4332 Sgr erupted in 1994 in what was initially considered a nova-like outburst (Martini et al., 1999). However, its subsequent post-outburst evolution to a cool spectral type indicated that this was not a classical nova eruption. The exact nature of V4332 Sgr is of considerable interest as it, along with V838 Mon and M31 RV (a red-variable which erupted in M31 in 1988), may form a new class of eruptive objects (e.g. Munari et al., 2002; Bond et al., 2003). V4332 Sgr shows an intriguing emission-line spectrum in the optical and near-infrared with several rare spectral features. Prominent molecular bands of TiO, ScO, VO and AlO are also seen in the optical (Tylenda et al., 2005; Kimeswenger, 2006) implying an oxygen rich environment. The fundamental band of 12CO at 4.67 has also been detected in the source along with water ice at 3.05 (Banerjee et al., 2004). The IR excess detected in the source, along with the molecular and ice features, suggest a cool dusty environment around the central star whose effective temperature is estimated to be 3250-3280K (Banerjee et al., 2003; Tylenda et al., 2005).
2. Observations and Data reduction
V4332 Sgr was imaged with the Multiband Imaging Photometer for Spitzer (MIPS; Rieke et al., 2004) at 24 and 70 on 15 Oct 2005 and 2 Nov 2006 (70 Fine and Default modes, respectively). Data at 160 were obtained on 15 Oct 2005. Spectra were obtained using the Infrared Spectrograph on Spitzer (IRS; Houck et al., 2004) on 18 April 2005 and 19 April 2006. In 2005, low resolution (R 60-100) data from and high resolution data (R = 600) from were obtained. In 2006, high resolution data from and low resolution data from were obtained. In addition, MIPS SED mode data covering the wavelength range from were obtained on 27 Sept 2005. For the following discussion, data obtained in 2005 and 2006 will be referred to as epoch 1 and epoch 2, respectively.
The MIPS data were reduced using the Data Analysis Tool v3.06 (Gordon et al., 2005). V4332 Sgr was detected as a point source by MIPS at 24, 70, and 160 , and the flux densities were extracted using both PSF fitting and aperture photometry. The measured MIPS flux densities were 2.340.07, 1.070.11, and 0.120.02 Jy at 24, 70, and 160 respectively. At 24 and 70 the flux densities measured in Epochs 1 and 2 were identical within the errors and we report the weighted mean of those measurements. The basic instrumental calibration of the MIPS SED mode is similar to that of the 70 imaging mode (Gordon et al., 2007) but with a wavelength-dependent illumination correction. The final spectrum of the source is obtained by extracting a 5-column (4925) aperture from the sky subtracted 2-D spectrum after correcting for slit losses. The MIPS SED data were scaled by a factor of 0.88 to match the flux density in the 70 bandpass. Details of the SED reduction can be found in Lu et al. (2007, in prep.).
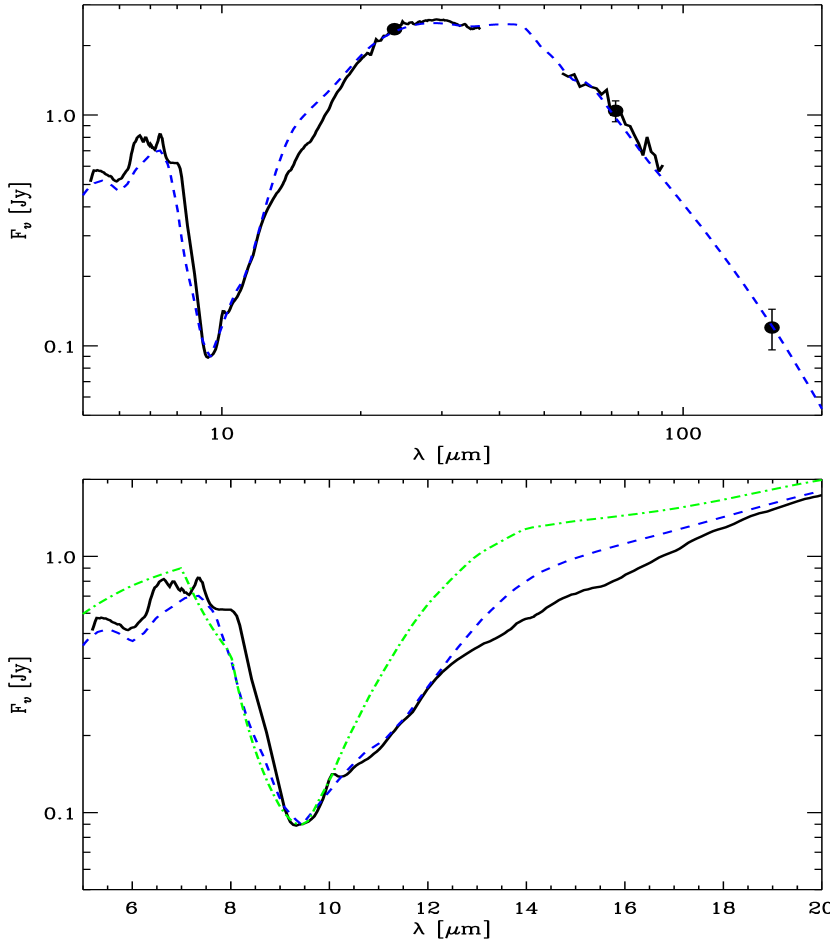
The IRS data were processed and extracted using the Spitzer Science Center (SSC) Pipeline S15.3 product. Since V4332 Sgr is a bright point source, the final spectrum of the low resolution modules were combined using the SSC post-BCD co-added, nod-subtracted spectra. No background observation was obtained for the high resolution modules and the background level for the epoch 1 observations was 0.06 Jy (a factor of 20 fainter than the source) at 20 and fairly uniform in the co-added 2-D low resolution spectra. The SSC post-BCD extraction of the high-resolution spectrum agrees with the low-resolution spectrum within the uncertainties. There is no obvious emission/absorption lines seen in the high-resolution spectrum; therefore, the final spectra of V4332 Sgr in epochs 1 and 2 are computed by averaging both low- and high-resolution modules. In Figure 1, we present the observed IRS and MIPS SED spectra of V4332 Sgr and the combined broad band MIPS fluxes at 24, 70 and 160 . Since there is little apparent evolution between the epoch 1 and 2 broad band fluxes, we show only the epoch 1 data in Figure 1. Evidence for changes in the detailed shape of the SED between epochs will be examined below.
3. Results
The spectrum of V4332 Sgr is dominated by a deep, broad feature at , normally associated with the presence of amorphous Mg-Fe silicate grains. However, this observed feature is relatively broad, with an additional feature at and a flattened wing beyond . Additionally, signatures of ices and organic materials are evident from (water ice at 6 , “organics” at 6.8 and possibly methane ice at 7.7 ; see e.g. Bowey & Hofmeister 2005). We have modeled the V4332 Sgr spectrum using the radiation transfer code DUSTY (Ivezic, Nenkova, & Elitzur, 1999). The limitations of DUSTY include the assumption of a spherically symmetric shell of material which may not be appropriate for V4332 Sgr as the system may have a disk (Banerjee et al., 2004). However since we are interested in exploring the overall shape of the observed SED rather than providing a detailed physical model of the complete system, we have restricted ourselves to the simplest and most generalized assumptions in our calculations. As the luminosity of V4332 Sgr is poorly known, we have fixed the stellar luminosity for V4332 Sgr at 104 L⊙, the default input value assumed by DUSTY. This assumption does not affect the shape of the computed spectrum, only the physical scale of the system when combined with the dust temperature at the inner radius of the shell. We have fit the observed SED with two models viz. model 1 that contains silicate dust only and model 2 with a mixture of silicate and alumina dust, where the inclusion of alumina is prompted by the presence of a feature at often attributed to amorphous alumina (Speck et al., 2000; DePew et al., 2006). Prompted by the presence of ice absorption at , the grains in both models are coated with an ice mantle (20% by volume). The silicate dust optical constants are from Draine & Lee (1984) while the alumina optical data used are from Begemann et al. (1997). Corundum was not included in our model as there is no evidence in our spectra for the feature at 13 associated with the presence of this mineral (DePew et al., 2006). We tested both the ’porous’ and ’compact’ alumina samples of Begemann et al. (1997); as there was no substantive differences between the models, we restricted ourselves to the ’porous’ sample for the subsequent modeling. The ice optical constants are those of Wiscombe (ftp://climate1.gsfc.nasa.gov/wiscombe/). The range of parameters explored is given in Table 1. The output spectra computed using both dust models are shown in Figure 1. It is clearly seen that a pure silicate composition matches the observed 10 feature poorly. On the other hand, the inclusion of alumina in model 2 improves the fit significantly. While there is considerable degeneracy in the fits, especially between the optical depth and the dust temperature (low temperature, low optical depth models are somewhat degenerate with high temperature, high optical depth models, though they consistently yield formally worse fits), it is notable that no model consisting of only silicate grains provided a satisfactory fit to the 10 absorption feature. While model 2 provides a good fit overall fit to the SED and the 10 feature from 9–12.5 , it reproduces neither the flattening beyond 13 , nor the relatively narrow blue wing. We explored using different silicate optical constants (e.g. Ossenkopf et al., 1992) as well as varying the size distribution ( and ) but neither approach improved the fit in these spectral regions. It is possible that a more complex geometry than the simple spherical shell utilized in DUSTY could improve the fit in these regions.
| Parameter | Value | Best Fit |
|---|---|---|
| Stellar Luminosity | L☉ | fixed |
| Stellar Temperature | 3250 K11Banerjee et al. 2003. | fixed |
| 100022Maldoni et al. 2005. | fixed | |
| Shell Distribution | fixed | |
| Composition | silicates/alumina | 65%/35% |
| (fraction by number) | ||
| 2 – 55 | 45 | |
| ) | 300 – 1750 K | 1750 K |
| Grain Size Distribution | MRN33Mathis et al. 1977; with , . | fixed |
The plots in Figure 1 permit a few conclusions to be drawn: (i) the substantial improvement in the fits to the broad 10 feature with the inclusion of alumina indicates that alumina is being detected in the source and its presence is manifested by a broadening of the 9.7 silicate feature. A similar conclusion was reached by Speck et al. (2000) using data extending to 13.5 . (ii) A small, yet clearly discernible, feature is seen at 11 . This feature is attributable to alumina since our model calculations show that increasing the percentage of alumina in the alumina-silicate mixture of model 2 enhances the strength of this feature. We note that this 11 feature is seen in a significant number of stars studied by Speck et al. (2000) implying that alumina grains are fairly prevalent.
4. Discussion
4.1. The Case for Alumina Condensation
It is perhaps not surprising to see evidence for alumina in the dust surrounding V4332 Sgr given the presence of the AlO radical in its optical and NIR spectra (Banerjee et al., 2003; Tylenda et al., 2005; Kimeswenger, 2006) and since AlO can play a critical role in the production of alumina. Laboratory experiments by Demyk et al. (2004) show that aluminum oxide clusters with stoichiometry AlO-(Al2O3)n are readily formed in laser vaporized metallic Al when quenched in oxygen and argon. These clusters are found to be very stable and thus very good nucleation sites for dust growth. Additionally, Belyung & Fontijn (1995) studied the kinetics of AlO + O2 reactions at temperatures in the range 300-1700K with a view to studying the fate of aluminum in combustion. The higher end of this temperature range, it may be noted, is very close to the predicted condensation temperature (1760K; Tielens, 1990) of alumina dust around stars. The Belyung & Fontijn (1995) experiment shows that AlO becomes oxidized to AlO2 by O2. An additional reaction involving AlO is AlO + O +M = AlO2 + M, where the “chaperon”, M, is any atom or molecule present that can remove some energy from the newly-formed, activated AlO2 (A. Fontijn, private communication). Newly formed AlO2 can further interact with AlO to generate alumina: AlO + AlO2 + M = Al2O3 + M.
These results suggest that AlO is likely to play a significant role in the route to Al2O3 formation. This conclusion has theoretical support in the work of Gail & Sedlmayr (1999) who show that any possible nucleation species that can go on to form dust around stars should begin with a monomer with exceptionally high bond energy. The AlO monomer satisfies this criterion and is thus a favored candidate to lead to the formation of larger AlmOn clusters that serve as nucleation sites for the formation of other grains or to alumina grains themselves by homogeneous nucleation. While the Gail & Sedlmayr (1999) analysis is based on thermal equilibrium considerations, an alternative model is the non-equilibrium formation of chaotic silicates proposed by Stencel et al. (1990) and Nuth & Hecht (1990). Chaotic silicates form rapidly from a supersaturated vapor of metal atoms, SiO, AlO and OH in a hydrogen atmosphere (Stencel et al., 1990). In the initial stages, the higher reduction of Al with respect to Si will lead to the preferential formation of Al-O bonds at the expense of Si-O bonds. This implies that the IR bands of alumina associated with the Al-O stretching mode should be prominent early in the formation of the chaotic silicates. However, as the Al atoms become fully oxidized, the higher abundance of Si will make the 9.7m band associated with Si-O bonds dominate.
Titanium oxides are considered to also be an early dust condensate along with alumina. Given that the dust that has formed around V4332 Sgr is of fairly recent origin as implied by the abrupt infrared brightening that developed in the source between 2MASS observations in 1998 and subsequent observations in 2003 (Banerjee et al., 2003), we might expect some signature of these species in the spectra, though Ti is nearly 30 times less abundant than Al (Speck et al., 2000). Bulk titanium oxides can have different forms: TiO, TiO2, Ti2O3 and Ti3O5 (Demyk et al., 2004). The most common, TiO2 can exist as brookite and anatase which convert at high temperature into rutile which is the third and most common form. The rutile spectrum is expected to show a broad and strong band at 13-17 ; the spectrum of anatase shows two strong and broad bands around 17 and 29 . The titanium oxide clusters, studied by Demyk et al. (2004) as possible nucleation sites, have a vibrational transition at 13.5 . The above discussion pertains mostly to crystalline forms of titanium oxides while in V4332 Sgr the amorphous form may more likely be present given that both the silicates and alumina are of amorphous nature. But a reasonable possibility exists that the flattening of the absorption band longward of 13.5 is indicating the presence of titanium oxides.
4.2. Evolution of the Dust Condensates
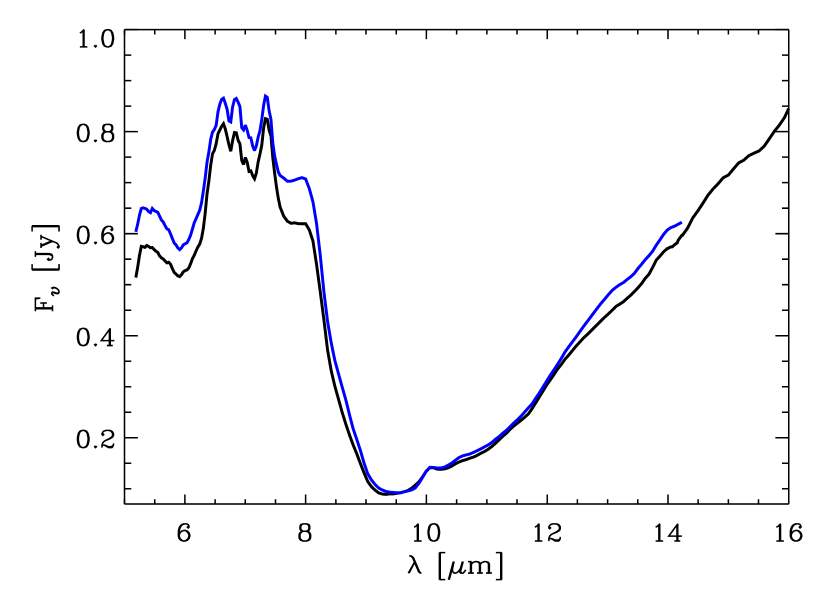
There is potential in the present data to address certain aspects of the dust condensation process in astrophysical environments. Since the dust formation process in V4332 Sgr has begun recently - certainly less than 10 years ago - and is possibly still ongoing, there are a few spectral features that could change with time. As an example, in the “chaotic silicates” hypothesis, it is predicted that a strengthening of the silicate component of the 9.7 feature should take place relative to that of the alumina and other early condensate components that blend with this feature. There is observational support for such evolution comparing our data between epochs 1 and 2 (see Fig 2). There is a hint that the broad red wing of 9.7 feature has weakened in epoch 2 relative to epoch 1 and that there has been an overall narrowing of the 10 absorption complex. Although the evidence is tentative given the small change () and only two epochs of data, such a behavior might be expected as Al and Ti atoms become oxidized and Si-O begins to dominate the composition. Further, it is also predicted that the ratio of the 10 /18 silicate features could be expected to change monotonically as silicate dust nucleates and anneals in a circumstellar environment (Nuth & Hecht, 1990). Freshly nucleated silicates, as laboratory experiments show, are expected to have a large 10 /18 ratio i.e. the 18 feature is expected to be weak (consistent with what is seen in the V4332 Sgr spectrum). Thermal processing should increase the strength of the 18 feature. Although the time scales involved in the above processes are not clear, it would be worthwhile to monitor the spectrum of V4332 Sgr in the future to discriminate between possible scenarios for the evolution of dust condensates (Dijkstra et al. 2005 and references therein).
The detection of alumina condensate in V4332 Sgr may have implications for the origin of this object. It has been postulated that, along with V838 Mon and M31 RV, V4332 Sgr forms a new class of eruptive variables. The nature of these objects and the source of their eruptive behavior has not been established and ideas ranging from an outburst from a compact object in a red giant envelope, various thermonuclear events in a single high-mass evolved star, a late He-shell flash, stellar mergers and even the swallowing of multiple planets by a massive star have been proposed (e.g. Tylenda & Soker, 2006, and references therein). Within the scope of this work, it is not possible to discuss in depth the complexities of the origin and nature of the V4332 Sgr system. To date, alumina dust has been almost exclusively detected in AGB and other cool evolved stars and, as discussed above, is likely a very early condensate in any oxygen rich environment, so the detection of alumina in the early condensate of V4332 Sgr indicates that conditions in the ejecta are similar to those found around cool evolved stars. Thus the detection of alumina in V4332 Sgr may provide a constaint on the nature of the eruption if more detailed modeling of some of the proposed eruption mechanisms rules out conditions conducive to the formation of alumina grains. In addition, the detection of alumina around V4332 Sgr motivates long-term monitoring of the ejecta formed around V838 Mon (Banerjee et al., 2006). If indeed these objects are related at a more fundamental level than simply having roughly similar outburst characteristics, we might expect that the conditions in the post outburst ejecta of V838 Mon to be similar to those in V4332 Sgr. Given that V838 Mon erupted 8 years after V4332 Sgr and exhibits AlO lines in its spectrum (Lynch et al., 2004), we might detect similar signatures of alumina formation around V838 Mon in the coming years if both objects do indeed share a common origin.
References
- Banerjee et al. (2003) Banerjee, D. P. K., Varricatt, W. P., Ashok, N. M., & Launila, O. 2003, ApJ, 598, L31
- Banerjee et al. (2004) Banerjee, D. P. K., Varricatt, W. P., & Ashok, N. M. 2004, ApJ, 615, L53
- Banerjee et al. (2006) Banerjee, D. P. K., Su, K. Y. L., Misselt, K. A., & Ashok, N. M. 2006, ApJ, 644, L57
- Begemann et al. (1997) Begemann, B., Dorschner, J., Henning, T., Mutschke, H., Guertler, J., Koempe, C., & Nass, R. 1997, ApJ, 476, 199
- Belyung & Fontijn (1995) Belyung, D.P., Fontijn, A. 1995, J. Phys. Chem., 99, 12225
- Bond et al. (2003) Bond, H. E., et al. 2003, Nature, 422, 405
- Bowey & Hofmeister (2005) Bowey, J. E., & Hofmeister, A. M. 2005, MNRAS, 358, 1383
- Demyk et al. (2004) Demyk, K., van Heijnsbergen, D., von Helden, G., & Meijer, G. 2004, A&A, 420, 547
- DePew et al. (2006) DePew, K., Speck, A., & Dijkstra, C. 2006, ApJ, 640, 971
- Dijkstra et al. (2005) Dijkstra, C., Speck, A.K., Reid, R.B., & Abraham, P. 2005, ApJ, 633, L133
- Draine & Lee (1984) Draine, B. T., & Lee, H. M. 1984, ApJ, 285, 89
- Gail & Sedlmayr (1999) Gail, H.-P., & Sedlmayr, E. 1999, A&A, 347, 594
- Gordon et al. (2005) Gordon, K. D., et al. 2005, PASP, 117, 503
- Gordon et al. (2007) Gordon, K. D., et al. 2007, ApJ, in press
- Houck et al. (2004) Houck, J. R., et al. 2004, ApJS, 154, 18
- Ivezic, Nenkova, & Elitzur (1999) Ivezic, Z., Nenkova, M., & Elitzur, M. 1999, ”User Manual for Dusty”, http://www.pa.uky.edu/ moshe/dusty
- Kimeswenger (2006) Kimeswenger, S. 2006, Astronomische Nachrichten, 327, 44
- Lynch et al. (2004) Lynch, D. K., et al. 2004, ApJ, 607, 460
- Mathis et al. (1977) Mathis, J. S., Rumpl, W., & Nordsieck, K. H. 1977, ApJ, 217, 425
- Maldoni et al. (2005) Maldoni, M. M., Ireland, T. R., Smith, R. G., & Robinson, G. 2005, MNRAS, 362, 872
- Martini et al. (1999) Martini, P., Wagner, R. M., Tomaney, A., Rich, R. M., della Valle, M., & Hauschildt, P. H. 1999, AJ, 118, 1034
- Munari et al. (2002) Munari, U., et al. 2002, A&A, 389, L51
- Nuth & Hecht (1990) Nuth, J. A., III, & Hecht, J. H. 1990, Ap&SS, 163, 79
- Ossenkopf et al. (1992) Ossenkopf, V., Henning, T., & Mathis, J. S. 1992, A&A, 261, 567
- Rieke et al. (2004) Rieke, G. H., et al. 2004, ApJS, 154, 25
- Speck et al. (2000) Speck, A. K., Barlow, M. J., Sylvester, R. J., & Hofmeister, A. M. 2000, A&AS, 146, 437
- Stencel et al. (1990) Stencel, R. E., Nuth, J. A., III, Little-Marenin, I. R., & Little, S. J. 1990, ApJ, 350, L45
- Tielens (1990) Tielens, A. G. G. M. 1990, ¿From Miras to Planetary Nebulae: Which Path for Stellar Evolution?, 186
- Tylenda et al. (2005) Tylenda, R., Crause, L. A., Górny, S. K., & Schmidt, M. R. 2005, A&A, 439, 651
- Tylenda & Soker (2006) Tylenda, R., & Soker, N. 2006, A&A, 451, 223