First Results on Double Beta Decay Modes of Cd, Te and Zn Isotopes with the COBRA Experiment
Abstract
Four 1 cm3 CdZnTe semiconductor detectors were operated in the Gran Sasso National Laboratory to explore the feasibility of such devices for double beta decay searches as proposed for the COBRA experiment. The research involved background studies accompanied by measurements of energy resolution performed at the surface. Energy resolutions sufficient to reduce the contribution of two-neutrino double beta decay events to a negligible level for a large scale experiment have already been achieved and further improvements are expected. Using activity measurements of contaminants in all construction materials a background model was developed with the help of Monte Carlo simulations and major background sources were identified. A total exposure of 4.34 kgdays of underground data has been accumulated allowing a search for neutrinoless double beta decay modes of seven isotopes found in CdZnTe. Half-life limits (90% C.L.) are presented for decays to ground and excited states. Four improved lower limits have been obtained, including zero neutrino double electron capture transitions of and to the ground state, which are years and years respectively.
I Introduction
In recent years, a range of neutrino oscillation experiments Fukuda et al. ; Ahmad et al. ; Eguchi et al.
have successfully proved that neutrinos are massive particles. Although such
experiments are sensitive to a mass-difference rather than absolute neutrino
mass, the data suggest a neutrino mass eigenstate of at least 50 meV. To further
probe the neutrino’s properties, it is necessary to look to other processes
such as neutrinoless double beta decay (), which violates lepton number by
two units; observation of this process would confirm the Majorana nature of the
neutrino and the rate of this rare decay is proportional to the absolute
neutrino mass scale. For recent reviews of double beta decay see
Refs. Zuber (2006) and Elliott and Engel (2004).
The COBRA experiment uses CdZnTe (CZT) semiconductors to search for Zuber (2001). CZT contains nine double beta emitters, five of which can decay
via double beta decay, i.e. emitting two electrons, and four of them via
either double electron capture, a combination of a positron emission with
electron capture or double positron emission. The study of the positron
and electron capture modes can be used for lepton number violating decay
searches on an equivalent level to , however the phase space for the
positron modes is strongly reduced, making them less sensitive. Nevertheless,
is has been shown that the positron/electron capture mixed modes have an
enhanced sensitivity to right-handed weak currents and thus can help to
disentangle the underlying physics mechanism of if
observed Hirsch et al. (1994). In addition, excited states transitions can be explored with
high efficiency and low background using coincidence techniques among the detectors.
These decays would allow an independent search for double beta decay searching for the
de-excitation photons together with the electron signal.
The main focus of the work described in this paper is the study of background
through measurements performed underground, and energy resolution studies
carried out in a surface laboratory. Optimisation of these quantities is vital
for a successful search for , because, in the background limited case, the
observable half-life depends on them with a square root behaviour. In addition,
half-life limits for seven double beta isotopes contained in natural CZT have
been determined from data collected with a small prototype detector
accumulating an exposure of 4.34 kgdays.
II Sensitivity
Although COBRA is able to search for in a number of isotopes, the
sensitivity for the modes with lower Q-values will ultimately be limited by
background contributions from two neutrino double beta () decays of the
isotopes with higher Q-values. The contribution of decay events to the
current data set is negligible, but for a very sensitive neutrino mass search,
COBRA will focus on , which has the highest Q-value of 2809 keV
for the nuclear decay to . A peak will occur at this energy in
the sum energy spectrum for the case of .
Crucial experimental parameters, besides the mass of the detector/sample, are
energy resolution and the number of contaminating background events in this
range, as shown in Fig. 1. Possible background sources include
cosmic rays, the natural radioactive decay chains, radioisotopes produced by
cosmic ray interactions within the materials used and neutrons. To get a first
glimpse of the background using CZT detectors, a prototype setup has been
installed in the Gran Sasso Underground Laboratory (LNGS) in Italy, which
provides an average shielding of 3500 mwe against cosmic ray sources.
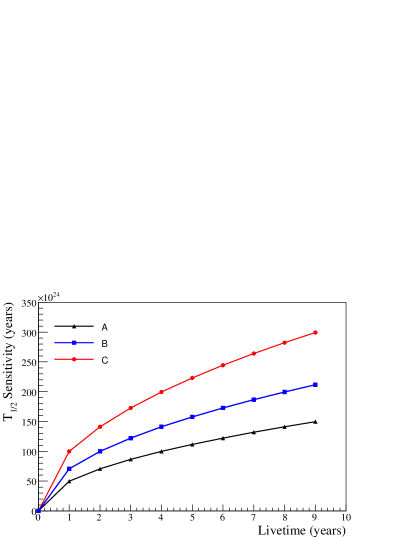
A = counts/(keV kg year), at 2.8 MeV.
B = counts/(keV kg year), at 2.8 MeV.
C = counts/(keV kg year), at 2.8 MeV. A half life of about 2 years corresponds to a neutrino mass sensitivity of about 50 meV using matrix elements from Ref. Rodin et al. (2006).
III Experimental Setup
The data presented here were obtained with four
1 cm1 cm1 cm CZT semiconductor detectors, each of mass
6.5 g, provided by eV-PRODUCTS. They utilise coplanar grid technology
to ensure that only the electron signal is read out Luke (1995) and hence
symmetric energy peaks are obtained. All four crystals were operated at a
voltage of 1500 V with a 20–40 V grid bias applied between the two
anodes. The crystal surfaces, except for the gold-coated cathode side, are
covered with a passivation paint which prevents oxidation and deterioration in
detector performance over time.
The four detectors were mounted in a copper brick separated from all
preamplifier electronics by 25 cm. The copper brick was part of a
cm)3 cube of electro-polished copper which was embedded in a further
15 cm of lead. The whole setup was located in a Faraday cage made from copper
plates. The cage was surrounded by a neutron shield, consisting of 7 cm thick
boron-loaded polyethylene plates and an additional 20 cm of paraffin wax at
the bottom. This neutron shield was upgraded to cover 3 sides of the cage, as
well as the base, with paraffin wax before the third data taking period (period
C). Data collection commenced with a CAMAC based data acquisition (DAQ) system
in which the signals were fed into four peak sensing ADC modules (LeCroy 3511
and 3512) via custom-built preamplifiers and shaping main-amplifiers. Prior to
period C, the system was upgraded to a VME-based DAQ with four custom-built,
peak sensing, 14-bit ADC channels.
IV Data Acquisition
The data analysed in this paper can be divided into three periods, separated by
upgrades to the experimental configuration that could have affected the
background contributions. In period A, the crystals were held in pertinax
mounting plates and connected directly to lemo cables. These mounting materials
were replaced by cleaner (in the radiopurity sense) delrin holders, whilst the
lemo connections were exchanged for copper traces mounted on kapton foils at
the start of period B. Before period C the data acquisition hardware was
upgraded to the VME system and the paraffin neutron shielding was completed.
| Subset | Livetime (days) | Events/(keV kg day) | |
|---|---|---|---|
| 500 keV | 600 keV | in 2–3 MeV range | |
| 1A | 32.86 | 150.99 | 0.57 0.02 |
| 2A | 0 | 112.34 | 0.59 0.03 |
| 3A | 52.84 | 52.84 | 0.38 0.03 |
| 4A | 62.62 | 134.64 | 0.34 0.02 |
| 1B | 16.03 | 16.03 | 0.54 0.07 |
| 1C | 197.53 | 197.53 | 0.56 0.02 |
During the latter periods not all crystals were fully operational, so only data
from crystal 1 were analysed. In each period, individual runs were limited to
one hour and selection criteria were applied on a run-by-run basis to reject
data affected by “bursts” of abnormally high event rates. Subsequent studies
have shown two main causes for such bursts: vibrations of the apparatus that
cause a piezo-electric effect in the crystals resulting in false event signals,
and breakdown effects due to faulty contacts to the crystal electrodes. To
reject the affected data, firstly the dead-time was calculated from the total
number of events per hour and the length of the event readout cycle during
which new events could be missed. 207 runs in which the dead-time exceeded 2%
(due to large numbers of events with low ADC counts) were rejected. For the
remaining runs the distribution of the number of events per hour in the energy
range 300–4000 keV was fitted with a Poissonian distribution. Runs with an
event rate exceeding the 99% upper limit of the fitted distribution were
discarded from the analysis. A further 203 runs were rejected in this way. No
other cuts were applied to the data and in total 2.5% of the runs were
rejected.
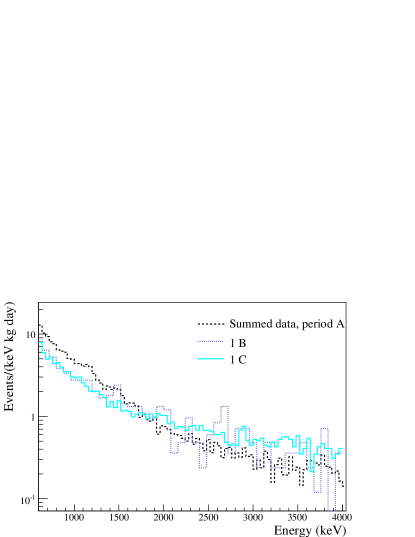
It is possible that each crystal had different background contributions due to
intrinsic and surface contaminants (as indicated by the values in
table 1). For this reason, data collected with each crystal, and
in each period, were considered as a different data sub-set. The summed data for
each of the collecting periods are shown in Fig. 2.
Although detectors have been operated for extensive periods with thresholds
below 100 keV, at times it was necessary to raise the threshold for data
collection to exclude electronic phenomena. Therefore, to maximise the livetime
for analysis, two data sets have been prepared; one with an energy threshold of
600 keV, and one with a 500 keV threshold that omits any runs with thresholds
in the range 500–600 keV. The livetimes for each subset and threshold are
given in table 1. The total livetime for the high-threshold data
set is 4.34 kgdays, whilst the low-threshold data set comprises
2.36 kgdays.
The energy resolution and stability of the detectors was calibrated regularly
with the help of , and sources.
Time-averaged resolution functions were determined for each data subset with
all crystals showing a linear increase in FWHM with increasing energy. FWHM
values in the range 5–8% at 2809 keV were achieved. Variations in the
resolution achieved can be attributed to changes in the contacting methods and
the voltages applied between the different data taking periods. It should be
noted that the detectors used here do not have the best energy resolution
possible, since for this first study with unknown background a very good energy
resolution was not considered to be essential and, hence, cheaper detectors
were used.
V Background studies
To understand the observed spectrum and disentangle the individual
contributions, a background model has been developed. All materials used were
measured for contaminants in the LNGS Ge-detector facility, though some of them
could only be measured after the start of data taking with the prototype. As a
consequence of these measurements, the pertinax holders and lemo cables were
replaced by delrin holders and kapton foils (between periods A and B). No
contamination of the CdZnTe could be detected with the Ge facility. With the
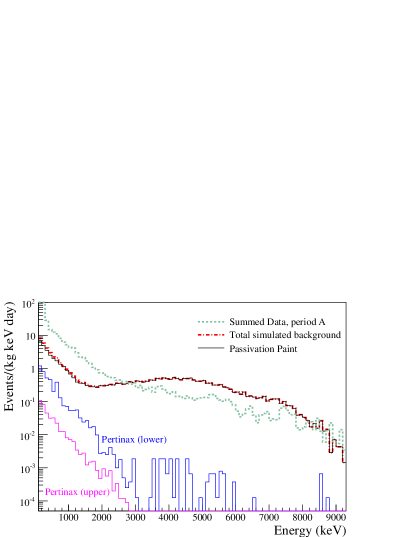
known activities of contaminants in the individual components, extensive Monte
Carlo modelling based on GEANT4 was performed to describe the observed spectrum
(Fig. 3).
By far the largest background in the 2–3 MeV region evolves from the
passivation paint on the detector surface. The precise prediction of this
contribution varies slightly due to the unknown paint mass and the
inhomogeneous paint thickness, which affects the alpha-particle simulation in
particular. However, there is a slight advantage associated with the
contaminated paint as the detector effectively acts as a self-calibrating
device. The installation of the VME system at the start of period C
significantly increased the timing resolution achieved for event read-out (from
1 ms to 10 s) permitting the observation of
coincidence events from . This isotope originates
from the Th-decay chain, present in the passivation paint, and beta-decays
with an endpoint of 3.3 MeV; the daughter isotope, , alpha-decays
with a half-life of 164.3 s, releasing a 7.7 MeV . The rate of
event pairs observed in the period C data-set was consistent with the
measured activity of a paint sample. Furthermore, it shows that any possible
dead layer at the detector surface is insignificant, otherwise the
alpha-particles would not be detected. In the meantime, an alternative solution
for surface passivation of the CZT detectors has been found and is currently
being explored at LNGS. Initial measurements show a reduction of this
background by at least a factor of 8, if not more, in the region of interest
around 2.8 MeV.
The measurements of pertinax contaminants prompted the replacement of all
pertinax components with delrin, leading to a reduction of events by about a
factor of 5 in the range 500–2000 keV, though some of this reduction can be
attributed to the exchange of the lemo cables.
VI Achievable Energy resolution
The underground studies are not currently limited by energy resolution and, therefore, it was not considered necessary to use the highest quality of crystals in this set-up. However, as background levels are reduced the energy resolution will become important, since a sharp peak is especially important in reducing the contribution of the irreducible background of events to the peak region. The fraction of events in the peak region, as a function of energy resolution (FWHM) can be approximated by Elliott and Vogel (2002)
| (1) |
With this in mind, additional studies were performed outside the underground experiment to determine the resolution achievable with CZT coplanar-grid detectors and to investigate possible improvements.
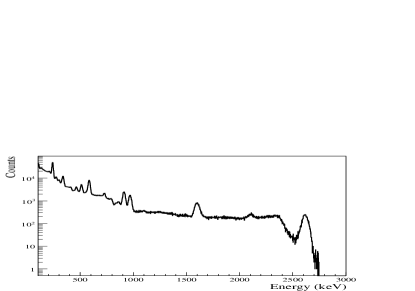
Fig. 4 shows a spectrum measured with a typical
‘medium quality’ CZT detector, resulting in a resolution of 2.6% at 2614 keV
but resolutions as good as 2.1% have been measured with COBRA crystals. With
such a resolution, for the case of 90% isotopic enrichment,
decays will only contribute counts/(kg yr) to the
59 keV wide signal region (calculated using the observed half-life of yrs Saakyan (2006)). This is already well below the required
background levels shown in Fig. 1 but detectors with still better
energy resolution are commercially available and are being considered for use
in a future stage of the experiment.
A further experimental option to improve the energy resolution is cooling of
the detector. This might be especially important for searches in the low energy
range, for decays such as two neutrino double electron capture (ECEC)
that produce a signal below 100 keV. First measurements of cooling from
24∘C to 10∘C revealed an improvement in energy resolution of a
factor two below 100 keV and an improvement of 5 % on the typical resolution
at 2809 keV.
VII Data Analysis
The data analysis consists of two independent parts: simulation of
the possible double beta decays to determine detection efficiencies and a maximum
likelihood peak search.
The predicted signals in the crystals were determined through a GEANT4 based
Monte Carlo simulation utilising calculations from the Fortran Decay0
code Ponkratenko et al. (2000). decays to ground state (g.s.) and excited
states111Only excited states already included in the Decay0 code were
used, therefore some transitions, namely those to the higher excited states of
, have been omitted from this analysis. were simulated for each
of the candidate isotopes contained in natural CdZnTe. For transitions,
calculations based on the light Majorana neutrino exchange mechanism were used
for () transitions, whilst right-handed currents were used
in the calculation for () transitions. As there is no general
connection between ground state and excited state matrix elements, they must be explored
separately for each isotope.
The energy, , and intensity of the dominant peak for each decay were determined from these simulations and are given in
table 2. The efficiency for observation of the full peak
energy, , determined from the peak intensity generally decreases with
increasing peak energy. For decays to excited states, gamma escape
probabilities also play a part.
| Isotope | Decay | Fit range | |||
|---|---|---|---|---|---|
| (MeV) | (%) | (%) | (MeV) | ||
| 116Cd | to g.s | 2.809 | 4.7–7.6 | 66.5 | 2.21–3.20 |
| 130Te | to g.s | 2.529 | 4.8–7.8 | 70.9 | 2.21–3.20 |
| 130Te | to 536 keV | 1.993 | 5.0–8.5 | 61.2 | 1.70–2.28 |
| 116Cd | to 1294 keV | 1.511 | 5.4–9.4 | 74.4 | 1.20–1.78 |
| 116Cd | to 1757 keV | 1.048 | 6.0–11.0 | 60.4 | 0.90–1.30 |
| 70Zn | to g.s | 1.001 | 6.1–11.3 | 93.3 | 0.60–1.30 |
| 128Te | to g.s | 0.868 | 6.5–12.2 | 94.8 | 0.60–1.30 |
| 116Cd | to 2027 keV | 0.778 | 6.8–12.9 | 67.4 | 0.50–1.20 |
| 116Cd | to 2112 keV | 0.693 | 7.1–13.8 | 77.3 | 0.50–1.00 |
| 116Cd | to 2225 keV | 0.580 | 7.7–15.4 | 76.6 | 0.50–1.00 |
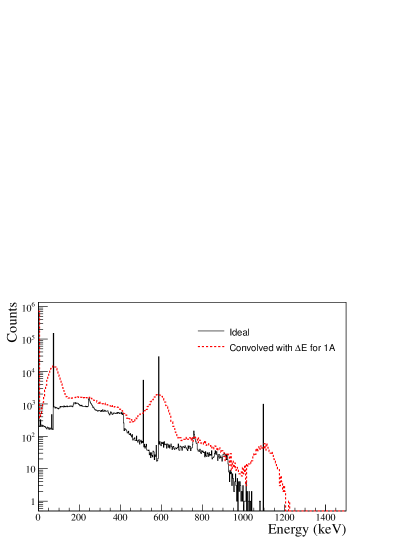
For the isotopes that decay through transitions, double electron capture
(EC/EC), single electron capture (EC) and double positron
(2)-transitions were considered when energetically possible. In general
the predicted spectra for these decays are significantly more complex than those
for transitions, without clearly dominating peaks. As an example, the
simulated spectrum for 64Zn EC decays to the ground state is shown
in Fig. 5, both for ideal resolution and convolved with the
energy response for data subset 1A. Although there is a peak at the Q-value for
this decay (1096 keV), there are also single and double 511 keV escape peaks,
and a peak at 511 keV due to gammas produced from the anihillation of
positrons produced by these decays in the other three crystals.
Detailed simulations and ex-situ measurements of background contaminants were
used to characterise the measured background continuum, as described in section
V.
An exponential of the form was found to describe the data well
at higher energies. Below 500 keV the fits were less satisfactory due to the
presence of a number of low-energy gamma peaks and the 4-fold forbidden decay
of Goessling et al. (2005) so a 500 keV threshold was enforced. Thus,
decay modes with no significant peaks above 500 keV, namely those of
and , were omitted from the analysis presented in
this paper.
A study of the residuals of the background fits showed some evidence for
additional peaks in the continuum at 610 keV and 1120 keV, relating to gamma
lines from decay. Due to the combined effects of decay branching
ratios, energy resolution and reduced efficiency for stopping higher energy
gammas in a single crystal, no other background gamma peaks within the analysis
region were predicted through simulations. Therefore, two gaussian peaks were
added to the description of the background with fixed mean and width determined
from the relevant resolution function. The amplitudes of these peaks were
treated as additional fit parameters. As a cross-check, fits for the
exponential background were performed without these additional background peaks
and in all cases resulted in a poorer, or negligibly different, chisquared
probability.
A maximum likelihood fit was performed to determine the most likely number of
signal events, , over the combined data-set. Parameters describing
the background were allowed to vary between crystals and data collection
periods, but the signal rate was assumed to be constant throughout.
i.e. Different background parameters were applied to different data
subsets to allow for the varying background rates (indicated in
table 1) but the normalised background distributions fitted to
each data subset were found to agree within errors for each fit scenario.
For modes, enters the fit through the amplitude of a gaussian
peak with width determined by the calibrated resolution of the relevant data
subset. The range of peak widths (FWHM) for each fitted peak are given in
table 2 along with the energy range used for each fit.
Simulations showed that a range of or greater
was required for each peak-search in order to adequately characterise the
background continuum. The close proximity of some predicted signal peaks
required these ground-state transition signals to be determined simultaneously:
116Cd and 130Te were fit together and the 70Zn and 128Te
peaks were also fit simultaneously. Transitions to excited states are expected
to be significantly suppressed with respect to ground state transitions due to
phase-space arguments, so any contribution of excited state decays to the
fitted peaks for ground-state transitions is assumed to be negligible. The
limit for each signal arising from a transition to an excited state was
determined in a separate fit. The high-threshold ( keV) data set was
used for all -mode peak searches except the decays to the third and fourth
excited states of .
The majority of spectra predicted for -mode decays have multiple peaks,
each significantly smaller in amplitude than those arising from decays to
the ground state, thus justifying separate treatment in the analysis. Due to
the complexity of these spectra, to determine the most likely number of signal
events, , the most likely scaling factor for the entire simulated
spectrum, was extracted from the likelihood fit. For each decay the simulated
spectrum was normalised to unity and convolved with the relevant resolution
function for each data sub-set. The range for each fit (as given in
table 4) was selected to include all the dominant peaks. For
transitions where the simulated spectra showed a dominant peak in the region
500–600 keV, the low-threshold data set was used; in all other cases, the
high-threshold data set was used.
For all and modes analysed, a 90% confidence limit on the
half-life, , was determined from the fitted number of signal
events, , where is one sigma uncertainty in
the fit, for each decay under investigation.
| (2) |
Here is the number of candidate nuclei per crystal for the given
decay, is the total duration of data collection in
crystal-years, and is an efficiency factor determined from
simulations. For -searches, is the fraction of simulated events
in the peak region (see table 2). However, for -searches
since the whole simulated spectrum, normalised to unity, is used
in the fit.
For each fit, a chisquared goodness of fit test was performed. However, due to
the low statistics, this parameter was not expected to follow a true chisquared
distribution. Therefore, the distribution of the statistic was
determined by Monte Carlo for each fit in order to calculate the fit
probability. The , and its respective probability, determined for each
-fit is included in table 3. For the -fits the
probabilities for each fit were also all 80%. As a cross-check, fits were
repeated with fixed to zero for each signal, all of which resulted
in either negligible change or a decrease in the goodness of fit.
A detailed study of possible systematic effects was performed and the dominant
uncertainties were found to be those that affect the number of candidate
nuclei. Uncertainties in energy resolution and livetime, and possible biases in
the fit procedure, were all found to have a negligible effect on the analysis.
However, the possible existence of a dead-layer at the surface of the crystals
could reduce the active volume by up to 10%. Observations of
-particles from the passivation paint indicate that the dead layer is
probably smaller than this but the effect was taken into account in a
conservative manner by using in the limit calculation.
Due to the production process, the zinc content is only known to be in the
range 7–11% resulting in an uncertainty in both the number of zinc nuclei and
the number of cadmium nuclei. To ensure conservative half-life limits, 7% zinc
content was used when calculating the number of zinc nuclei, and 11% zinc
content was used in calculations for cadmium isotopes.
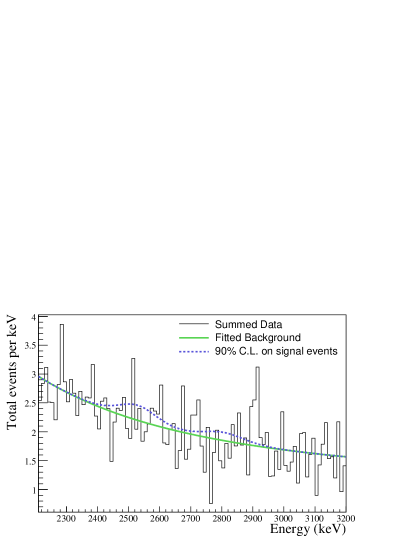
VIII Results
 |
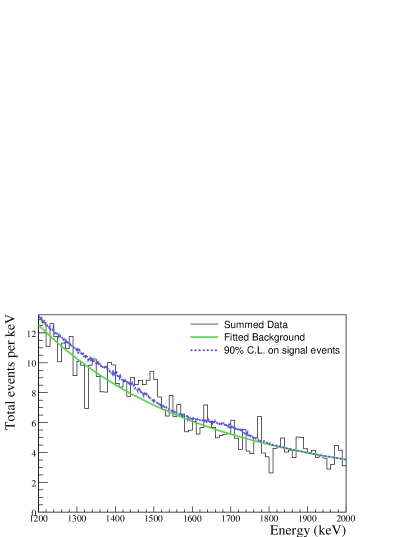 |
Table 3 shows all the decay half-life limits (90% C.L.) calculated in this work and table 4 shows the limits calculated for decays. The limits obtained from the combined fit to the and decays to ground state and for the double electron capture decay to ground state are shown in Fig. 6. Due to the small detector mass, at present the searches for 116Cd and 130Te cannot compete with other running large scale experiments. However, half-life limits obtained for and improve on existing measurements.
| Isotope and Decay | /DoF | P | T1/2 limit (years) | ||
|---|---|---|---|---|---|
| This work | World Best | ||||
| 116Cd | to g.s | 1236/2950 | 0.99 | 3.14 | 1.7 Danevich et al. (2003) |
| 130Te | to g.s | 1236/2950 | 0.99 | 9.92 | 1.8 Arnaboldi et al. (2005) |
| 130Te | to 536 keV | 726/1703 | 0.99 | 3.73 | 9.7 Alessandrello et al. (2000) |
| 116Cd | to 1294 keV | 676/1703 | 1.00 | 4.92 | 2.9 Danevich et al. (2003) |
| 116Cd | to 1757 keV | 615/1479 | 0.99 | 9.13 | 1.4 Danevich et al. (2003) |
| 70Zn | to g.s | 859/2078 | 1.00 | 2.24 | 9.0 Danevich et al. (2005) |
| 128Te | to g.s | 859/2078 | 1.00 | 5.38 | 1.1 Arnaboldi et al. (2003) |
| 116Cd | to 2027 keV | 756/1732 | 0.96 | 1.37 | 2.1 Piepke et al. (1994) |
| 116Cd | to 2112 keV | 545/1233 | 0.87 | 1.08 | 6.0 Danevich et al. (2003) |
| 116Cd | to 2225 keV | 545/1233 | 0.87 | 9.46 | 1.0† Barabash et al. (1990) |
| Isotope and Decay | Range | T1/2 limit (years) | ||
|---|---|---|---|---|
| (MeV) | This work | World Best | ||
| 64Zn | EC to g.s. | 0.5–1.3 | 2.781017 | 2.4 Danevich et al. (2005) |
| 64Zn | 2EC to g.s. | 0.7–1.3 | 1.191017 | 7.0 Danevich et al. (2005) |
| 120Te | EC to g.s. | 0.5–2.0 | 1.211017 | 2.2 Kiel et al. (2003) |
| 120Te | 2EC to g.s. | 1.2–2.0 | 2.681015 | - |
| 120Te | 2EC to 1171keV | 0.5–2.0 | 9.721015 | - |
| 106Cd | to g.s. | 0.5–2.0 | 4.50 | 2.4 Belli et al. (1999) |
| 106Cd | EC to g.s. | 1.4–3.0 | 7.31 | 3.7 Belli et al. (1999) |
| 106Cd | 2EC to g.s. | 1.4–3.0 | 5.70 | 1.5 Norman and DeFaccio (1984) |
| 106Cd | to 512keV | 0.5–2.0 | 1.81 | 1.6 Belli et al. (1999) |
| 106Cd | EC to 512keV | 0.8–2.0 | 9.86 | 2.6 Belli et al. (1999) |
IX Summary
A new double beta decay experiment, COBRA, is planned using a large amount of
CZT semiconductor detectors. A low rate of background events in the peak region
and good energy resolution are crucial aspects of the design of such an
experiment. To develop this new approach, CZT semiconductor detectors have
been operated deep underground, for the first time, to study their background.
Using a small prototype, a background model has been developed and a major
background component in the form of a passivation paint on the detector
surfaces was identified. Alternatives are now available and major improvements
are expected soon.
Studies of the attainable energy resolution showed that the contribution of
the irreducible background of can be kept to a negligible level. A
4.34 kgday data set, collected with four 1 cm3 crystals, has been
analysed to determine limits on various neutrinoless double beta decay modes of
seven different isotopes. Despite the small detector mass, only 26 g of
CZT, these data have yielded four improved half-life limits for decays of
and . After submission of this, paper new limits for
have been presented Barabash et al. (2007).
In the near future, 64 CZT detectors will be running and improvements on all
the limits presented in this paper can be expected. In addition to the
increased detector mass, new criteria based on coincident energy deposits in
time and space will allow better rejection of backgrounds, and a full
characterisation of each individual crystal will help reduce systematic
uncertainties.
X Acknowledgements
This research was supported by PPARC and the Deutsche Forschungsgemeinschaft (DFG). We thank G. Cowan for useful discussions, V. Tretyak for providing the Decay0 code and eV-PRODUCTS for their support. In addition, we thank the Forschungszentrum Karlsruhe, especially K. Eitel, for providing the material for the neutron shield. We thank the mechanical workshop of the University Dortmund for their support and the Laboratori Nazionali del Gran Sasso (LNGS) for offering the possibility to perform measurements underground. The work has been supported by the TA-DUSL activity of the ILIAS program (Contract No. RII3-CT-2004-506222) as part of the EU FP6 programme.
References
- (1) Y. Fukuda et al., Super-Kamiokande Collaboration, Phys. Rev. Lett., 81, 1562 (1998); 82, 1810 (1999); 82, 2430 (1999); 86, 5651 (2001).
- (2) Q. Ahmad et al., SNO Collaboration, Phys. Rev. Lett., 87, 071301 (2001); 89, 011301 (2002); 89, 011302 (2002).
- (3) K. Eguchi et al., KamLAND Collaboration, Phys. Rev. Lett., 90, 021802 (2003); 94 081801 (2005).
- Zuber (2006) K. Zuber, Acta Polonica B37, 1905 (2006).
- Elliott and Engel (2004) S. Elliott and J. Engel, J. Phys. G30, R183 (2004).
- Zuber (2001) K. Zuber, Phys. Lett. B519, 1 (2001).
- Hirsch et al. (1994) . Hirsch et al., Z. f. Phys. A347, 151 (1994).
- Rodin et al. (2006) V. Rodin et al., Nucl. Phys. A766, 107 (2006).
- Luke (1995) P. Luke, IEEE Transactions on Nuclear Science 42, 207 (1995).
- Elliott and Vogel (2002) S. Elliott and P. Vogel, Ann. Rev. Nucl. Part. Sci. 52, 115 (2002).
- Saakyan (2006) R. Saakyan, Talk at ILIAS Double beta Meeting, Valencia (2006).
- Ponkratenko et al. (2000) O. A. Ponkratenko, V. Tretyak, and Y. Zdesenko, Phys. Atom. Nucl. 63, 1282 (2000), The actual generator used was Decay0, not Decay4.
- Goessling et al. (2005) C. Goessling et al., Phys. Rev. C72, 064328 (2005).
- Danevich et al. (2003) F. A. Danevich et al., Phys. Rev. C68, 035501 (2003).
- Arnaboldi et al. (2005) C. Arnaboldi et al., Phys. Rev. Lett. 95, 142501 (2005).
- Alessandrello et al. (2000) A. Alessandrello et al., Phys. Lett. B486, 13 (2000).
- Danevich et al. (2005) F. A. Danevich et al., Nucl. Instr. Meth. A544, 553 (2005).
- Arnaboldi et al. (2003) C. Arnaboldi et al., Phys. Lett. B557, 167 (2003).
- Piepke et al. (1994) A. Piepke et al., Nuclear Physics A 577, 493 (1994).
- Barabash et al. (1990) A. Barabash, A. Kopylov, and V. Cherehovsky, Phys. Lett. B 249, 186 (1990).
- Kiel et al. (2003) H. Kiel, D. Münstermann, and K. Zuber, Nucl. Phys. A723, 499 (2003).
- Belli et al. (1999) P. Belli et al., Astropart. Phys. 10, 115 (1999).
- Norman and DeFaccio (1984) E. Norman and M. DeFaccio, Phys. Lett. B148, 31 (1984).
- Barabash et al. (2007) A. Barabash et al., Preprint nucl-ex/0703020 (2007).