VISIR / VLT mid-infrared imaging of Seyfert nuclei: ††thanks: Based on VISIR science verification observations under ESO/VLT programme 60.A-9244(A).
Abstract
Aims. Half of the Seyfert-2 galaxies escaped detection of broad lines in their polarised spectra observed so far. Some authors have suspected that these non-HBLRs contain real Sy2 nuclei without intrinsic broad line region hidden behind a dust torus. If this were true, then their nuclear structure would fundamentally differ from that of Sy2s with polarised broad lines: in particular, they would not be explained by orientation-based AGN unification. Further arguments for two physically different Sy2 populations have been derived from the warm and cool IRAS F25/F60 ratios. These ratios, however, refer to the entire host galaxies and are unsuitable to conclusively establish the absence of a nuclear dust torus. Instead, a study of the Seyfert-2 dichotomy should be performed on the basis of nuclear properties only. Here we present the first comparison between [OIII] and mid-infrared imaging at matching spatial resolution. The aim is to check whether the nuclear dust emission scales with AGN luminosity as traced by [OIII].
Methods. During the scientific verification phase of the VISIR instrument at the ESO Very Large Telescope we observed 16 Sy1 and Sy2 nuclei at 11.25 m with 035 spatial resolution (FWHM). We supplement our observations with high-resolution 10–12 m literature data of 58 Seyfert galaxies, for which spectroscopic or spectropolarimetric information and far-infrared data are available.
Results. Twelve of the 15 detected sources are unresolved and three sources show a dominant unresolved core surrounded by some faint knots in an area smaller than 1–2 radius. Our VISIR photometry agrees to better than 15% with published data obtained at 15–5 spatial resolution. Exploring the Seyfert-2 dichotomy we find that the distributions of nuclear mid-infrared / [OIII] luminosity ratios are indistinguishable for Sy1s and Sy2s with and without detected polarised broad lines and irrespective of having warm or cool IRAS F25/F60 ratios. We find no evidence for the existence of a population of real Sy2s with a deficit of nuclear dust emission. Our results suggest 1) that all Seyfert nuclei possess the same physical structure including the putative dust torus and 2) that the cool IRAS colours are caused by a low contrast of AGN to host galaxy. Then the Seyfert-2 dichotomy is explained in part by unification of non-HBLRs with narrow-line Sy1s and to a larger rate by observational biases caused by a low AGN/host contrast and/or an unfavourable scattering geometry.
Key Words.:
Galaxies: nuclei, active, Seyferts - Infrared: galaxies1 Introduction
The nuclei of Seyfert galaxies are grouped into Sy1 and Sy2 depending on the presence of broad emission lines in their optical spectra (Khachikian & Weedman 1974). According to the unified model Sy1 and Sy2 nuclei differ only with respect to our line of sight. In Sy2s the broad line region (BLR) is hidden by a dusty torus-like structure seen edge-on. Crucial evidence for the unified model comes from the detection of polarised broad lines in those Sy2 galaxies, where a ”scattering mirror” off the torus plane allows a direct view of the region inside the torus (Antonucci 1993). Also, in some cases broad Pa lines were found by ordinary infrared spectroscopy penetrating the dust column (e.g. Veilleux et al. 1997). The presence of obscuring material is most directly inferred from large X-ray absorbing columns as well as the thermal emission from the optical-UV energy intercepted and re-radiated in the mid-infrared (MIR, 3–40m). Note that the unified model refers to the structure of an AGN with the dusty molecular torus belonging to its basic components, but does not make a statement about the host galaxies (Antonucci 2002).
So far about half of the Sy2s show evidence for a hidden broad line region (HBLR) and half of them do not (e.g. compilation by Gu & Huang 2002, Moran 2007). Such a dichotomy between HBLR and non-HBLR Sy2s could either (1) result from the existence of real Sy2s without intrinsic BLR or (2) be due to an observational bias. In order to establish the origin of the Seyfert-2 dichotomy, numerous studies have been performed, but with controversial results.
Theoretical studies suggests that there are limits to the existence of a BLR, in particular at low AGN luminosity (Nicastro 2000, Nicastro et al. 2003). At the extreme end of the Sy1 population some sources show rather narrow H lines (FWHM 2000 km/s), but extraordinarily strong FeII lines and steep X-ray spectra not found in Sy2s. For the narrow-line Seyfert-1 galaxies (NLS1s) some orientation-based type-2 counterparts have been found (e.g. Nagar et al. 2002, Dewangan & Griffiths 2005, Zhang & Wang 2006). Since NLS1s constitute less than 15% of the optically selected Sy1 population, some but not all of the non-HBLR Sy2s may be misoriented NLS1s.
Arguments for an origin of the Seyfert-2 dichotomy as an observational bias are numerous. Modelling X-ray spectra can provide column densities N as valuable constraints (Alexander 2001, Gu et al. 2001), but depends critically on assumptions about the central geometry. Hence, any inference on low N may be pretended by X-ray scattering (e.g. Ghosh et al. 2007) and should be corroborated by other findings. There is no doubt that dust lanes may obscure not only the nucleus but also the scattering mirror necessary for the detection of a HBLR. Hence, only under favourable circumstances one may expect detectable scattered light at all from a hidden AGN (Miller & Goodrich 1990, Heisler et al. 1997, Gu et al. 2001). The AGN-typical emission line [OIII] (henceforth denoted [OIII]) has an average equivalent width which is higher for HBLRs than for non-HBLRs, indicating a stronger AGN/host contrast in HBLRs (Lumsden et al. 2001, Moran 2007). Generally, it is a challenge for spectropolarimetric observations to discern the few percent BLR signature of a relatively faint AGN against a luminous host galaxy (Alexander 2001, Gu et al. 2001, Lumsden & Alexander 2001, Lumsden et al. 2001). Although still half of the most nearby Sy2s resisted HBLR detection even with Keck spectropolarimetry, such sensitive observations are revealing broad lines in sources, which were previously classified as non-HBLRs using smaller telescopes. This reminds us to take care when interpreting spectropolarimetric non-detections of broad lines (Moran 2007).
From his Lick-Palomar spectropolarimetric survey of the CfA and 12 m Seyfert samples Tran (2001, 2003) has found that compared with HBLRs the non-HBLRs show lower [OIII] luminosity, lower [OIII]/H excitation ratios and cooler IRAS 25 m / 60 m colours F25/F60 0.25. Most Seyfert galaxies exhibit warm F25/F60, but some have cool colours. Guided by the widespread belief that cool F25/F60 indicates a lack of adequate nuclear dust emission, Tran naturally concluded that most if not all non-HBLRs are real Sy2s, and not misaligned Sy1s. However, the host galaxies have a size of about 1 so that nuclei and hosts are not separated by the IRAS beam. Hence, nuclear optical properties were compared with extended infrared ones possibly dominated by the host so that the conclusions about the missing nuclear dust torus in non-HBLRs should be checked using adequate nuclear data.
If we focus on the BLR and the dust torus as basic components of the structure of an AGN, then intrinsically an AGN may belong to one of the four formal cases:
-
1)
with BLR and with dust torus
-
2)
with BLR, but without dust torus
-
3)
without BLR, but with dust torus
-
4)
without BLR and without dust torus.
The sources of case 1 are Sy2s with HBLR and Sy1s, while sources of case 2 have not been observed so far (they would be Sy1s without nuclear dust). If non-HBLRs do not belong to case 1, then they are sources of case 3 and/or 4 and nuclear MIR observations should be able to distinguish between case 3 and 4. Therefore, we define a ”naked” AGN to be free of surrounding dust (in analogy to the terminology of T Tauri stars). The assessment of whether nuclei are naked or not requires a suitably chosen reference quantity and reference sample. We here combine new nuclear MIR 11.25 m observations at the VLT with published nuclear 10–12 m photometry of several Seyfert type samples, and compare them with [OIII] literature data as reference quantity. The [OIII] emission arises from the moderately extended narrow-line region (NLR). Our test assumes that the [OIII] emission can be regarded with little reservation as isotropic measure of the intrinsic AGN power so that it can be used for suitable normalisation. The aim here is to check whether there exist naked nuclei among Seyfert galaxies and in particular among non-HBLRs. At a first guess we expect that the L / L ratio of a naked nucleus lies below the distribution of that ratio found in most Sy1s or HBLR Sy2s. Furthermore if nuclear dust emission is missing in non-HBLR sources (case 4), this argues against a hidden BLR and in favour of real Sy2s. On the other hand, if the nuclear MIR / [OIII] ratio has the same distribution for both cool non-HBLR and warm HBLR Sy2s, then this suggests that both types are similarly surrounded by a dust torus (case 1 or 3). Furthermore if case 3 may be rejected with the help of other arguments, then both Sy2 types possess the same physical AGN structure.
2 VISIR science verification observations
| object | VISIR | literature | reference |
|---|---|---|---|
| mJy | mJy | ||
| CentaurusA | 946 | 1000 | 1 |
| ESO141-G055 | 169 | 166 | 2 |
| IC5063 | 752 | 920 | 1 |
| MCG-3-34-64 | 674 | 594 | 3 |
| MCG-6-30-15 | 392 | 383 | 4 |
| Mrk1239 | 660 | 600 | 5 |
| Mrk509 | 235 | 240 | 5 |
| Mrk590 | 90 | 100 | 6 |
| NGC2992 | 312 | 339 | 7 |
| NGC3783 | 645 | 689 | 7 |
| NGC4507 | 589 | 600 | 6 |
| NGC5427 | 2.3 | 10 | 8 |
| NGC5995 | 332 | 300 | 9 |
| NGC7213 | 250 | 261 | 4 |
| NGC7314 | 74 | 75, 100 | 10, 6 |
| PG2130+099 | 160 | 174, 130 | 10, 9 |
The references are:
1 = Siebenmorgen et al. (2004),
2 = Rieke & Low (1972),
3 = Gorjian et al. (2004),
4 = Glass et al. (1982),
5 = Maiolino et al. (1995),
6 = this work using Spitzer IRS,
7 = Roche et al. (1991),
8 = this work using Spitzer IRAC & MIPS,
9 = Galliano et al. (2005),
10 = Horst et al. (2006).
aperture 5, except 15 for Siebenmorgen et al. (2004), Gorjian et al. (2004), Galliano et al. (2005), and 05 for Horst et al. (2006).
flux at 12 m.
corrected for flux loss due to slit offset, see text.
We have observed about two dozen Seyfert galaxies from several cataloges during the scientific verification phase of VISIR. VISIR is the VLT imager and spectrograph for the mid–infrared (Lagage et al. 2004, Pantin et al. 2005), mounted on the Cassegrain focus of the VLT Unit Telescope 3 (Melipal). In order to verify the capabilities of VISIR, the sources were selected to cover a broad range of properties. The AGN exhibit faint as well as strong starburst contributions and have extended to so far known unresolved nuclei. The science verification sources do not form a homogeneous AGN sample. Here we consider those 16 sources suited to adress the Seyfert-2 dichotomy.
The imaging data were obtained during Oct. 2004 – Feb. 2005 through the PAH2 filter (11.25 0.6 m) under good and stable weather conditions. The optical seeing was better than 1 and the objects were observed at airmass 1.4 (1.1 on average). To suppress the background, secondary mirror chopping was performed in North-South direction with an amplitude of 16 at a frequency of 0.25 Hz. Nodding was applied every 30 s using telescope offsets of 16 in East-West direction. The pixel scale was 0.127 arcsec/pixel resulting in a 325 field of view. The detector integration time was 25 ms. Total source integration time was 20 min. All observations were bracketed by photometric standards (from http://www.eso.org/instruments/visir/tools/). The elementary images are coadded in real-time to obtain chopping-corrected data. Then the nodding positions are combined to create the final image. VISIR images may show stripes randomly triggered by some high-gain pixels. They are removed by a dedicated reduction method (Pantin 2007, in prep.).
Twelve of the 15 detected sources are unresolved (FWHM = 035), and three sources show a dominant unresolved core surrounded by some faint knots in an area smaller than 1–2 radius. We find that the VISIR 11.25 m photometry is consistent with published measurements (Table 1). In four cases we derived 11-12 m photometry from archival Spitzer IRAC/MIPS/IRS data at 5 resolution. Notably, in two cases (marked in Table 1) the source had an offset of 1 to the IRS slit center (slit width 4), leading to about 30% flux loss we corrected for. Figure 1 illustrates the excellent agreement of our VISIR photometry with other observations. The similarity of the VISIR fluxes with those measured using apertures of 15 – 5 suggests that essentially the entire 10–12 m flux of our sources arises from very compact nuclear areas (FWHM035).

One caveat has to be mentioned, when chopping in a structure-rich emission. One object (NGC 5427) has not been detected by VISIR with a formal 3- upper limit of only 2.3 mJy for an unresolved point source. This object has not been observed with other ground-based MIR arrays, but with the Spitzer Space Telescope at 3.6 – 24 m. Despite the lower spatial resolution (by a factor of about ten), the Spitzer images reveal a nuclear point source (FWHM 3) and extended ring like emission at about 10 separation from the nucleus. From the Spitzer SEDs we estimate that the 3 nuclear 11.25 m flux of NGC 5427 should be at least 10 mJy, four times higher than the formal 05 VISIR upper limit of 2.3 mJy. This discrepancy disappears, if the nuclear emission is unresolved by Spitzer and resolved by VISIR but has an insufficient surface brightness to be detected. In the following comparison with samples of lower resolution, we adopt for NGC 5427 the upper limit of 10 mJy.


3 Sample selection and data base
Apart from the science verification issue, our VISIR sources were originally selected for comparison with X-ray and sub-mm samples (results in preparation by Horst et al. and Siebenmorgen et al., respectively) so that part of them lacks information needed to study the Seyfert-2 dichotomy. Therefore, we supplement the VISIR sample with literature data. So far no data base with homogeneously observed spectropolarimetry and high-resolution MIR photometry exists for a well defined complete Seyfert sample.
We here selected our sample by starting with all Sy2 sources having spectropolarimetric information (Heisler et al. 1997, Lumsden et al. 2001, 2004, Moran et al. 2000, 2001, 2007, Tran 2003). They were mostly drawn from the local (cz 3100 km/s, Ulvestad & Wilson 1984), the CfA (Huchra & Burg 1992) and the 12 m (Rush et al. 1993) Seyfert samples. We included all Sy1 galaxies from these samples as well as the remaining Sy2s without spectropolarimetry, in order to compare them with HBLRs and non-HBLRs.
We cross-correlated this optical data base with high-resolution FWHM 1 array observations at 10–12 m (Gorjian et al. 2004, Siebenmorgen et al. 2004 and Galliano 2005), as well as 10 m photometer measurements with 5 aperture (Maiolino et al. 1995 and references therein). We did not scale the MIR fluxes to a common wavelength, since such corrections rely on assumptions about the spectral slope and would be small either. As shown by Gorjian et al. (2004), for 58 of their 62 detected sources virtually the entire flux seen in the 5 aperture arises from the nuclei unresolved to FWHM 1, corresponding to about 500 pc resolution for a source at 100 Mpc distance. The MIR observations cannot resolve the dust torus so that dust clouds in the NLR (e.g. Galliano et al. 2005a) or nuclear starbursts may contribute as well, but we can confine the analysis to the nuclear emission largely free of contamination by the host galaxy. Dust enshrouded starbursts may contribute to the nuclear MIR emission, as indicated in some cases resolved with VISIR (Wold & Galliano 2006), but 1) such sources stand out in the distributions shown below, and 2) the resolved circumnuclear starbursts are faint relative to the unresolved nuclei (e.g. Wold & Galliano 2006).
We complemented and interpolated missing IRAS 12-100 m photometry as far as available by ISO and Spitzer photometry. We excluded sources without FIR data (i.e. lying in sky areas not scanned/observed by IRAS/ISO/Spitzer), sources with LINER spectra, and double nuclei with unknown location of the MIR data. This results in 34 Sy1s (types 1.0–1.5) as well as 66 Sy2s (types 1.8–2.0), 29 with and 20 without detected hidden broad lines and 17 without spectropolarimetry. Table 2 lists the sample parameters and Table 3 the source parameters. Figure 2 shows for each type the distribution of the [OIII], 12 m and FIR (60 and 100 m) luminosity versus distance. The implications from the luminosities are discussed further below (Sect. 4.2 and 4.3). Since the VISIR data points lie randomly distributed across the entire sample, they are not marked with extra symbols, in order to keep the number of plot symbols manageable.
| (1) | (2) | (3) | (4) | (5) |
|---|---|---|---|---|
| Sy1 | Sy2 | HBLR | non-HBLR | |
| Total number of sources | 34 (4) | 17 | 29 | 20 |
| thereof used | 17 (2) | 12 | 21 | 16 |
| 1.quart, median, 3.quart | 1.quart, median, 3.quart | 1.quart, median, 3.quart | 1.quart, median, 3.quart | |
| mean dex | mean dex | mean dex | mean dex | |
| L([OIII]) [log (erg/s)] | 40.38 41.21 41.45 | 39.29 39.96 40.58 | 40.57 40.95 41.41 | 40.05 40.33 40.96 |
| 40.76 0.72 | 39.73 0.65 | 40.78 0.85 | 40.37 0.68 | |
| Nuclear L(12m) [log L] | 8.92 9.60 9.96 | 7.71 8.65 9.04 | 9.26 9.43 9.91 | 8.23 8.90 9.54 |
| 9.34 0.71 | 8.22 0.68 | 9.41 0.77 | 8.81 0.74 | |
| L(FIR) [log L] | 9.48 10.14 10.44 | 9.93 10.22 10.45 | 10.03 10.37 10.52 | 9.85 10.51 10.88 |
| 9.93 0.49 | 9.96 0.69 | 10.25 0.43 | 10.29 0.66 | |
| Nuclear F12/[OIII] | 11.82 11.93 12.28 | 11.57 11.85 12.28 | 11.75 12.07 12.46 | 11.26 11.86 12.52 |
| log (Jy/erg/s/cm) | 11.94 0.39 | 11.84 0.50 | 11.99 0.43 | 11.79 0.65 |
| Nucl./Gal. F12 | 0.06 0.13 0.15 | 0.42 0.50 0.60 | 0.04 0.25 0.72 | |
| 0.32 0.03 | 0.08 0.44 | 0.29 0.55 | 0.13 0.73 |
number of NLSy1 are listed in brackets
without spectropolarimetry
= L(60m & 100m)
only cool sources with F25/F60 0.25
Since the actual dichotomy, as to whether non-HBLRs are real Sy2s or not, tends to fall at rather modest AGN luminosity we excluded the most luminous sources from our analysis by applying a distance cut at d = 100 Mpc. This results in 15 broad-line Sy1s, 2 narrow-line Sy1s, 22 HBLRs, 16 non-HBLRs and 14 Sy2s without spectropolarimetry (Table 2). They cover 23/25 of the local Ulvestad & Wilson sources (two Sy2s were excluded because of missing FIR data) and 42/42 of the nearby CfA Seyferts. The sample contains also some narrow-line Sy1s as marked in Table 3; because they do not differ from broad-line Sy1s in any properties analysed here, we do not plot them with extra symbols in the diagrams. Our sample is not homogeneously observed, but it can be considered as fairly random selection suited to study the Sy2 dichotomy.
4 Results and Discussion
4.1 Nuclear dust emission
Figure 3 shows the nuclear MIR flux normalised by [OIII] plotted against the IRAS 25m/60m colours. All along the range of IRAS colours the bulk of Sy sources lies in the same MIR/[OIII] range. This is also the case for the different Sy types,. We note that the few narrow-line Sy1s of our sample fall in the same range covered by Sy1s. Three sources (Cen A, Circinus and MCG-6-30-15) show exceptionally high MIR / [OIII] ratios. They are known to be contaminated by strong dust enshrouded starbursts and we have excluded them from the analysis. This decision does not affect the conclusions of this paper.
The statistics for the MIR / [OIII] distributions are listed in Table 2. Taking into account the broad dispersions there is no statistically significant evidence that any of the Seyfert types shows different MIR / [OIII] distributions. In Fig. 3 the dotted horizontal lines illustrate, for example, the 3- range around the mean flux ratio for HBLRs. Only one source (NGC 7682) lies slightly below the 3- range. Remarkably it is a HBLR indicating that the unified model is compatible with rather low MIR / [OIII] values and that naked AGN may have to be searched for at MIR / [OIII] 10 Jy / erg/s/cm. NGC 5427, for which we used the 12 m upper flux limit of 10 mJy inferred from Spitzer, shows relatively little nuclear dust emission. But even when taking the VISIR upper limit of 2.3 mJy the evidence that NGC 5427 is a naked Sy2 is still marginal. To our knowledge this source has not yet been observed by spectropolarimetry.

For comparison and to get an impression, where a naked Sy has to be looked at, also the location of M 87 is plotted. Its radio jet dominates the nuclear MIR flux (Fig. 2 in Whysong and Antonucci 2004); we here conservatively adopt that at most 5% of the entire nuclear 11.7 m flux of 13 mJy is due to dust. Then M 87 lies about 15- below the average MIR/[OIII] ratio of each Seyfert type. Note already M 87’s exceptionaly low nuclear L in Figure 2, middle. Using MIR data from Subaru and Spitzer, Perlman et al. (2007) reach the same conclusions about M 87 as Whysong and Antonucci (2004). Also, M 87 has rather a LINER than a high-excitation [OIII] bright Seyfert spectrum. If it were a Seyfert with a stronger [OIII], we expect it to be placed at even lower MIR/[OIII]. In addition to Whysong and Antonucci’s diagnosis, which involved ADAF and jet models, our comparison with Seyfert galaxies argues strongly in favor of the naked AGN nature of M 87. And looking the other way around, we conclude that none individual of the Seyfert galaxies falls sufficiently below the low end of the MIR / [OIII] distributions requird to provide evidence for being a naked AGN.
While the statistical rms of the MIR and [OIII] measurements is in the order of 10-30%, we here adopted a factor 3 as uncertainty for MIR/[OIII] in order to account also for systematic effects. For example we used the [OIII] fluxes as observed and neither extinction nor aperture corrected, since such corrections are uncertain and depend on assumptions about the source geometry. Nevertheless we have performed several tests to correct for extinction in the [OIII] fluxes on the basis of the H / H ratio. With and without extinction correction the studied distributions are quite broad and do not reveal any reliable trends which would be different from those already seen in Fig. 3. One reason for the apparent ”failure” of [OIII] extinction corrections using H / H ratios may be that the published fluxes refer to observed values. So far they have not been corrected for potentially significant stellar absorption, with exception of a few (20) sources of our sample (Gu et al. 2006). As regards [OIII] flux losses due to small slit widths, we did not find any trends of MIR/[OIII] with distance. This suggests that aperture effects are similar for all sources and largely cancel out in the flux ratios.
As an alternative to potentially incomplete or erroneous extinction and aperture corrections, we discuss the effects any extinction may have on the MIR/[OIII] ratios and on our conclusions:
1) If a source is substantially obscured at [OIII] and not at MIR wavelengths, it will be shifted towards higher MIR / [OIII] values. But then by assumption this source cannot be naked, since there must be nuclear dust to obscure the [OIII] emission. The dust must be located in a torus/disk like structure, in order to explain the bipolar morphology of the [OIII] emission observed even in some non-HBLRs (for example Mrk 573 or NGC 1386, see Schmitt et al. 2003).
2) Many Sy2 nuclei, also some among our sample, show the well known silicate 9.7 m absorption. If its emission becomes optically thick at MIR wavelengths with increasing (i.e. more edge-on) inclination of the torus, one may expect that the Sy2s exhibit a lower MIR / [OIII] distribution than the Sy1s. But in that case also the nuclear [OIII] emission may be affected by extinction. This was shown for powerful 3CR radio galaxies by polarised [OIII] (di Serego Aligieri et al. 1997) and by suppressed [OIII]/[OIV] (Haas et al. 2005) so that the net MIR / [OIII] ratio tends to higher values. Future Spitzer MIR spectra will provide further clues to this issue.
These considerations about extinction lead us to conclude that the basic results derived here from observed MIR / [OIII] flux ratios are valid. The important conclusions from the MIR / [OIII] distributions are 1) that there is no clear indication of naked Seyfert nuclei and 2) that the distributions of cool non-HBLRs are comparable to those of broad- and narrow-line Sy1s and warm HBLRs.
4.2 Mid- and far-IR contribution of AGN and host
An important corollary from Figure 3 is: the nuclear dust emission is independent of the IRAS 25m/60m colours of the entire galaxies. In order to understand the Seyfert-2 dichotomy we try to disentangle the AGN and host contributions to the IR spectral energy distributions (SEDs) and to explore the origin of the cool IRAS 25m/60m colours. Therefore we consider the nuclear MIR flux concentration (Fig. 4).
Firstly, we consider the MIR concentration and the F25/F60 ratios of the entire galaxies irrespective of the Seyfert types. Note that AGN heated dust contributes mainly to the 3–40m emission and its SED decreases longward of 40m. The main feature of this diagram (Fig. 4) is 1) that sources with warm F25/F60 also have high MIR concentration (20%) and 2) that sources with low MIR concentration have cool F25/F60, hence they lie in the lower left corner of Figure 4. These two populations can be understood in a simple scheme: 1) a powerful AGN dominates the MIR emission of the host galaxy and leads to warm F25/F60, if it can also heat a substantial amount of dust in the host galaxy. 2) a nucleus, which is faint relative to the cool host, has both a low MIR concentration and a cool F25/F60 ratio.

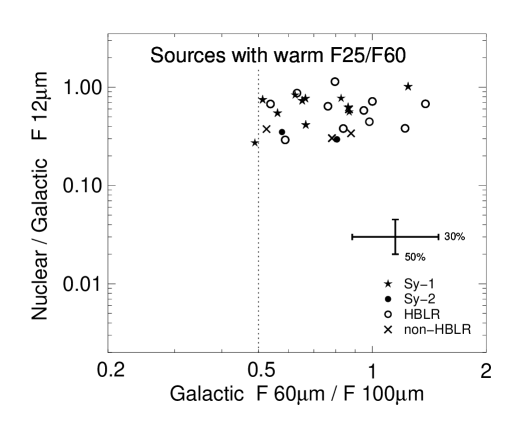

However, the sources at high concentration and cool F25/F60 ratio, in the upper left corner of that diagram, are unexpected at a first glance and deserve a refined consideration. Their nuclear contribution to the entire F12 is relatively strong indicating a high AGN/host contrast, but their host SED is obviously dominated by a large amount of cold dust. In fact, the sources with cool F25/F60 and high nuclear MIR concentration show also cooler F60/F100 than the warm F25/F60 sources (Fig. 5). Consequently the sources with high MIR concentration (20%) may show a range of overall warm to cool F25/F60 and F60/F100, depending on the amount and distribution of cold dust in the host. Since dust mass increases with decreasing dust temperature, the cool sources have more dust per AGN strength than warm ones.
Now we consider the distribution of the Seyfert types in Figure 4: All Sy1s and virtually all (18/20) HBLR Sy2s emit more than 20% of their total MIR flux in the nucleus The non-HBLR Sy2s tend to have both cooler F25/F60 and less concentration of MIR flux, reaching down to about 1%. The Sy2s not yet observed by spectropolarimetry are spread over the entire range of HBLRs and non-HBLRs. While it is known that warm Seyferts exhibit a higher nuclear flux concentration than cool Seyferts (e.g. Roche et al. 1991), our diagram also shows the overall difference in the distribution of HBLRs and non-HBLRs. However, if we consider the MIR concentration of the cool sources only, then HBLRs and non-HBLRs show more similar distributions, at least with regard to the low number statistics. Notably, our sample contains also cool Sy1s, but all four of them have high MIR concentration (20%). Table 2 lists the statistics of the distribution of MIR concentration for each type. Many non-HBLRs have a higher FIR luminosity and lower nuclear MIR luminosity than the bulk of the other Seyfert sources (Figure 2, Table 2).

The results remain unchanged, when using IRAS F12 / F60 instead of IRAS F25 / F60 or nuclear F12 / galactic F25 instead of nuclear F12 / galactic F12. Also we did not find any trend of MIR concentration with distance, indicating that on the scale of 100-500 pc for nucleus and 10-30 kpc for the entire galaxies the differences of MIR concentration are real and not caused by an observational bias. The same applies for the radio concentration discussed further below.
When combining the type distribution in Figure 4 with the SED properties the main conclusion is that compared with the bulk of HBLRs and Sy1s the non-HBLRs are preferentially cool F25/F60 sources, where the AGN/host contrast is low or where the host has a higher dust mass per AGN strength. Both cases argue in favour of observational biases as explanation for the decreasing detection rate of polarised BLRs in cool F25/F60 sources.
4.3 Intrinsically weak or obscured nuclei
So far, we have considered the observed properties of the sources, but for the Seyfert-2 dichotomy intrinsic properties are relevant. The fact that cool sources seem to have more dust than the warm ones calls for additional clues with respect to extinction, not only of the nucleus, but also of the more extended scattering region required for spectropolarimetric detection of broad lines.
Moderate extinction (A 10) may be indicated by the Balmer ratios of the narrow lines, if the line fluxes are corrected for stellar absorption. But this correction is not available for our entire sample. Nevertheless, the distribution of the observed Balmer ratios, as listed in Table 3, is indistinguishable for non-HBLR and HBLR Sy2s of our sample. This confirms the finding by several authors – also based on X-ray spectra – that non-HBLR and HBLR samples exhibit similar column densities and obscuration (e.g. Alexander 2001, Gu et al. 2001, Tran 2003).
The sources with cool IRAS colours and low MIR concentration could contain either an intrinsically weak AGN compared with the host galaxy, and/or these nuclei, in principle, could suffer from extreme MIR flux obscuration by a factor up to 1000. In order to discriminate between these two possibilities, the silicate 9.7m absorption feature may provide valuable clues. But ground-based 8-13 m spectra of high-spatial resolution do not cover a sufficient wavelength range, in order to determine the continuum baseline free from PAH contributions (e.g. Roche et al. 1991) so that other L or M band photometry has to be involved; and suitable Spitzer spectra for our sample are still being observed and under evaluation by the proposers (e.g. Buchanan et al. 2006).
Therefore we here consider – as far as data are available – the nuclear to total radio flux at 1.4 GHz, which arises from AGN as well as star formation in the entire galaxies and which is essentially unaffected by extinction. The spatial resolutions of the FIRST peak flux and the NVSS total flux are 5 and 40 (FWHM), roughly comparable to the resolution of the ground-based and IRAS MIR data, respectively. Figure 6 depicts the MIR and radio concentration of the cool sources.
The sources with lowest radio concentration ( 0.1) show also lowest MIR concentration. If they were intrinsically much more luminous and their low MIR concentration were due to MIR extinction, then – due to the lower radio extinction – one would expect to find them still at high radio concentration. Since this is not the case we conclude that their AGN are intrinsically weak compared to the host galaxy.
But at intermediate and high radio concentration (FIRST/NVSS 0.1) two of the cool sources have a lower MIR concentration. NGC2639 has a high H / H ratio ( 15), and both NGC2639 and NGC5929 show tentative 9.7 m silicate absorption in their Spitzer spectra, which we inspected from the Spitzer archive. This suggests that in these few sources a relatively weak AGN is not the only explanation and that also extinction plays a role.
We note in addition that most of the warm sources (F25/F60 0.25) show high concentration in both MIR and radio. If plotted in Figure 6, they would lie close to unity, a few (both HBLRs and non-HBLRs) tending towards lower MIR than radio concentration similar as NGC 2639 does. The relation between MIR and radio concentration and the fact that only few sources deviate from it also argue against the general explanation of the cool F25/F60 ratio by a high inclination of the torus as was recently again proposed by Zhang & Wang (2006).
5 Conclusions
The science verification observations of VISIR at the VLT establish the excellent photometric agreement with previous measurements of Seyfert nuclei. The VISIR data suggest that almost all of the nuclear 12 m flux seen in larger 5 apertures comes from a much more compact area FWHM 035.
In order to explore the nuclear dust emission of Seyfert nuclei, we present here a comparison between mid-infrared photometry and [OIII] at matching spatial resolution. The MIR / [OIII] distributions argue against the existence of naked Seyferts, in particular when compared with the dust-poor nucleus of the narrow-line radio galaxy M 87. The distributions of non-HBLRs are comparable to those of broad- and narrow-line Sy1s and HBLRs. Our results suggests that all Seyfert nuclei possess the same physical structure, where the central engine is surrounded by a dust torus as proposed in orientation-based unified models.
While the presence of a dust torus is a necessary requirement for a hidden BLR, our data do not allow to infer directly that such a BLR exist. Some non-HBLRs may be misaligned narrow line Sy1s. On the other hand, the cool non-HBLRs house on average an intrinsically less luminous AGN and show a lower AGN/host contrast. In addition to these observational handicaps, the non-HBLRs are surrounded by the same or potentially higher absolute amount of obscuring material as do the brighter HBLR nuclei. This suggests that in most cases the failure to detect a hidden BLR in current spectropolarimetric observations is an apparent effect caused by observational biases.
The nuclear continuum of the non-HBLRs should be polarized, since the [OIII] emission has to be excited by nuclear photons. So far the observed polarisation is less than 0.5%. Then the anticipated high nuclear polarisation may be diluted by starlight or by interstellar polarisation in the host galaxy or by unfavourable scattering geometries, which also prevent the detection of polarised broad lines.
Acknowledgements.
We thank Roberto Maiolino for sending us his compilation of ground-based N-band observations, Stuart Lumsden for his critical, constructive referee report, and Nicola Bennert, Robert Antonucci and Andreas Efstathiou for intriguing comments on the manuscript. This work substantially benefitted from SIMBAD and the NASA Extragalactic Database NED. M. H. was supported by Nordrhein–Westfälische Akademie der Wissenschaften, and H. H. by Deutsche Forschungsgemeinschaft via Sonderforschungsbereich 439.| (1) | (2) | (3) | (4) | (5) | (6) . | (7) | (8) | (9) | (10) | (11) | (12) | (13) | (14) | (15) | (16) |
| object | D | type | HBLR | F | ref | IRAS 12 | IRAS 25 | IRAS 60 | IRAS 100 | [OIII] | H | H | ref | FIRST | NVSS |
| Mpc | mJy | Jy | Jy | Jy | Jy | narrow | narrow | mJy | mJy | ||||||
| VISIR at 11.25 m: | |||||||||||||||
| CenA | 7.8 | 2.0 | ? | 946 | 1 | 13.260 | 17.260 | 162.200 | 313.800 | 120 | 49 | 275 | 10 | 5700.0 | 278000.0 |
| ESO141-G055 | 158.4 | 1.0 | 169 | 1 | 0.310 | 0.380 | 0.610 | 1.000 | 1644 | 3 | 6.9 | ||||
| IC5063 | 49.0 | 2.0 | yes | 752 | 1 | 1.110 | 3.940 | 5.870 | 4.250 | 5642 | 629 | 3711 | 3 | 2100.0 | |
| MCG-3-34-64 | 71.8 | 1.8 | yes | 674 | 1 | 0.940 | 2.970 | 6.200 | 6.200 | 15073 | 780 | 6326 | 3 | 274.9 | |
| MCG-6-30-15 | 33.4 | 2.0 | ? | 392 | 1 | 0.380 | 0.810 | 1.090 | 1.090 | 30 | 1 | 31 | 2 | 1.7 | |
| Mrk509 | 151.2 | 1.2 | 235 | 1 | 0.315 | 0.702 | 1.364 | 1.521 | 5400 | 3 | 18.6 | ||||
| Mrk590 | 115.3 | 1.2 | 90 | 1 | 0.191 | 0.221 | 0.489 | 1.450 | 530 | 2 | 6.9 | 16.2 | |||
| Mrk1239 | 86.6 | 1.5 | NLS1 | 660 | 1 | 0.650 | 1.140 | 1.330 | 1.070 | 4675 | 3 | 58.7 | 62.2 | ||
| NGC2992 | 33.2 | 1.9 | yes | 312 | 1 | 0.630 | 1.380 | 7.510 | 17.200 | 3600 | 330 | 2299 | 2 | 226.2 | |
| NGC3783 | 42.0 | 1.0 | 645 | 1 | 0.840 | 2.096 | 3.260 | 4.900 | 7626 | 3 | 43.6 | ||||
| NGC4507 | 51.0 | 2.0 | yes | 589 | 1 | 0.517 | 1.387 | 4.300 | 5.400 | 8284 | 1049 | 3947 | 3 | 66.1 | |
| NGC5427 | 37.7 | 1.9 | ? | 10 | 1 | 0.283 | 0.623 | 6.870 | 16.310 | 540 | 54 | 160 | 12 | 3.3 | 82.8 |
| NGC5995 | 110.0 | 2.0 | yes | 332 | 1 | 0.390 | 0.859 | 3.646 | 6.632 | 740 | 120 | 2339 | 18 | 30.0 | |
| NGC7213 | 25.1 | 1.5 | 250 | 1 | 0.606 | 0.742 | 2.000 | 3.000 | 1301 | 3 | 247.0 | ||||
| NGC7314 | 20.5 | 1.9 | ? | 74 | 1 | 0.267 | 0.578 | 3.736 | 14.150 | 609 | 64 | 1300 | 12 | 31.0 | |
| PG2130+099 | 282.6 | 1.0 | 160 | 1 | 0.186 | 0.380 | 0.479 | 0.485 | 1042 | 3 | 6.0 | ||||
| other 10-12 m obs. | |||||||||||||||
| 3C120 | 144.9 | 1.0 | 109 | 4 | 0.330 | 0.710 | 1.310 | 2.640 | 3045 | 3 | 3439.0 | ||||
| Circinus | 6.2 | 2.0 | yes | 4100 | 3 | 18.800 | 68.440 | 248.700 | 315.850 | 832 | 56 | 1088 | 7 | 1500.0 | |
| IRAS00521-7054 | 310.4 | 2.0 | yes | 219 | 8 | 0.281 | 0.803 | 1.020 | 0.830 | 768 | 96 | 581 | 3 | 54.1 | |
| IRAS01475-0740 | 76.7 | 2.0 | yes | 186 | 5 | 0.308 | 0.900 | 1.048 | 6.500 | 530 | 101 | 777 | 3 | 318.2 | |
| IRAS01527+0622 | 75.6 | 1.9 | ? | 15 | 5 | 0.200 | 0.240 | 1.190 | 2.000 | 599 | 129 | 12 | 16.0 | ||
| IRAS03362-1641 | 162.5 | 2.0 | no | 148 | 4 | 0.205 | 0.497 | 1.058 | 1.100 | 179 | 29 | 171 | 3 | 9.0 | |
| IRAS03450+0055 | 135.9 | 1.5 | NLS1 | 170 | 5 | 0.283 | 0.506 | 0.470 | 0.700 | 999 | 16 | 32.0 | |||
| IRAS05189-2524 | 188.2 | 2.0 | yes | 498 | 5 | 0.740 | 3.470 | 13.250 | 12.520 | 390 | 49 | 299 | 6 | 28.8 | |
| IRAS22017+0319 | 273.8 | 2.0 | yes | 137 | 4 | 0.287 | 0.722 | 1.160 | 1.120 | 2183 | 235 | 893 | 3 | 16.1 | |
| IRAS22377+0747 | 109.0 | 1.8 | ? | 63 | 5 | 0.203 | 0.343 | 0.826 | 2.480 | 1439 | 530 | 3281 | 3 | 15.1 | |
| MCG-2-8-39 | 130.9 | 2.0 | yes | 114 | 5 | 0.200 | 0.475 | 0.508 | 0.770 | 1829 | 117 | 365 | 3 | 8.7 | |
| Mrk3 | 58.5 | 2.0 | yes | 290 | 7 | 0.760 | 3.180 | 4.270 | 3.500 | 10699 | 721 | 4246 | 3 | 1100.4 | |
| Mrk9 | 176.0 | 1.5 | 235 | 5 | 0.217 | 0.500 | 0.960 | 1.100 | 1089 | 12 | 2.3 | 3.6 | |||
| Mrk79 | 96.7 | 1.2 | 255 | 5 | 0.306 | 0.762 | 1.500 | 2.400 | 3700 | 12 | 10.0 | 20.5 | |||
| Mrk279 | 133.4 | 1.5 | 76 | 7 | 0.205 | 0.333 | 1.255 | 2.200 | 999 | 2 | 23.2 | ||||
| Mrk334 | 95.6 | 1.8 | no | 162 | 5 | 0.225 | 1.050 | 6.000 | 8.000 | 490 | 330 | 1599 | 2 | 27.9 | |
| Mrk335 | 112.6 | 1.0 | NLS1 | 210 | 5 | 0.270 | 0.450 | 0.350 | 0.570 | 9499 | 12 | 7.3 | |||
| Mrk348 | 65.1 | 2.0 | yes | 117 | 4 | 0.308 | 0.835 | 1.290 | 1.540 | 3594 | 258 | 1243 | 3 | 292.2 | |
| Mrk463E | 223.9 | 2.0 | yes | 395 | 4 | 0.500 | 1.570 | 2.184 | 1.924 | 5631 | 624 | 2643 | 2 | 349.5 | 380.5 |
| Mrk530 | 129.3 | 1.5 | 77 | 7 | 0.158 | 0.241 | 0.852 | 2.040 | 290 | 2 | |||||
| Mrk573 | 74.6 | 2.0 | no | 167 | 9 | 0.280 | 0.850 | 1.240 | 1.430 | 9273 | 811 | 3166 | 3 | 24.0 | |
| Mrk607 | 38.3 | 2.0 | no | 100 | 5 | 0.330 | 1.060 | 2.150 | 2.750 | 1224 | 135 | 576 | 3 | 6.0 | |
| Mrk618 | 156.4 | 1.0 | 270 | 5 | 0.336 | 0.788 | 2.700 | 4.240 | 1602 | 3 | 17.0 | ||||
| Mrk704 | 128.0 | 1.5 | 270 | 5 | 0.350 | 0.530 | 0.400 | 0.360 | 850 | 2 | 4.9 | 6.1 | |||
| Mrk789 | 138.0 | 1.0 | 55 | 5 | 0.145 | 0.617 | 3.300 | 5.000 | 450 | 2 | 25.4 | 35.2 | |||
| Mrk817 | 138.0 | 1.5 | 220 | 5 | 0.380 | 1.420 | 2.330 | 2.350 | 1400 | 2 | 8.1 | 11.2 | |||
| Mrk841 | 160.3 | 1.5 | 139 | 5 | 0.192 | 0.431 | 0.600 | 0.480 | 2499 | 2 | -14.8 | ||||
| Mrk897 | 115.1 | 2.0 | ? | 60 | 5 | 0.240 | 0.500 | 2.800 | 4.670 | 877 | 58 | 177 | 5 | 16.9 | |
| Mrk993 | 67.3 | 2.0 | ? | 18 | 9 | 0.131 | 0.129 | 0.296 | 1.320 | 299 | 51 | 279 | 2 | 5.4 | |
| Mrk1040 | 72.2 | 1.5 | 333 | 5 | 0.610 | 1.315 | 2.555 | 4.551 | 748 | 3 | 13.3 | ||||
| NGC424 | 50.9 | 2.0 | yes | 490 | 12 | 1.100 | 1.740 | 1.790 | 1.823 | 4199 | 910 | 12 | 23.0 | ||
| NGC513 | 85.0 | 2.0 | yes | 100 | 4 | 0.166 | 0.277 | 1.935 | 4.500 | 350 | 51 | 264 | 18 | 52.9 | |
| NGC985 | 190.8 | 1.0 | 143 | 5 | 0.207 | 0.523 | 1.381 | 1.890 | 2220 | 3 | 4.7 | 15.3 | |||
| NGC1068 | 16.3 | 2.0 | yes | 25500 | 4 | 39.840 | 87.570 | 196.370 | 257.370 | 48336 | 3039 | 13041 | 3 | 1855.3 | 4848.1 |
| NGC1241 | 58.5 | 2.0 | no | 79 | 5 | 0.240 | 0.447 | 3.557 | 10.300 | 3700 | 660 | 1920 | 11 | 2.9 | 20.0 |
| NGC1365 | 23.5 | 1.8 | ? | 510 | 2 | 3.400 | 10.080 | 76.100 | 142.500 | 619 | 338 | 2960 | 10 | 375.9 | |
| NGC1386 | 12.4 | 2.0 | no | 400 | 3 | 0.520 | 1.460 | 5.920 | 9.550 | 7999 | 530 | 2489 | 1 | 37.1 | |
| NGC1667 | 65.7 | 2.0 | no | 8 | 5 | 0.430 | 0.677 | 5.950 | 14.900 | 637 | 183 | 1785 | 9 | 75.8 | |
| NGC2110 | 33.6 | 2.0 | yes | 198 | 11 | 0.349 | 0.840 | 4.130 | 5.680 | 1700 | 270 | 2200 | 2 | 298.8 | |
| NGC2273 | 26.4 | 2.0 | yes | 185 | 10 | 0.440 | 1.360 | 6.410 | 9.550 | 3299 | 330 | 12 | 62.6 | ||
| NGC2639 | 48.1 | 1.9 | ? | 10 | 5 | 0.160 | 0.209 | 1.980 | 7.050 | 139 | 11 | 179 | 4 | 99.3 | 115.0 |
| NGC3031 | 3.3 | 1.8 | yes | 128 | 4 | 5.860 | 5.420 | 44.730 | 174.000 | 999 | 306 | 2800 | 4 | 86.0 | |
| NGC3080 | 155.8 | 1.0 | 16 | 5 | 0.091 | 0.153 | 0.349 | 0.874 | 129 | 2 | 2.9 | ||||
| NGC3081 | 34.4 | 2.0 | yes | 436 | 12 | 0.500 | 0.940 | 3.160 | 5.000 | 3899 | 290 | 1300 | 2 | 5.4 | |
| NGC3185 | 17.5 | 2.0 | ? | 20 | 5 | 0.154 | 0.140 | 1.400 | 3.670 | 540 | 94 | 637 | 4 | 1.8 | 5.3 |
| NGC3227 | 16.6 | 1.5 | 225 | 4 | 0.667 | 1.760 | 7.820 | 17.500 | 8199 | 2 | 74.4 | 97.5 | |||
| NGC3281 | 46.1 | 2.0 | no | 309 | 12 | 0.910 | 2.630 | 6.930 | 7.890 | 550 | 49 | 2 | 80.1 | ||
| NGC3362 | 120.9 | 2.0 | no | 12 | 5 | 0.150 | 0.350 | 2.130 | 3.150 | 499 | 49 | 252 | 13 | 5.5 | 16.6 |
| NGC3516 | 38.1 | 1.5 | 230 | 7 | 0.410 | 1.010 | 1.850 | 2.130 | 2700 | 2 | 31.3 | ||||
| NGC3660 | 53.1 | 2.0 | no | 33 | 5 | 0.193 | 0.224 | 1.870 | 4.530 | 335 | 111 | 559 | 9 | 12.3 | |
| NGC3786 | 38.5 | 1.8 | ? | 59 | 5 | 0.150 | 0.200 | 2.000 | 5.000 | 839 | 99 | 12 | 10.6 | 18.6 | |
| NGC3982 | 15.9 | 2.0 | no | 19 | 5 | 0.507 | 0.833 | 6.567 | 15.230 | 1879 | 68 | 490 | 4 | 3.1 | 56.4 |
| NGC4051 | 10.0 | 1.5 | NLS1 | 260 | 7 | 0.855 | 1.590 | 7.100 | 23.900 | 3899 | 4 | 12.3 | 94.4 | ||
| NGC4151 | 14.3 | 1.5 | 1520 | 4 | 1.968 | 4.833 | 6.315 | 7.640 | 115999 | 4 | 290.8 | 359.6 | |||
| NGC4235 | 34.7 | 1.0 | 34 | 5 | 0.125 | 0.156 | 0.316 | 0.646 | 240 | 12 | 4.7 | 12.2 | |||
| NGC4253 | 55.9 | 1.0 | 241 | 5 | 0.385 | 1.290 | 4.020 | 4.660 | 4535 | 3 | 38.2 | 38.1 | |||
| NGC4388 | 36.3 | 2.0 | yes | 290 | 3 | 0.996 | 3.420 | 10.000 | 17.000 | 5642 | 479 | 2744 | 3 | 24.4 | 119.4 |
| NGC4501 | 32.8 | 2.0 | no | 15 | 5 | 2.290 | 2.980 | 19.680 | 62.970 | 340 | 27 | 229 | 4 | 1.1 | 277.1 |
| NGC4593 | 38.8 | 1.0 | 257 | 4 | 0.344 | 0.808 | 3.050 | 5.947 | 1343 | 3 | 2.8 | 4.4 | |||
| NGC4968 | 42.6 | 2.0 | ? | 115 | 5 | 0.390 | 1.000 | 2.370 | 2.940 | 1773 | 165 | 989 | 3 | 34.5 |
| (1) | (2) | (3) | (4) | (5) | (6) . | (7) | (8) | (9) | (10) | (11) | (12) | (13) | (14) | (15) | (16) |
|---|---|---|---|---|---|---|---|---|---|---|---|---|---|---|---|
| object | D | type | HBLR | F | ref | IRAS 12 | IRAS 25 | IRAS 60 | IRAS 100 | [OIII] | H | H | ref | FIRST | NVSS |
| Mpc | mJy | Jy | Jy | Jy | Jy | narrow | narrow | mJy | mJy | ||||||
| NGC5033 | 12.5 | 1.8 | ? | 24 | 5 | 1.380 | 2.000 | 16.000 | 51.000 | 530 | 55 | 530 | 2 | 1.4 | 121.5 |
| NGC5135 | 59.3 | 2.0 | no | 157 | 5 | 0.638 | 2.380 | 16.800 | 30.900 | 2190 | 426 | 2610 | 8 | 199.8 | |
| NGC5194 | 6.6 | 2.5 | no | 70 | 4 | 7.210 | 9.560 | 97.000 | 220.000 | 1199 | 80 | 700 | 4 | 6.6 | 427.1 |
| NGC5252 | 99.8 | 1.9 | yes | 28 | 5 | 0.080 | 0.140 | 0.850 | 1.210 | 2190 | 370 | 1380 | 10 | 11.7 | 16.3 |
| NGC5256 | 121.9 | 2.0 | no | 30 | 5 | 0.230 | 0.980 | 7.200 | 10.500 | 229 | 49 | 231 | 4 | ||
| NGC5273 | 15.3 | 1.9 | ? | 42 | 5 | 0.120 | 0.290 | 0.900 | 1.560 | 220 | 20 | 66 | 2 | 2.6 | 3.5 |
| NGC5283 | 44.9 | 2.0 | no | 15 | 5 | 0.040 | 0.130 | 0.210 | 0.400 | 870 | 108 | 345 | 14 | 13.2 | |
| NGC5347 | 33.6 | 2.0 | yes | 208 | 5 | 0.308 | 0.962 | 1.420 | 2.640 | 447 | 49 | 270 | 3 | 3.2 | 5.6 |
| NGC5506 | 26.6 | 1.9 | yes | 720 | 5 | 1.240 | 4.170 | 8.420 | 8.870 | 5212 | 569 | 3920 | 9 | 310.0 | 338.8 |
| NGC5548 | 74.5 | 1.5 | 292 | 4 | 0.400 | 0.769 | 1.070 | 1.640 | 3599 | 3 | 11.0 | 28.2 | |||
| NGC5643 | 17.2 | 2.0 | no | 310 | 3 | 1.100 | 3.600 | 20.000 | 38.000 | 7999 | 480 | 2900 | 2 | 30.0 | 200.0 |
| NGC5674 | 108.8 | 1.9 | ? | 24 | 5 | 0.144 | 0.280 | 1.400 | 3.700 | 1350 | 338 | 1659 | 10 | 4.6 | 34.2 |
| NGC5695 | 61.0 | 2.0 | no | 10 | 5 | 0.100 | 0.128 | 0.560 | 1.790 | 550 | 40 | 199 | 13 | 1.2 | 6.3 |
| NGC5929 | 35.8 | 2.0 | yes | 24 | 5 | 0.430 | 1.620 | 9.140 | 13.690 | 930 | 240 | 1300 | 2 | 65.4 | 108.4 |
| NGC5940 | 149.1 | 1.0 | 26 | 5 | 0.167 | 0.115 | 0.743 | 1.750 | 350 | 17 | 9.0 | ||||
| NGC5953 | 28.2 | 2.0 | ? | 24 | 5 | 0.530 | 1.160 | 11.550 | 19.890 | 629 | 330 | 2399 | 12 | 16.7 | 91.4 |
| NGC6104 | 123.0 | 1.5 | 12 | 5 | 0.980 | 0.840 | 0.500 | 1.750 | 132 | 13 | 6.4 | ||||
| NGC6814 | 22.4 | 1.5 | 166 | 6 | 0.920 | 1.040 | 6.530 | 19.670 | 1199 | 2 | 49.7 | ||||
| NGC7130 | 70.0 | 2.0 | no | 290 | 13 | 0.580 | 2.160 | 16.700 | 25.900 | 270 | 89 | 580 | 6 | 189.7 | |
| NGC7172 | 37.4 | 2.0 | no | 107 | 4 | 0.420 | 0.880 | 5.760 | 12.420 | 99 | 20 | 140 | 19 | 36.8 | |
| NGC7465 | 28.3 | 2.0 | ? | 52 | 5 | 0.260 | 0.480 | 3.820 | 8.140 | 383 | 137 | 660 | 15 | 19.1 | |
| NGC7469 | 70.8 | 1.2 | 565 | 2 | 1.350 | 5.789 | 25.870 | 34.900 | 8399 | 2 | 180.5 | ||||
| NGC7582 | 22.6 | 2.0 | yes | 690 | 3 | 1.620 | 7.400 | 52.000 | 83.000 | 2999 | 1199 | 9999 | 2 | 270.0 | |
| NGC7674 | 126.6 | 2.0 | yes | 260 | 3 | 0.680 | 1.920 | 5.360 | 8.300 | 7178 | 637 | 3306 | 3 | 220.9 | |
| NGC7682 | 74.4 | 2.0 | yes | 18 | 5 | 0.050 | 0.080 | 0.350 | 0.800 | 2299 | 270 | 1199 | 10 | 59.8 | |
| UGC6100 | 129.2 | 2.0 | no | 34 | 5 | 0.145 | 0.202 | 0.574 | 1.500 | 2900 | 209 | 949 | 18 | 7.3 | 11.3 |
Col(1): sources marked by are contained in the CfA Seyfert sample (Huchra & Burg 1992).
dropped from the analysis because of meaningless IRAS F12 and F25 upper limits, which are high relative to other quantities.
Col (2): We used a cosmology with H = 71 km s Mpc, = 0.27 and = 0.73.
Col (4): references are Heisler et al. (1997), Lumsden et al. (2001, 2004), Moran et al. (2000, 2001, 2007), Tran (2003), see compilation by Gu & Huang (2002). Sources marked by show broad Pa lines in ordinary near-infrared spectroscopy, but no optical spectropolarimetric BLR (NGC 5506: Nagar et al. 2002, NGC 7582: Lumsden priv. comm., see also Aretxaga et al. 1999).
Col (5): in case of non-detections 3- upper limits are listed. denotes barely resolved sources. value derived from Spitzer-IRS, since the 28 mJy in 6 aperture by Maiolino et al. (1995) appear too low.
Col (6): references are 1 = VISIR, this work 2 = Galliano et al. (2005b, 12 m TIMMI2/ESO 3.6m), 3 = Siebenmorgen et al. (2004, 12 m TIMMI2/ESO 3.6m), 4 = Gorjian et al. (2004, 10 m MIRLIN/Palomar 5m), 5 = Maiolino et al. (1995, 53 10 m Bolometer/MMT), 6 = Glass et al. (1982, 75 12 m Bolometer/ESO 3.6m), 7 = Rieke (1978), 8 = Frogel & Elias (1987), 9 = Edelson et al. (1987), 10 = Devereux (1987), 11 = Lawrence et al. (1985), 12 = Boisson & Durret (1986), 13 = Wynn-Williams & Becklin (1993).
Cols (7-10): IRAS photometry was taken from NED, mostly Sanders et al. 2003, if available, otherwise from Faint Source Catalog, the source of photometry had no significant effect on the analysed quantities F25/F60 or nuclear/galactic F12. For some sources the photometry was estimated/improved: for NGC 3362, NGC 5252, NGC 5283, Mrk 334, IRAS 01527+0622 from ISO (Pérez Garcia & Rodríguez Espinosa 2001), and for Mrk 897, NGC 2992, NGC 3081, NGC 3783, NGC 3786, NGC 5427, NGC 7213, NGC 7682 from Spitzer data (this work).
Col (11-13): the line fluxes are listed in units 10 erg/s/cm.
Col (14): References are 1 = Bennert et al. (2006), 2 = Dahari & de Robertis (1988), 3 = de Grijp et al. (1992), 4 = Ho et al. (1995), 5 = Kewley et al. (2001), 6 = Kim et al. (1995), 7 = Oliva et al. (1994), 8 = Phillips et al. (1983), 9 = Storchi-Bergmann et al. (1995), 10 = Véron-Cetty & Véron (2006), 11 = Vaceli et al. (1997), 12 = Whittle (1992), 13 = SDSS DR5, 14 = SAO Z-machine archive (http://tdc-www.harvard.edu/cgi-bin/arc/zsearch), 15 = Moustakas & Kennicutt (2006), 16 = Boroson & Meyers (1992), 17 = Bonatto & Pastoriza (1997), 18 = Tran (2003), 19 = Sharples et al. (1984).