Measurement of Moments of the Hadronic-Mass and -Energy Spectrum in Inclusive
Semileptonic Decays
B. Aubert
M. Bona
D. Boutigny
Y. Karyotakis
J. P. Lees
V. Poireau
X. Prudent
V. Tisserand
A. Zghiche
Laboratoire de Physique des Particules, IN2P3/CNRS et Université de Savoie, F-74941 Annecy-Le-Vieux, France
J. Garra Tico
E. Grauges
Universitat de Barcelona, Facultat de Fisica, Departament ECM, E-08028 Barcelona, Spain
L. Lopez
A. Palano
M. Pappagallo
Università di Bari, Dipartimento di Fisica and INFN, I-70126 Bari, Italy
G. Eigen
B. Stugu
L. Sun
University of Bergen, Institute of Physics, N-5007 Bergen, Norway
G. S. Abrams
M. Battaglia
D. N. Brown
J. Button-Shafer
R. N. Cahn
Y. Groysman
R. G. Jacobsen
J. A. Kadyk
L. T. Kerth
Yu. G. Kolomensky
G. Kukartsev
D. Lopes Pegna
G. Lynch
L. M. Mir
T. J. Orimoto
I. L. Osipenkov
M. T. Ronan
K. Tackmann
T. Tanabe
W. A. Wenzel
Lawrence Berkeley National Laboratory and University of California, Berkeley, California 94720, USA
P. del Amo Sanchez
C. M. Hawkes
A. T. Watson
University of Birmingham, Birmingham, B15 2TT, United Kingdom
T. Held
H. Koch
M. Pelizaeus
T. Schroeder
M. Steinke
Ruhr Universität Bochum, Institut für Experimentalphysik 1, D-44780 Bochum, Germany
D. Walker
University of Bristol, Bristol BS8 1TL, United Kingdom
D. J. Asgeirsson
T. Cuhadar-Donszelmann
B. G. Fulsom
C. Hearty
T. S. Mattison
J. A. McKenna
University of British Columbia, Vancouver, British Columbia, Canada V6T 1Z1
A. Khan
M. Saleem
L. Teodorescu
Brunel University, Uxbridge, Middlesex UB8 3PH, United Kingdom
V. E. Blinov
A. D. Bukin
V. P. Druzhinin
V. B. Golubev
A. P. Onuchin
S. I. Serednyakov
Yu. I. Skovpen
E. P. Solodov
K. Yu. Todyshev
Budker Institute of Nuclear Physics, Novosibirsk 630090, Russia
M. Bondioli
S. Curry
I. Eschrich
D. Kirkby
A. J. Lankford
P. Lund
M. Mandelkern
E. C. Martin
D. P. Stoker
University of California at Irvine, Irvine, California 92697, USA
S. Abachi
C. Buchanan
University of California at Los Angeles, Los Angeles, California 90024, USA
S. D. Foulkes
J. W. Gary
F. Liu
O. Long
B. C. Shen
L. Zhang
University of California at Riverside, Riverside, California 92521, USA
H. P. Paar
S. Rahatlou
V. Sharma
University of California at San Diego, La Jolla, California 92093, USA
J. W. Berryhill
C. Campagnari
A. Cunha
B. Dahmes
T. M. Hong
D. Kovalskyi
J. D. Richman
University of California at Santa Barbara, Santa Barbara, California 93106, USA
T. W. Beck
A. M. Eisner
C. J. Flacco
C. A. Heusch
J. Kroseberg
W. S. Lockman
T. Schalk
B. A. Schumm
A. Seiden
M. G. Wilson
L. O. Winstrom
University of California at Santa Cruz, Institute for Particle Physics, Santa Cruz, California 95064, USA
E. Chen
C. H. Cheng
F. Fang
D. G. Hitlin
I. Narsky
T. Piatenko
F. C. Porter
California Institute of Technology, Pasadena, California 91125, USA
R. Andreassen
G. Mancinelli
B. T. Meadows
K. Mishra
M. D. Sokoloff
University of Cincinnati, Cincinnati, Ohio 45221, USA
F. Blanc
P. C. Bloom
S. Chen
W. T. Ford
J. F. Hirschauer
A. Kreisel
M. Nagel
U. Nauenberg
A. Olivas
J. G. Smith
K. A. Ulmer
S. R. Wagner
J. Zhang
University of Colorado, Boulder, Colorado 80309, USA
A. M. Gabareen
A. Soffer
Now at Tel Aviv University, Tel Aviv, 69978, Israel
W. H. Toki
R. J. Wilson
F. Winklmeier
Colorado State University, Fort Collins, Colorado 80523, USA
D. D. Altenburg
E. Feltresi
A. Hauke
H. Jasper
J. Merkel
A. Petzold
B. Spaan
K. Wacker
Universität Dortmund, Institut für Physik, D-44221 Dortmund, Germany
V. Klose
M. J. Kobel
H. M. Lacker
W. F. Mader
R. Nogowski
J. Schubert
K. R. Schubert
R. Schwierz
J. E. Sundermann
A. Volk
Technische Universität Dresden, Institut für Kern- und Teilchenphysik, D-01062 Dresden, Germany
D. Bernard
G. R. Bonneaud
E. Latour
V. Lombardo
Ch. Thiebaux
M. Verderi
Laboratoire Leprince-Ringuet, CNRS/IN2P3, Ecole Polytechnique, F-91128 Palaiseau, France
P. J. Clark
W. Gradl
F. Muheim
S. Playfer
A. I. Robertson
J. E. Watson
Y. Xie
University of Edinburgh, Edinburgh EH9 3JZ, United Kingdom
M. Andreotti
D. Bettoni
C. Bozzi
R. Calabrese
A. Cecchi
G. Cibinetto
P. Franchini
E. Luppi
M. Negrini
A. Petrella
L. Piemontese
E. Prencipe
V. Santoro
Università di Ferrara, Dipartimento di Fisica and INFN, I-44100 Ferrara, Italy
F. Anulli
R. Baldini-Ferroli
A. Calcaterra
R. de Sangro
G. Finocchiaro
S. Pacetti
P. Patteri
I. M. Peruzzi
Also with Università di Perugia, Dipartimento di Fisica, Perugia, Italy
M. Piccolo
M. Rama
A. Zallo
Laboratori Nazionali di Frascati dell’INFN, I-00044 Frascati, Italy
A. Buzzo
R. Contri
M. Lo Vetere
M. M. Macri
M. R. Monge
S. Passaggio
C. Patrignani
E. Robutti
A. Santroni
S. Tosi
Università di Genova, Dipartimento di Fisica and INFN, I-16146 Genova, Italy
K. S. Chaisanguanthum
M. Morii
J. Wu
Harvard University, Cambridge, Massachusetts 02138, USA
R. S. Dubitzky
J. Marks
S. Schenk
U. Uwer
Universität Heidelberg, Physikalisches Institut, Philosophenweg 12, D-69120 Heidelberg, Germany
D. J. Bard
P. D. Dauncey
R. L. Flack
J. A. Nash
W. Panduro Vazquez
M. Tibbetts
Imperial College London, London, SW7 2AZ, United Kingdom
P. K. Behera
X. Chai
M. J. Charles
U. Mallik
V. Ziegler
University of Iowa, Iowa City, Iowa 52242, USA
J. Cochran
H. B. Crawley
L. Dong
V. Eyges
W. T. Meyer
S. Prell
E. I. Rosenberg
A. E. Rubin
Iowa State University, Ames, Iowa 50011-3160, USA
Y. Y. Gao
A. V. Gritsan
Z. J. Guo
C. K. Lae
Johns Hopkins University, Baltimore, Maryland 21218, USA
A. G. Denig
M. Fritsch
G. Schott
Universität Karlsruhe, Institut für Experimentelle Kernphysik, D-76021 Karlsruhe, Germany
N. Arnaud
J. Béquilleux
A. D’Orazio
M. Davier
G. Grosdidier
A. Höcker
V. Lepeltier
F. Le Diberder
A. M. Lutz
S. Pruvot
S. Rodier
P. Roudeau
M. H. Schune
J. Serrano
V. Sordini
A. Stocchi
W. F. Wang
G. Wormser
Laboratoire de l’Accélérateur Linéaire, IN2P3/CNRS et Université Paris-Sud 11, Centre Scientifique d’Orsay, B. P. 34, F-91898 ORSAY Cedex, France
D. J. Lange
D. M. Wright
Lawrence Livermore National Laboratory, Livermore, California 94550, USA
I. Bingham
J. P. Burke
C. A. Chavez
I. J. Forster
J. R. Fry
E. Gabathuler
R. Gamet
D. E. Hutchcroft
D. J. Payne
K. C. Schofield
C. Touramanis
University of Liverpool, Liverpool L69 7ZE, United Kingdom
A. J. Bevan
K. A. George
F. Di Lodovico
W. Menges
R. Sacco
Queen Mary, University of London, E1 4NS, United Kingdom
G. Cowan
H. U. Flaecher
D. A. Hopkins
S. Paramesvaran
F. Salvatore
A. C. Wren
University of London, Royal Holloway and Bedford New College, Egham, Surrey TW20 0EX, United Kingdom
D. N. Brown
C. L. Davis
University of Louisville, Louisville, Kentucky 40292, USA
J. Allison
N. R. Barlow
R. J. Barlow
Y. M. Chia
C. L. Edgar
G. D. Lafferty
T. J. West
J. I. Yi
University of Manchester, Manchester M13 9PL, United Kingdom
J. Anderson
C. Chen
A. Jawahery
D. A. Roberts
G. Simi
J. M. Tuggle
University of Maryland, College Park, Maryland 20742, USA
G. Blaylock
C. Dallapiccola
S. S. Hertzbach
X. Li
T. B. Moore
E. Salvati
S. Saremi
University of Massachusetts, Amherst, Massachusetts 01003, USA
R. Cowan
D. Dujmic
P. H. Fisher
K. Koeneke
G. Sciolla
S. J. Sekula
M. Spitznagel
F. Taylor
R. K. Yamamoto
M. Zhao
Y. Zheng
Massachusetts Institute of Technology, Laboratory for Nuclear Science, Cambridge, Massachusetts 02139, USA
S. E. Mclachlin
P. M. Patel
S. H. Robertson
McGill University, Montréal, Québec, Canada H3A 2T8
A. Lazzaro
F. Palombo
Università di Milano, Dipartimento di Fisica and INFN, I-20133 Milano, Italy
J. M. Bauer
L. Cremaldi
V. Eschenburg
R. Godang
R. Kroeger
D. A. Sanders
D. J. Summers
H. W. Zhao
University of Mississippi, University, Mississippi 38677, USA
S. Brunet
D. Côté
M. Simard
P. Taras
F. B. Viaud
Université de Montréal, Physique des Particules, Montréal, Québec, Canada H3C 3J7
H. Nicholson
Mount Holyoke College, South Hadley, Massachusetts 01075, USA
G. De Nardo
F. Fabozzi
Also with Università della Basilicata, Potenza, Italy
L. Lista
D. Monorchio
C. Sciacca
Università di Napoli Federico II, Dipartimento di Scienze Fisiche and INFN, I-80126, Napoli, Italy
M. A. Baak
G. Raven
H. L. Snoek
NIKHEF, National Institute for Nuclear Physics and High Energy Physics, NL-1009 DB Amsterdam, The Netherlands
C. P. Jessop
K. J. Knoepfel
J. M. LoSecco
University of Notre Dame, Notre Dame, Indiana 46556, USA
G. Benelli
L. A. Corwin
K. Honscheid
H. Kagan
R. Kass
J. P. Morris
A. M. Rahimi
J. J. Regensburger
Q. K. Wong
Ohio State University, Columbus, Ohio 43210, USA
N. L. Blount
J. Brau
R. Frey
O. Igonkina
J. A. Kolb
M. Lu
R. Rahmat
N. B. Sinev
D. Strom
J. Strube
E. Torrence
University of Oregon, Eugene, Oregon 97403, USA
N. Gagliardi
A. Gaz
M. Margoni
M. Morandin
A. Pompili
M. Posocco
M. Rotondo
F. Simonetto
R. Stroili
C. Voci
Università di Padova, Dipartimento di Fisica and INFN, I-35131 Padova, Italy
E. Ben-Haim
H. Briand
G. Calderini
J. Chauveau
P. David
L. Del Buono
Ch. de la Vaissière
O. Hamon
Ph. Leruste
J. Malclès
J. Ocariz
A. Perez
J. Prendki
Laboratoire de Physique Nucléaire et de Hautes Energies, IN2P3/CNRS, Université Pierre et Marie Curie-Paris6, Université Denis Diderot-Paris7, F-75252 Paris, France
L. Gladney
University of Pennsylvania, Philadelphia, Pennsylvania 19104, USA
M. Biasini
R. Covarelli
E. Manoni
Università di Perugia, Dipartimento di Fisica and INFN, I-06100 Perugia, Italy
C. Angelini
G. Batignani
S. Bettarini
M. Carpinelli
R. Cenci
A. Cervelli
F. Forti
M. A. Giorgi
A. Lusiani
G. Marchiori
M. A. Mazur
M. Morganti
N. Neri
E. Paoloni
G. Rizzo
J. J. Walsh
Università di Pisa, Dipartimento di Fisica, Scuola Normale Superiore and INFN, I-56127 Pisa, Italy
M. Haire
Prairie View A&M University, Prairie View, Texas 77446, USA
J. Biesiada
P. Elmer
Y. P. Lau
C. Lu
J. Olsen
A. J. S. Smith
A. V. Telnov
Princeton University, Princeton, New Jersey 08544, USA
E. Baracchini
F. Bellini
G. Cavoto
D. del Re
E. Di Marco
R. Faccini
F. Ferrarotto
F. Ferroni
M. Gaspero
P. D. Jackson
L. Li Gioi
M. A. Mazzoni
S. Morganti
G. Piredda
F. Polci
F. Renga
C. Voena
Università di Roma La Sapienza, Dipartimento di Fisica and INFN, I-00185 Roma, Italy
M. Ebert
T. Hartmann
H. Schröder
R. Waldi
Universität Rostock, D-18051 Rostock, Germany
T. Adye
G. Castelli
B. Franek
E. O. Olaiya
S. Ricciardi
W. Roethel
F. F. Wilson
Rutherford Appleton Laboratory, Chilton, Didcot, Oxon, OX11 0QX, United Kingdom
S. Emery
M. Escalier
A. Gaidot
S. F. Ganzhur
G. Hamel de Monchenault
W. Kozanecki
G. Vasseur
Ch. Yèche
M. Zito
DSM/Dapnia, CEA/Saclay, F-91191 Gif-sur-Yvette, France
X. R. Chen
H. Liu
W. Park
M. V. Purohit
J. R. Wilson
University of South Carolina, Columbia, South Carolina 29208, USA
M. T. Allen
D. Aston
R. Bartoldus
P. Bechtle
N. Berger
R. Claus
J. P. Coleman
M. R. Convery
J. C. Dingfelder
J. Dorfan
G. P. Dubois-Felsmann
W. Dunwoodie
R. C. Field
T. Glanzman
S. J. Gowdy
M. T. Graham
P. Grenier
C. Hast
T. Hryn’ova
W. R. Innes
J. Kaminski
M. H. Kelsey
H. Kim
P. Kim
M. L. Kocian
D. W. G. S. Leith
S. Li
S. Luitz
V. Luth
H. L. Lynch
D. B. MacFarlane
H. Marsiske
R. Messner
D. R. Muller
C. P. O’Grady
I. Ofte
A. Perazzo
M. Perl
T. Pulliam
B. N. Ratcliff
A. Roodman
A. A. Salnikov
R. H. Schindler
J. Schwiening
A. Snyder
J. Stelzer
D. Su
M. K. Sullivan
K. Suzuki
S. K. Swain
J. M. Thompson
J. Va’vra
N. van Bakel
A. P. Wagner
M. Weaver
W. J. Wisniewski
M. Wittgen
D. H. Wright
A. K. Yarritu
K. Yi
C. C. Young
Stanford Linear Accelerator Center, Stanford, California 94309, USA
P. R. Burchat
A. J. Edwards
S. A. Majewski
B. A. Petersen
L. Wilden
Stanford University, Stanford, California 94305-4060, USA
S. Ahmed
M. S. Alam
R. Bula
J. A. Ernst
V. Jain
B. Pan
M. A. Saeed
F. R. Wappler
S. B. Zain
State University of New York, Albany, New York 12222, USA
M. Krishnamurthy
S. M. Spanier
University of Tennessee, Knoxville, Tennessee 37996, USA
R. Eckmann
J. L. Ritchie
A. M. Ruland
C. J. Schilling
R. F. Schwitters
University of Texas at Austin, Austin, Texas 78712, USA
J. M. Izen
X. C. Lou
S. Ye
University of Texas at Dallas, Richardson, Texas 75083, USA
F. Bianchi
F. Gallo
D. Gamba
M. Pelliccioni
Università di Torino, Dipartimento di Fisica Sperimentale and INFN, I-10125 Torino, Italy
M. Bomben
L. Bosisio
C. Cartaro
F. Cossutti
G. Della Ricca
L. Lanceri
L. Vitale
Università di Trieste, Dipartimento di Fisica and INFN, I-34127 Trieste, Italy
V. Azzolini
N. Lopez-March
F. Martinez-Vidal
Also with Universitat de Barcelona, Facultat de Fisica, Departament ECM, E-08028 Barcelona, Spain
D. A. Milanes
A. Oyanguren
IFIC, Universitat de Valencia-CSIC, E-46071 Valencia, Spain
J. Albert
Sw. Banerjee
B. Bhuyan
K. Hamano
R. Kowalewski
I. M. Nugent
J. M. Roney
R. J. Sobie
University of Victoria, Victoria, British Columbia, Canada V8W 3P6
P. F. Harrison
J. Ilic
T. E. Latham
G. B. Mohanty
Department of Physics, University of Warwick, Coventry CV4 7AL, United Kingdom
H. R. Band
X. Chen
S. Dasu
K. T. Flood
J. J. Hollar
P. E. Kutter
Y. Pan
M. Pierini
R. Prepost
S. L. Wu
University of Wisconsin, Madison, Wisconsin 53706, USA
H. Neal
Yale University, New Haven, Connecticut 06511, USA
Abstract
We present a measurement of moments of the inclusive hadronic-mass and -energy spectrum
in semileptonic decays. This study is based on a sample of million
decays recorded by the BABAR detector at the PEP-II -storage
rings.
We reconstruct the semileptonic decay by identifying a lepton in events tagged
by a fully reconstructed hadronic decay of the second meson.
We report preliminary results for the moments
with and with and
, with the mass of the hadronic
system, its energy, and a
constant of , for different minimal lepton momenta between and
measured in the -meson rest frame.
These are predicted in the framework of a Heavy Quark Expansion (HQE), which allows the
extraction of the total semileptonic branching fraction, the CKM-matrix element , and
the quark masses and , together with the dominant non-perturbative HQE parameters.
We find as preliminary results and .
Submitted to the 2007 Europhysics Conference on High Energy Physics,
Manchester, England.
pacs:
12.15.Ff, 12.15.Hh, 13.25.Hw, 13.30.Ce
I Introduction
Measurement of moments of the hadronic-mass
Csorna et al. (2004); Aubert et al. (2004a); Acosta et al. (2005); Abdallah et al. (2006); Schwanda et al. (2007)
and lepton-energy
Aubert et al. (2004b); Abdallah et al. (2006); Abe et al. (2005)
spectra in inclusive semileptonic decays have been
used to determine the non-perturbative QCD parameters describing these decays
and the CKM matrix element .
Combined fits to these moments and moments of the photon-energy spectrum
in decays Chen et al. (2001); Koppenburg et al. (2004); Aubert et al. (2005, 2006)
in the context of Heavy Quark Expansions (HQE) of QCD have resulted in
precise determinations of and , the mass of the
quark. Specifically, they are reported to be
and
in the kinetic mass scheme Buchmüller and
Flächer (2006) and
and
in the 1S scheme Bauer et al. (2004).
Lepton-energy moments are known with very good accuracy, but the precision
of the hadronic-mass and photon-energy moments is limited by
statistics. Therefore, we present here an updated measurement of the
hadronic-mass moments with based on a
larger dataset than previously used Aubert et al. (2004a).
In addition we present measurements of the mixed hadron mass-energy moments
with as proposed by Gambino and Uraltsev
Gambino and
Uraltsev (2004). All moments are presented
for different cuts on the minimum energy of the charged lepton.
The mixed moments use the mass and the energy of the system in the
meson rest frame of decays,
(1)
with a constant , here fixed to be 0.65 as proposed in Gambino and
Uraltsev (2004).
They allow a more reliable extraction of the higher-order non-perturbative HQE
parameters and thus they are expected to increase the precision on the extraction of and the
quark masses and .
We perform a combined fit to the hadronic mass moments, measured moments of
the lepton-energy spectrum, and moments of the photon energy spectrum in
decays . The fit extracts values for , the quark masses and ,
the total semileptonic branching fraction , and the dominant
non-perturbative HQE parameters. These are and ,
parameterizing effects at , and and ,
parameterizing effects at .
II BABAR Detector and Dataset
The analysis is based on data collected with the BABAR experiment Aubert et al. (2002)
at the PEP-II asymmetric-energy storage rings PEP-II: An Asymmetric B Factory. Conceptual
Design Report (1993) at the
Stanford Linear Accelerator Center between October 1999 and July 2004.
The BABAR tracking system used for charged particle and vertex
reconstruction has two main components: a silicon vertex tracker
(SVT) and a drift chamber (DCH), both operating within a 1.5-T
magnetic field of a superconducting solenoid.
The transverse momentum resolution is 0.47 % at 1.
Photons are identified in an electromagnetic calorimeter (EMC)
surrounding a detector of internally reflected Cherenkov light
(DIRC), which associates Cherenkov photons with tracks for particle
identification (PID).
The energy of photons is measured with a resolution of 3 % at 1.
Muon candidates are identified with the
use of the instrumented flux return (IFR) of the solenoid.
The detector covers the polar angle of in the center of mass (c.m.) frame.
The data sample consists of about 210.4 , corresponding
to decays of .
We use Monte Carlo (MC) simulated events to determine
background distributions and to correct for detector acceptance and
resolution effects. The simulation of the BABAR detector is realized
with GEANT4 Agostinelli et al. (2003).
Simulated meson decays are generated using EvtGen Lange (2001).
Final state radiation is modeled
with PHOTOS Richter-Was (1993).
The simulations of decays use a parameterization of
form factors for
Duboscq et al. (1996),
and models for
Scora and Isgur (1995) and
Goity and Roberts (1995).
III Reconstruction of Semileptonic Decays
III.1 Selection of Hadronic -Meson Decays
The analysis uses events in which one of the mesons
decays to hadrons and is fully reconstructed ()
and the semileptonic decay of the recoiling meson ()
is identified by the presence of an electron or muon. While this approach
results in a low overall event selection efficiency of only a few per mille,
it allows for the determination of the momentum, charge, and flavor of the mesons.
To obtain a large sample of mesons, many exclusive hadronic decays
are reconstructed Aubert et al. (2004c). The kinematic consistency of
these candidates is checked with two variables,
the beam-energy-substituted mass
and the energy difference
. Here is the total
energy in the c.m. frame, and
denote the c.m. momentum and c.m. energy of the candidate.
We require within three standard
deviations, which range between 10 and 30 depending on the number of hadrons
used for the reconstruction.
For a given decay mode, the purity
is estimated as the signal fraction in events with .
For events with one high-momentum lepton with in the -meson rest frame,
the purity is approximately 78 %.
III.2 Selection of Semileptonic Decays
Semileptonic decays are identified by the presence of one and
only one electron or muon above a minimum momentum
measured in the rest frame of the .
Electrons are selected
with 94% average efficiency and a hadron misidentification rate in the order of 0.1%.
Muons are identified
with an efficiency ranging between 60% for momenta in
the laboratory frame and 75% for momenta
and a hadron misidentification rate between 1% for kaons and protons and 3% for pions.
Efficiencies and misidentification rates are estimated
from selected samples of electrons, muons, pions, and kaons.
We impose the condition , where is
the charge of the lepton and is the charge of the -quark
of the . This condition is fulfilled for primary leptons,
except for events in which flavor mixing has occurred.
We require the total observed charge of the event to be
,
allowing for a charge imbalance in events with low momentum tracks
or photon conversions. In cases where only one charged track is present in the reconstructed
system, the total charge in the event is required to be equal to zero.
III.3 Reconstruction of the Hadronic System
The hadronic system in the decay is reconstructed from charged
tracks and energy depositions in the calorimeter that are not associated with
the or the charged lepton. Procedures are implemented to eliminate
fake tracks, low-energy beam-generated photons,
and energy depositions in the calorimeter originating from hadronic showers
faking the presence of additional particles. Each track is assigned a specific
particle type, either
, , or , based on combined information
from the different BABAR subdetectors. The four-momentum of the reconstructed
hadronic system is calculated from the four-momenta of the
reconstructed tracks , reconstructed using the mass of the
identified particle type, and photons by
.
The hadronic mass is calculated from the reconstructed four-momenta as
.
The four-momentum of the unmeasured neutrino is estimated from the
missing four-momentum .
Here, all four-momenta are measured in the laboratory frame.
To ensure a well reconstructed hadronic system, we impose criteria on
the missing energy, , the missing momentum, ,
and the difference of both quantities, .
After having selected a well reconstructed and having imposed
the selection criteria on , of signal decays and of
background decays are retained.
Starting from a kinematically well defined initial state additional knowledge
of the kinematics of the semileptonic final state is used in a kinematic fit
to improve the overall resolution and reduce the bias of the measured values.
The fit imposes four-momentum conservation, the equality of the masses of the two
mesons, and constrains the mass of the neutrino, .
The resulting average resolutions in
and are and , respectively.
The overall biases of the kinematically fitted
hadronic system are found to be and , respectively.
We require the fit to converge, thus ensuring that the constraints are fulfilled.
The background is composed of events
(continuum background) and decays or in which
the candidate is mistakenly reconstructed from particles coming from both
mesons in the event (combinatorial background).
Missing tracks and photons in the reconstructed hadronic system
are not considered an additional source of background since they only affect
its resolution.
The effect of missing particles in the reconstruction is taken care
of by further correction procedures.
To quantify the amount of background in the signal region
we perform a fit to the distribution of the candidates.
We parametrize the background using an empirical threshold
function Albrecht et al. (1987),
(2)
where , is the kinematic endpoint approximated by the mean c.m. energy,
and is a free parameter defining the curvature of the function.
The signal is parameterized with a modified Gaussian function Skwarnicki (1986)
peaked at the -meson mass and corrected for radiation losses.
The fit is performed separately for several bins
in and to account for changing background contributions
in different or regions, respectively. The background shape
is determined in a signal-free region of the sideband,
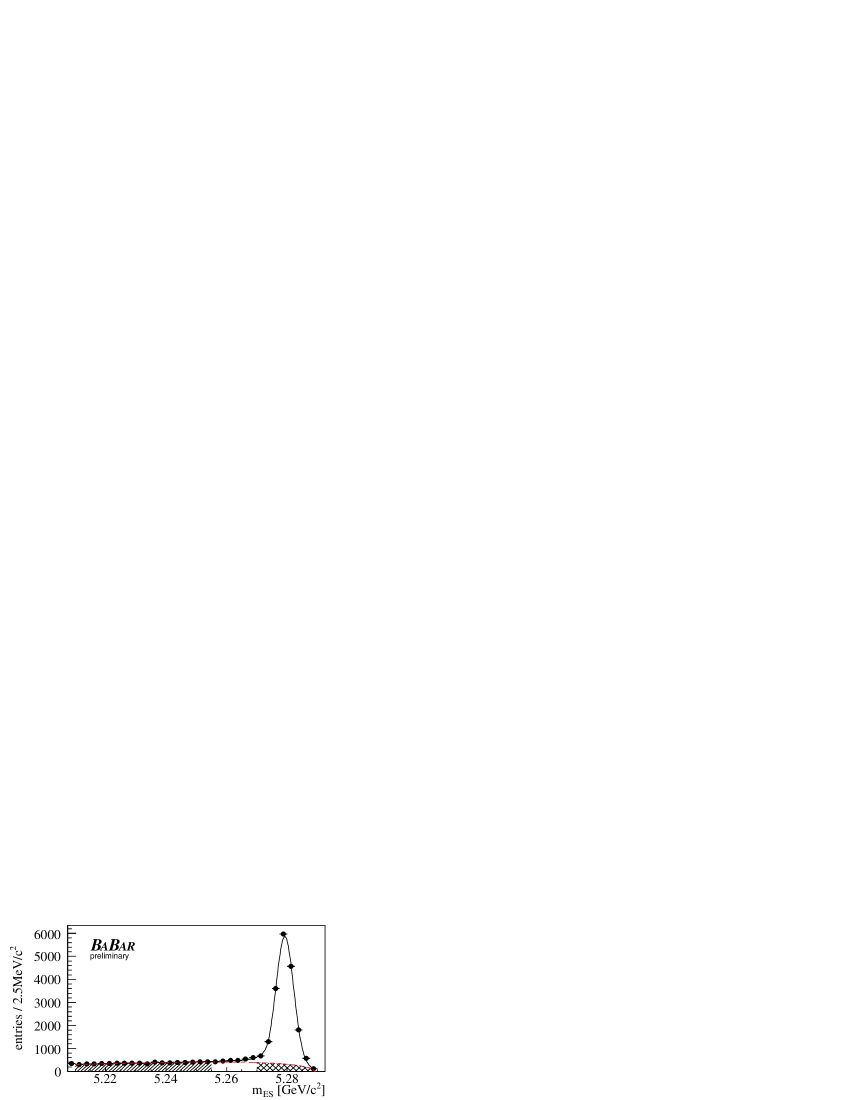
. Figure 1 shows the
distribution for together with the fitted signal and
background contributions.
Figure 1: spectrum of decays accompanied by a lepton with .
The signal (solid line) and background (red dashed line) components of the fit
are overlaid. The crossed area shows the background under the signal.
The background control region in the sideband is indicated by
the hatched area.
Residual background is estimated from MC simulations. It is composed of
charmless semileptonic decays , hadrons misidentified
as leptons, secondary leptons from semileptonic
decays of , mesons or either in mixed events
or produced in transitions, as well as leptons from
decays of , and . The simulated background spectra are
normalized to the number of events in data. We verify the
normalization using an independent data control sample with inverted
lepton charge correlation, .
IV Hadronic Mass Moments
We present measurements of the moments , with ,
of the hadronic mass distribution in semileptonic meson decays .
The moments are measured as functions of the
lower limit on the lepton momentum, , between
and calculated in the rest frame of the meson.
IV.1 Selected Event Sample
The selected event sample contains about background.
For we find a total of signal events above
a combinatorial and continuum background of events and
residual background of events. For we find
signal events above a background constituted of and
combinatorial and residual events, respectively.
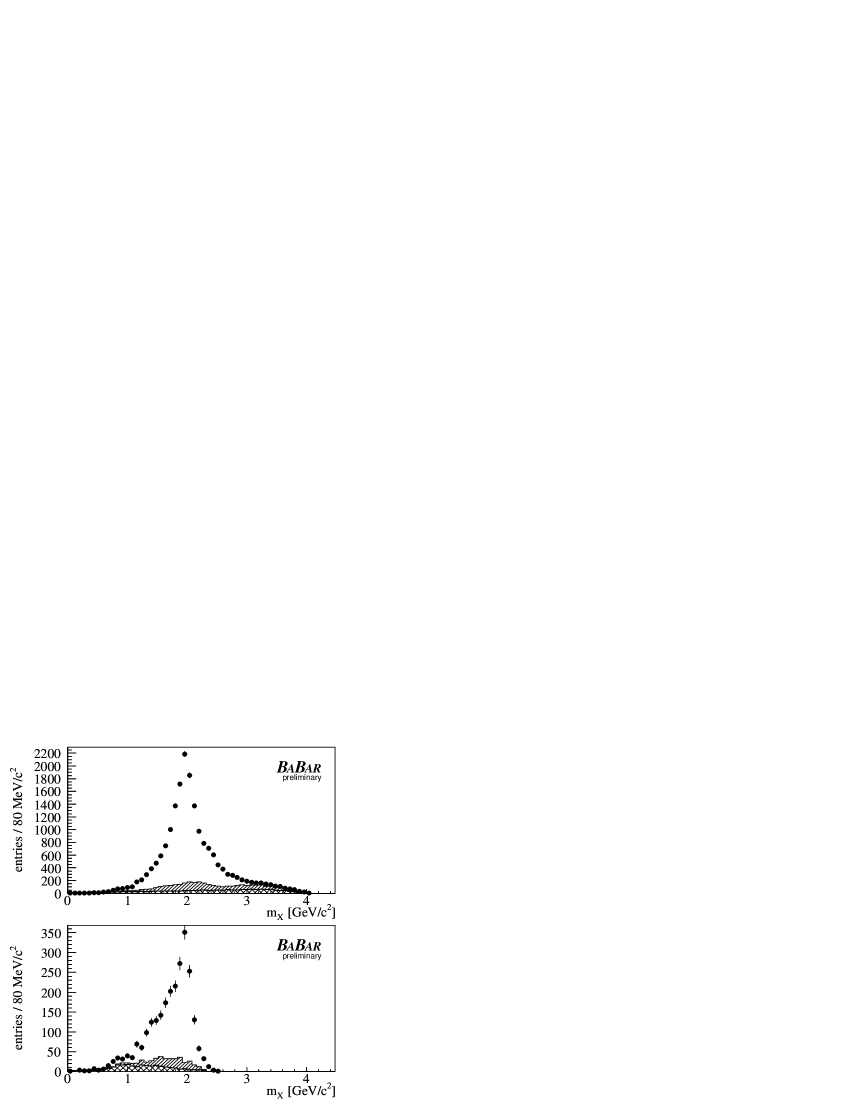
Figure 2 shows the kinematically fitted
distributions together with the extracted background shapes for
and .
Figure 2: Kinematically fitted hadronic mass spectra
for minimal lepton momenta (top) and (bottom)
together with distributions of combinatorial background
and background from non- decays (hatched area)
as well as residual background (crossed area)
IV.2 Extraction of Moments
To extract unbiased moments , additional corrections have to be
applied to correct for remaining effects that can distort the measured distribution.
Contributing effects are the limited acceptance and resolution of the BABAR
detector resulting in unmeasured particles and in misreconstructed energies and momenta of
particles. Additionally measured particles not originating from the hadronic system
and final state radiation of leptons contribute, too.
We correct the kinematically fitted by applying
correction factors on an event-by-event basis using the
observed linear relationship between the moments of the measured mass
and moments of the true underlying mass . Correction functions
are constructed from MC simulations by calculating moments and
in several bins of the true mass and fitting the
observed dependence with a linear function.
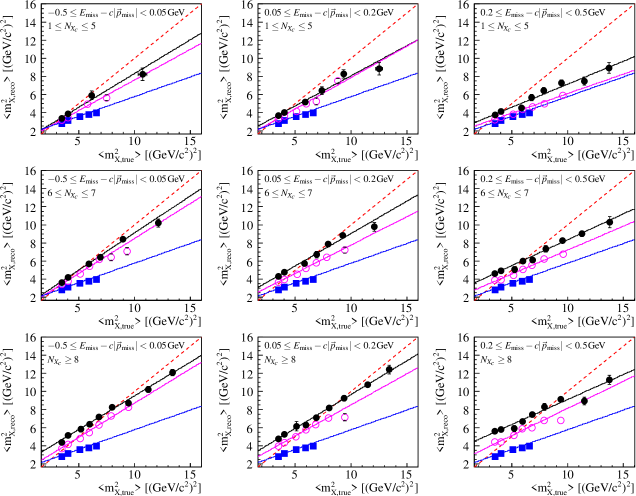
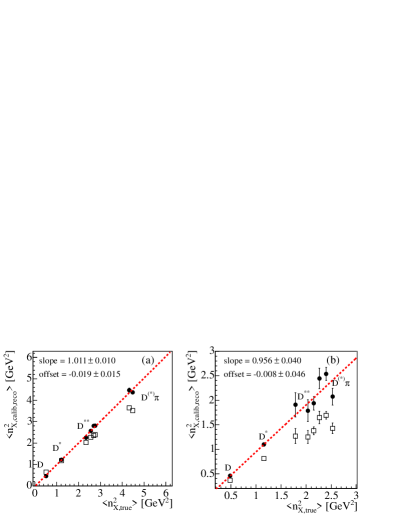
Figure 3: Examples of calibration fucntions for in bins of , and
. Shown are the extracted versus in bins
of for (),
(), and
(). The results of fits of linear
functions are overlaid as solid lines. A reference line with
is superimposed (dashed line).
There is only one calibration function with constructed but
plotted for better comparableness in each bin.
Studies show that the bias of the measured is not constant over the
whole phase space but depends on the resolution and total multiplicity of the
reconstructed hadronic system, . Therefore, correction functions are derived
in three bins of , three bins of , as well as in twelve bins of
, each with a width of . Due to limited number of generated MC events,
the binning in and is abandoned for .
Overall we construct calibration functions for each order of moments.
Figure 3 shows examples of correction functions for the moment
in three bins of as well as in nine bins of and .
For each event the corrected mass is calculated by inverting the linear function,
(3)
with the offset and the slope of the correction function.
Background contributions are subtracted by applying weight factors dependent on
to each corrected hadronic mass, whereby each weight corresponds to
the fraction of signal events expected in the corresponding part of the
spectrum. This leads to the following expression used for the
calculation of the moments:
(4)
The factors and are dependent on the order and
minimal lepton momentum of the measured moment.
They are determined in MC simulations and correct
for small biases observed after the calibration. The factors
account for the bias of the applied correction method and
range between and . For we observe larger biases
ranging between and for the lowest between
and , respectively. The residual bias correction factor
accounts for differences in selection efficiencies for different hadronic
final states and QED radiation in the final state that is included
in the measured hadron mass and distorts the measurement of the lepton’s momentum.
The effect of radiative photons is estimated by employing PHOTOS.
Our correction procedure results in moments which are free of photon radiation.
The residual bias correction is estimated in MC simulations
and typically ranges between and . For the moments
and slighly higher correction factors are determined
ranging between and as well as and , respectively.
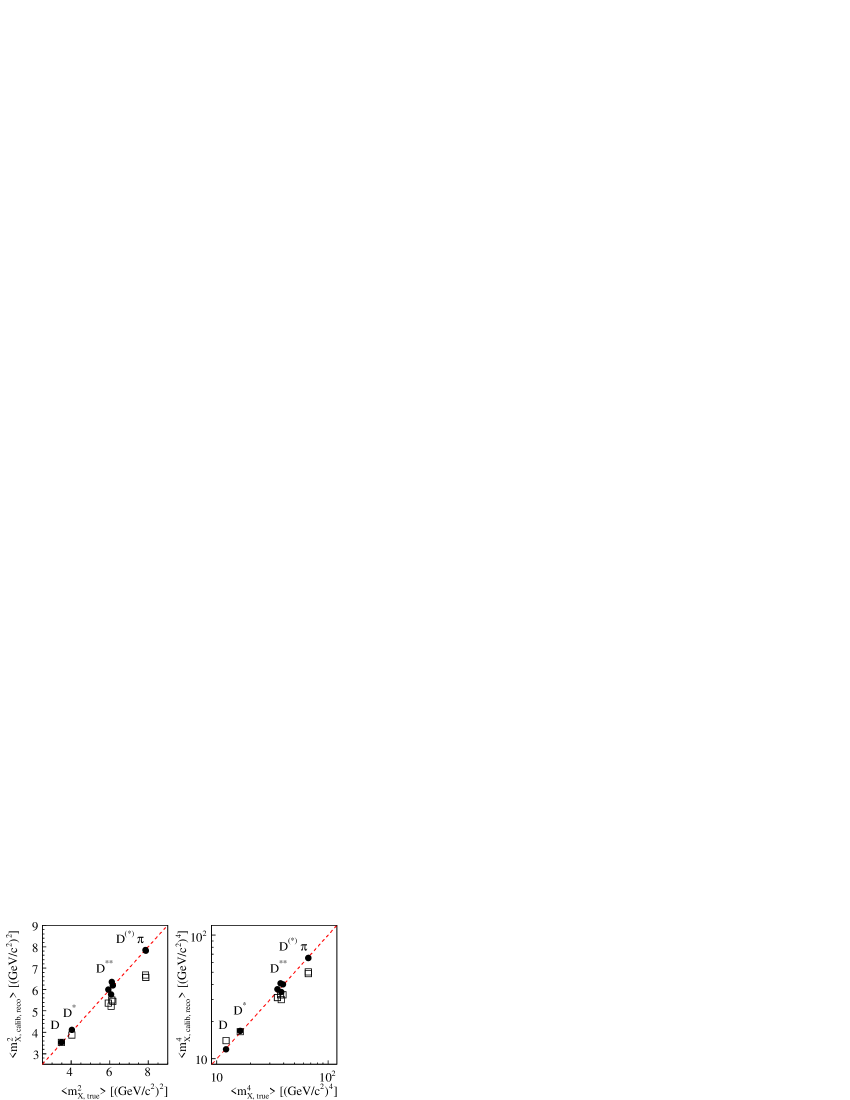
This procedure is verified on a MC sample by applying the calibration to
measured hadron masses of individual semileptonic decays, ,
, four resonant decays ,
and two non-resonant decays .
Figure 4 shows the corrected
moments and as functions of the true moments
for minimal lepton momenta .
The dashed line corresponds to .
The calibration reproduces the true moments over the full mass range.
Figure 4: Calibrated () and uncorrected () moments
(left) and (right)
of individual hadronic modes for minimal lepton momenta .
A reference line with is superimposed.
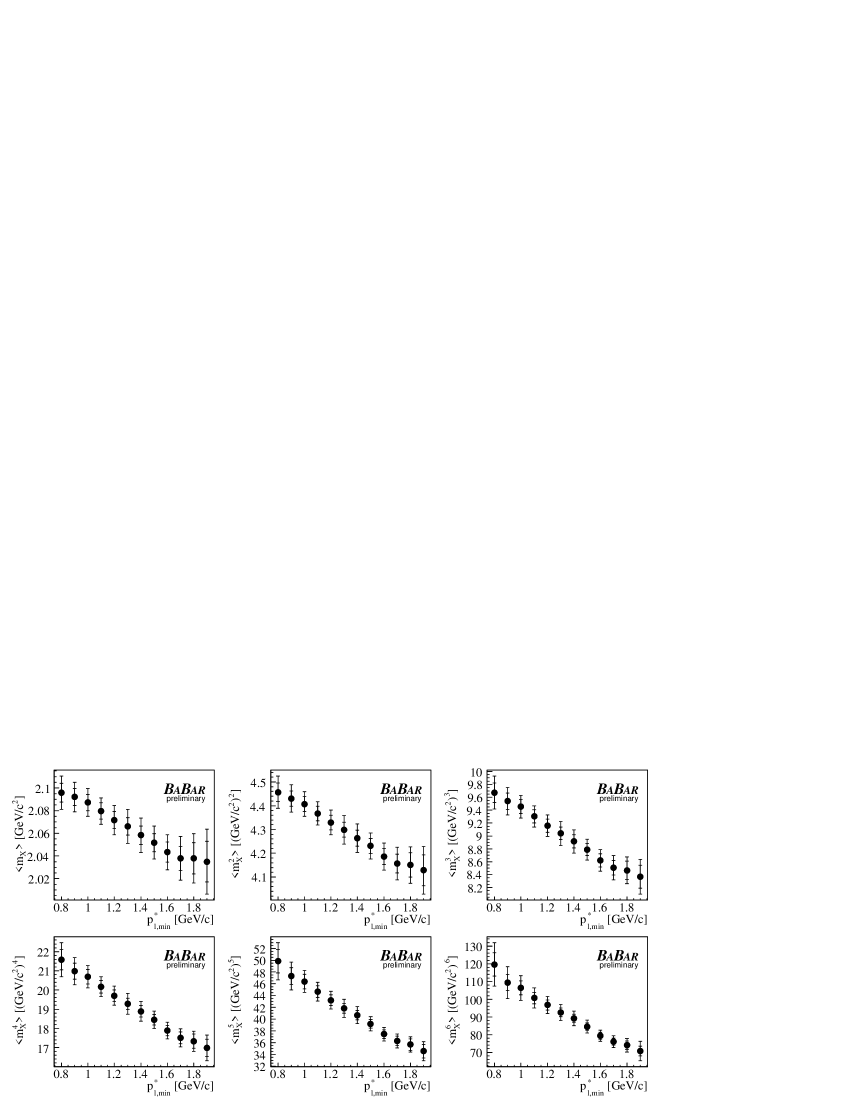
Figure 5: Measured hadronic mass moments with for different
selection criteria on the minimal lepton momentum . The inner error bars
correspond to the statistical uncertainties while the full error bars
correspond to the total uncertainties. The moments are highly correlated.
IV.3 Systematic Studies
The principal systematic uncertainties are associated with the modeling of hadronic final states
in semileptonic -meson decays, the bias of the calibration method, the subtraction
of residual background contributions, the modeling of track and photon selection efficiencies,
the identification of particles, as well as the stability of
the results. The obtained results are summarized in Tables A.I
and A.II for the measured moments with
and selection criteria on the minimum lepton momentum ranging from to .
IV.3.1 Modeling of Signal Decays
The uncertainty of the calibration method with respect to the chosen signal model
is estimated by changing the composition of the simulated inclusive hadronic spectrum.
The dependence on the simulation of high mass hadronic final states is estimated
by constructing correction functions only from MC simulated hadronic events with
hadronic masses , thereby removing the high mass tail of the simulated
hadronic mass spectrum.
The model dependence of the calibration method is
found to contribute only little to the total systematic uncertainty.
We estimate the model dependence of the residual bias correction
by changing the composition of the inclusive hadronic spectrum, thereby omitting
one or more decay modes.
We associate a systematic uncertainty to the correction of the observed bias of the
calibration method of half the size of the applied correction.
We study the effect of differences between data and MC in the multiplicity and
distributions on the calibration method by changing the binning of the
correction functions. The observed variation of the results is found to be
covered by the statistical uncertainties of the calibration functions.
IV.3.2 Background Subtraction
The branching fractions of background decays in the MC simulation are scaled to
agree with current measurements Yao et al. (2006). The associated systematic
uncertainty is estimated by varying these branching fractions within their
uncertainties. At low , most of the studied background channels contribute to
the systematic uncertainty, while at high , the systematic uncertainty
is dominated by background from decays .
Contributions from and decays are found to be negligible.
The uncertainty in the combinatorial background subtraction is estimated by
varying the lower and upper limits of the sideband region in the distribution
up and down by . The observed effect is found to be negligible.
IV.3.3 Detector-Related Effects
We correct the MC simulation for differences to data in the selection efficiencies of
charged tracks and photons, as well as identification efficiencies and misidentification
rates of various particle types. The corrections are extracted from data and MC
control samples.
The uncertainty of the photon selection efficiencies is found to be
per photon independent of energy, polar angle and multiplicity. The systematic
uncertainty in track finding efficiencies is estimated to be per track.
We add in quadrature the statistical uncertainty of
the control samples that depend on energy and polar angle of the track as well as the
multiplicity of tracks in the reconstructed event. The misidentification of
mesons as leptons is found to affect the
overall normalization of the corresponding background spectra by .
While the latter two uncertainties give only small contributions to the total
systematic uncertainty, the uncertainty associated with the selection efficiency
of photons is found to be the main source of systematic uncertainties.
IV.3.4 Stability of the Results
The stability of the results is tested by dividing the data
into several independent subsamples: and , decays to electrons and
muons, different run periods of roughly equal data-sample sizes, and two regions
in the spectrum, and ,
characterized by different resolutions of the reconstructed hadronic system.
No significant variations are observed.
The stability of the result under variation
of the selection criteria on is tested by varying the applied cut
between and . For most of the
measured moments the observed variation is covered by other known systematic
detector and MC simulation effects. In cases where the observed variation is
not covered by those effects, we add an additional contribution to the
systematic uncertainty of the measurement that compensates the observed difference .
IV.3.5 Simulation of Radiation
We check the impact of low energetic photons by removing
EMC neutral energy deposits with energies below from the reconstructed hadronic
system. The effect on the measured moments is found to be negligible.
IV.4 Results
The measured hadronic mass moments with as functions of the
minimal lepton momentum are depicted in Fig. 5.
All measurements are correlated since they share subsets of selected events.
Tables A.I and A.II summarize the
numerical results. The statistical uncertainty consists of contributions from the data statistics
and the statistics of the MC simulation used for the construction of the correction functions,
for the subtraction of residual background, and the determination of the final bias correction.
In most cases we find systematic uncertainties that exceed the statistical uncertainty by
a factor of .
V Mixed Hadronic Mass- and Energy-Moments
The measurement of moments of the observable , a combination of the mass and energy of the inclusive system, as defined in Eq. 1 , allow a more reliable extraction of the higher order HQE parameters , , , and . Thus a smaller uncertainty on the standard model parameters , , and could be achieved.
We present measurements of the moments , , and for different minimal lepton momenta between 0.8 and 1.9 calculated in the -meson rest frame. We calculate the central moments
, , and the moments and as proposed in
Gambino and
Uraltsev (2004).
Due to the structure of the variable as a difference of two measured values, its
measured resolution and bias are larger than for the mass moments and the
sensitivity to is increased wrt. to . The overall
resolution of after the kinematic fit for lepton momenta greater than 0.8 is measured to be 1.31 with a bias of -0.08 . We therefore introduce stronger
requirements on the reconstruction quality of the event. We tighten the criteria on
the neutrino observables. The variable is required to be between 0 and 0.3 .
Due to the stronger requirements on the individual variables
and have less influence on the resolution of the
reconstrcuted hadronic system. Therefore, the cuts on the missing energy and the missing momentum in the event are loosened to
and , respectively, as they do
not yield significant improvement on the resolution of , and do not increase the
ratio of signal to background events.
The final event sample contains about 22 % of background events. The background
is composed of 12 % continuum and combinatorial background and
10 % decays of the signal meson other than the semileptonic
decay .
Combinatorial and continuum background is subtracted using the sideband of the distribution, as described above.
The residual background events, containing a correctly reconstructed meson, are subtracted using MC simulations. The dominant sources are pions misidentified as muons, decays, and secondary semileptonic decays of and mesons.
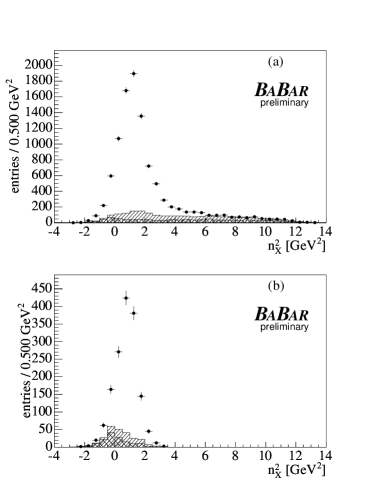
The measured spectra for cuts on the lepton momentum at and are shown together with the backgound distributions in Fig. 6. We measure () signal events for , respectively.
Figure 6: Spectra of after the kinematic fit together with distributions of
combinatorial background and background from non- decays
(hatched area) as well as residual background
(crossed area) for different minimal lepton momenta
(a) and (b).
V.1 Extraction of Moments
To extract unbiased moments , effects that distort the distribution need to be corrected. These are the limited detector acceptance, resulting in a loss of particles,
the resolution of measured charged particle momenta and energy depositions in the EMC, as well as the radiation of final-state photons. These photons are included in the measured system and thus lead to a modified energy and mass measurement of the inclusive system. In the case of radiation from the lepton, the lepton’s measured momentum is also lowered w.r.t. its initial momentum.
The measured moments are corrected for the impact of these photons.
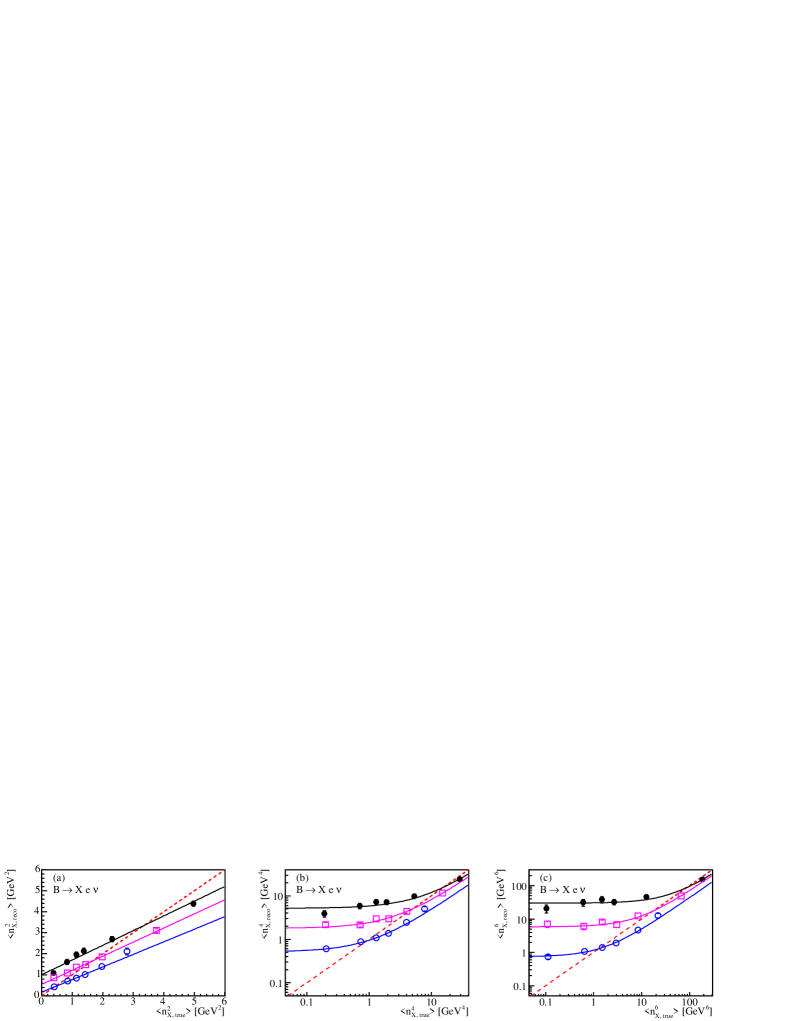
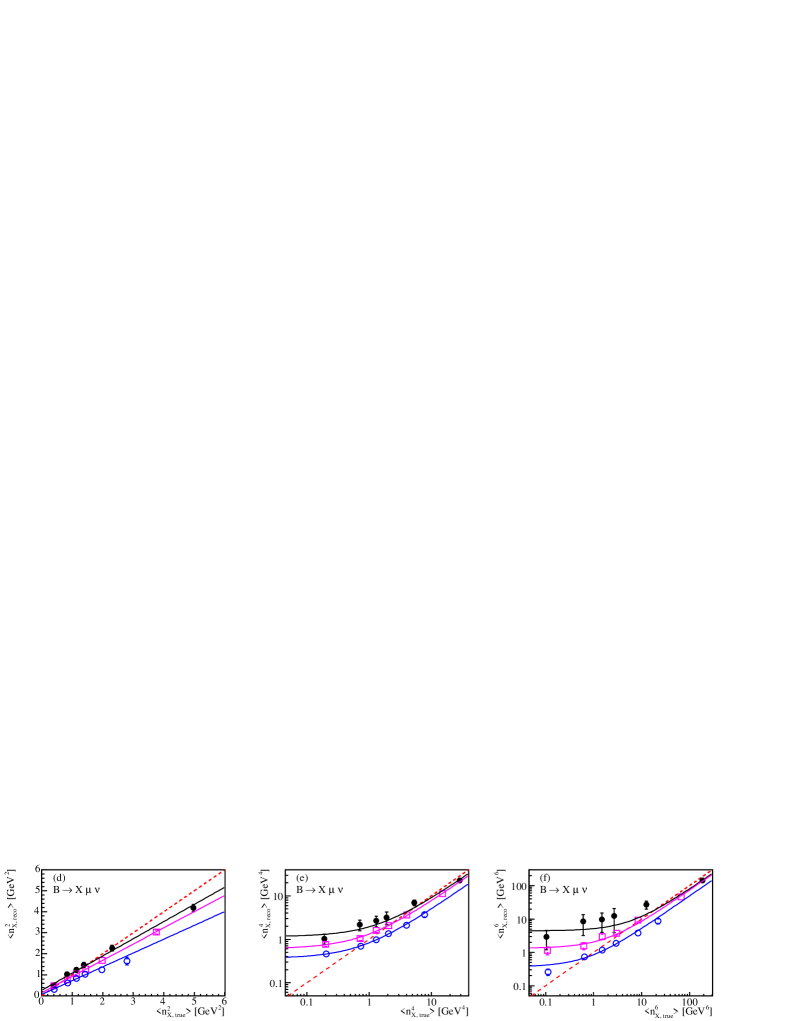
Figure 7: Examples of calibration curves for () in bins of , extracted separately for events (a)-(c) and (d)-(f). Shown are the extracted versus in bins
of for (),
(), and
() integrated over multiplicity and
bins.
The results of fits of linear
functions are overlaid as solid lines. Reference lines with
are superimposed (dashed lines). Please note the logarithmic scales in (b), (c), (e), and (f).
As described before, we find linear relationships correcting the measured means to the true means described by first order polynomials. These functions vary with the measured lepton momentum, the measured , and the measured multiplicity of the inclusive system. The curves are therefore derived in three bins of and three bins of the multiplicity for each of the 12 lepton momentum bins of 100 . We also find differences for events containing an electron or a muon and therefore derive separate correction functions for these two classes of events. The measured value is corrected on an event-by-event basis using the inverse of these functions:
(5)
Here and are the offset and the slope of the calibration function and differ for each order and for each of the abovementioned bins.
Figure 7 shows calibration curves for the moments (), integrated over all multiplicity bins and bins in , for three different bins of . These calibration curves are extracted separately for events containing an electron or muon. Differences are mainly visible in the low momentum bin.
To verify this calibration procedure, we extract the moments of of individual exclusive modes on a MC sample and compare the calibrated moments to the true moments. The result of this study for the moments
is plotted in Fig. 8, confirming that the extraction method is able to reproduce the true moments. Small biases remaining after calibration are of the order of 1 % for and in the order of few percent for and and are corrected and treated in the systematic uncertainties.
Background contributions are subtracted applying dependent weight factors on an event-by-event basis, leading to the following expression for the moments:
(6)
The bias correction factor depends on the minimal lepton momentum and the order of the extracted moments. It is derived on MC simulations and corrects for the small bias remaining after the calibration.
Figure 8: Result of the calibration verification procedure for different minimal lepton momenta
(a) and (b). Moments of exclusive modes on simulated events before calibration () and after calibration () plotted against the true moments for each mode. The dotted line shows the fit result to the calibrated moments, the resulting parameters are shown.
V.2 Systematic Studies
The main sources of systematic uncertainties have been identified as the simulation of the detector efficiency to detect neutral clusters. The corresponding effect from charged tracks is smaller but still contributes to the uncertainty on the moments. Their impact has been evaluated by randomly excluding neutral or charged candidates from the system with a probability of 1.8 % for the neutral candidates and 0.8% for the charged tracks, corresponding to the systematic uncertainties of the efficiency extraction methods. For the tracks we add in quadrature the statistical uncertainties from the control samples to the 0.8 % systematic uncertainty.
The uncertainty arising from the differences between data and MC in the distributions
is evaluated by changing the selected region of to [0.0,0.2] and [0.0, 0.4] .
To evaluate the uncertainty due to the binning of the calibration curves in the multiplicity, we
randomly increase the measured multiplicity used for the choice of the calibration curve
by one with a probability of corresponding to observed differences between data and MC.
Smaller uncertainties arise from the unknown branching fractions of the background decay modes. Their branching fractions are scaled to agree with recent measurements Yao et al. (2006) and are varied within their uncertainties.
The MC sample is corrected for differences in the identification efficiencies between data and MC for various particle types.
The uncertainty on the background due to pions misidentified as muons is evaluated by changing the MC corrections within the statistical uncertainties of these data control samples. While the background shape does not vary, the amount decreases up to 8 %. For the estimate of the uncertainty due to particle identification, we propagate this variation into the extracted moments.
A similar variation procedure is applied for the branching fractions of the exclusive signal modes, varying them several times randomly within 10 % for the , 15 % for the , 50 % for the individual modes and 75% for the non-resonant modes. The inclusive rate for the decays is conserved by rescaling all other modes. In addition, all (non-resonant) modes are scaled in common, again randomly within 50%, keeping the inclusive decay rate constant by rescaling the non-resonant () modes only. Experimental uncertainties on the signal branching fractions are fully covered by these variations Yao et al. (2006). This dependence of the extraction method results in changes of the calibration curve and bias correction, however the impact on the moments measured on data is small. We conservatively add half of the bias correction remaining after calibration to the uncertainty related to the extraction method.
The stability of the results has been tested by splitting the data sample into several independent subsamples: and , decays to electrons and muons, and different run periods of roughly equal
data-sample sizes. No significant variations are observed.
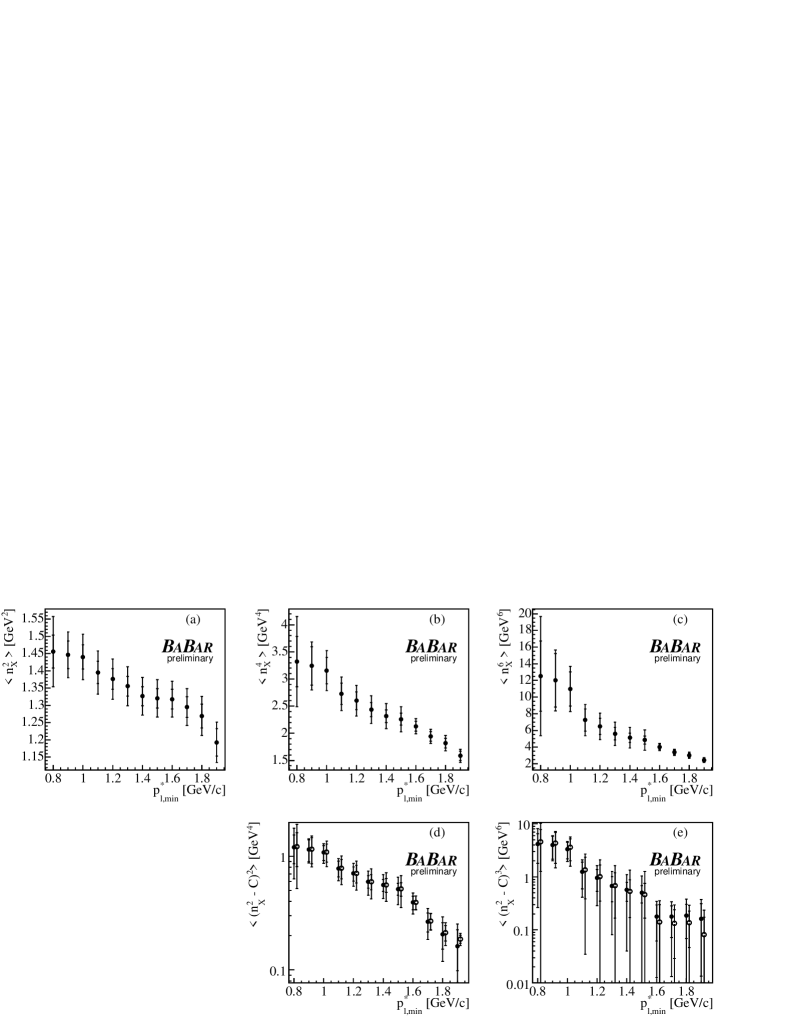
Figure 9: Measured moments (a), (b), (c),
and the central moments with () and () (d),
and with () and () (e)
for different cuts on the lepton momentum . The error bars indicate the statistical and the total errors, respectively. Please note the logarithmic scale on the -axis in plots (d) and (e). The moments are highly correlated.
V.3 Results
Figure 9 shows the results for the moments ,
, , and the central moments and
for as a function of the cut. The
moments are highly correlated due to the overlapping
data samples. The full numerical results and the statistical and the estimated
systematic uncertainties can be found in Tables A.III -
A.VII. A clear dependence on the lepton momentum
selection criteria is observed for all moments, due to the varying
contributions from higher mass final states with decreasing lepton momentum.
Statistical uncertainties on the moments arise from the limited data
sample, the width of the measured distribution
, and limited statistics
on the MC samples used for the extraction of background shapes,
calibration curves, and bias correction. In most cases we obtain
systematic uncertainties slightly exceeding the statistical uncertainty.
VI Determination of and the quark masses and
At the parton level, the weak decay rate for can be calculated
accurately; it is proportional to and depends on the quark masses,
and . To relate measurements of the semileptonic -meson decay rate
to , the parton-level calculations have to be corrected for effects of
strong interactions. Heavy-Quark Expansions (HQEs) Voloshin and Shifman (1985); Chay et al. (1990); Bigi and Uraltsev (1992)
have become a successful tool for calculating perturbative and non-perturbative QCD corrections
Bigi et al. (1992, 1993); Blok et al. (1994); Manohar and Wise (1994); Gremm and Kapustin (1997)
and for estimating their uncertainties.
In the kinetic-mass scheme
Benson et al. (2003); Gambino and
Uraltsev (2004); Benson et al. (2005); Aquila et al. (2005); Uraltsev (2005); Bigi et al. (2007),
these expansions in and (the strong coupling constant)
to order contain six parameters: the running kinetic masses of the and
quarks, and , and four non-perturbative parameters.
The parameter denotes the Wilson normalization scale that separates
effects from long- and short-distance dynamics. The calculations are performed
for Bigi et al. (1997).
We determine these six parameters from a fit to the moments of the hadronic-mass and
electron-energy Aubert et al. (2004b) distributions in semileptonic decays
and moments of the photon-energy spectrum in decays
Aubert et al. (2005, 2006).
In the kinetic-mass scheme the HQE to for the rate of
semileptonic decays can be expressed as Benson et al. (2003)
The leading non-perturbative effects arise at and are parameterized by
and , the expectation values of the kinetic and
chromomagnetic dimension-five operators. At , two additional parameters enter,
and , the expectation values of the Darwin and
spin-orbit dimension-six operators, respectively.
The ratio enters in the tree level phase-space factor
and in the function
.
The factor accounts for electroweak corrections. It
is estimated to be .
The quantity accounts for perturbative contributions and
is estimated to be Benson et al. (2003).
The performed fit uses a linearized expression for the dependence
of on the values of heavy-quark parameters, expanded around
estimates of these parameters Benson et al. (2003):
(8)
Here and are in and all other parameters of the expansion are in
; refers to the average lifetime of mesons produced at
the and is given in .
HQEs in terms of the same heavy-quark parameters are available for hadronic-mass,
electron-energy, and photon-energy moments. Predictions for those moments are obtained
from an analytical calculation. We use these calculations to determine
, the total semileptonic branching fraction , the quark masses and ,
as well as the heavy-quark parameters , , , and ,
from a simultaneous fit to the measured moments and partial branching fractions,
all as functions of the minimal lepton momentum and minimal photon energies
.
VI.1 Extraction Formalism
The fit method designed to extract the HQE parameters from the moments measurements
has been reported previously Buchmüller and
Flächer (2006); Aubert et al. (2004d).
It is based on a minimization,
(9)
The vectors and contain the measured
moments included in the fit and the corresponding moments calculated by theory,
respectively. Furthermore, the expression in Eq. 9
contains the total covariance matrix defined as the sum of the experimental,
, and theoretical, , covariance matrices
(see Section VI.3).
The total semileptonic branching fraction, , is extracted
in the fit by extrapolating measured partial branching-fractions,
, with to
the full lepton energy spectrum.
Using HQE predictions of the relative decay fraction
(10)
the total branching fraction can be introduced as a free parameter in the fit.
It is given by
(11)
The total branching fraction can be used together with the average
-meson lifetime to calculate the total semileptonic
rate proportional to ,
(12)
By adding to the vectors of measured
and predicted quantities, and ,
can be extracted from the fit as an additional free
parameter using Eq. VI.
The non-perturbative parameters and have been estimated from
- mass splitting and heavy-quark sum rules to be
and
Buchmüller and
Flächer (2006), respectively. Both parameters are restricted
in the fit by imposing Gaussian error constraints.
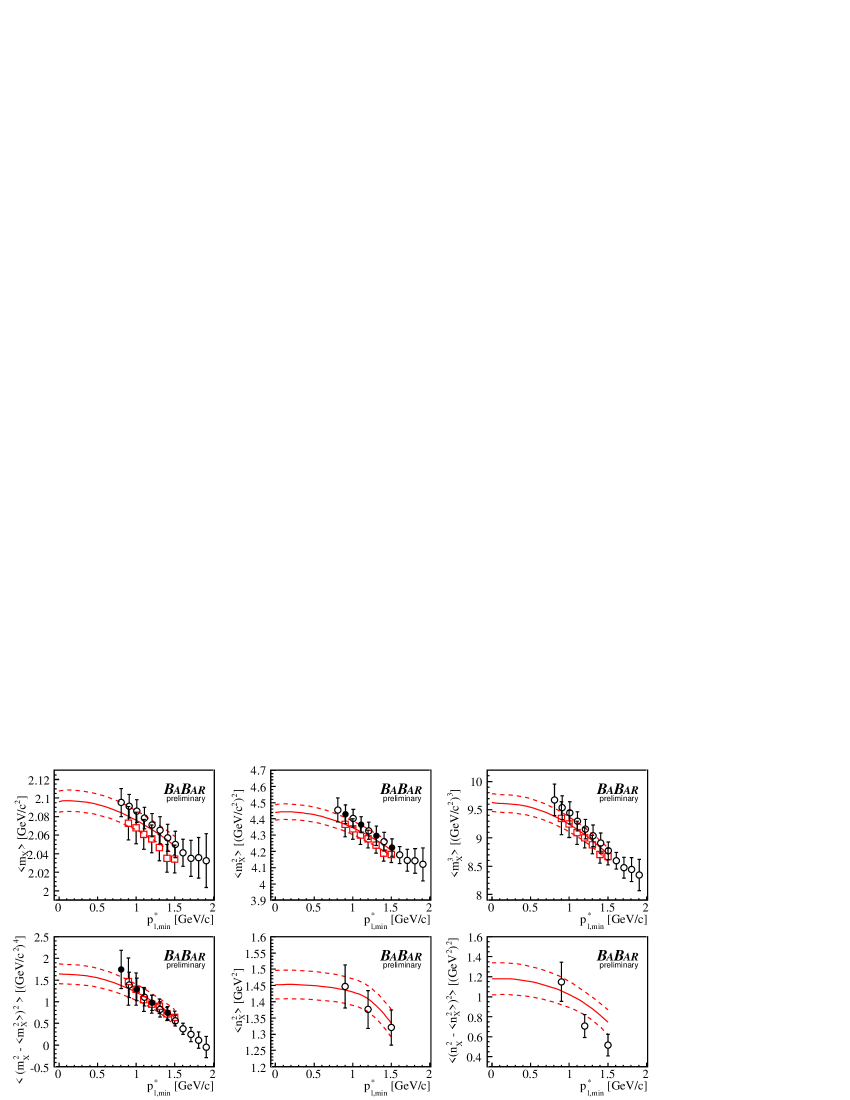
Figure 10: The measured hadronic-mass and mixed moments (/),
as a function of the minimal lepton momentum compared
with the result of the simultaneous fit (solid line) and a previous measurement
by the BABAR Collaboration () Aubert et al. (2004a).
The solid data points mark the measurements included in the fit.
The vertical bars indicate the experimental errors.
The dashed lines correspond to the total fit uncertainty as
obtained by converting the fit errors of each individual HQE parameter
into an error for the individual moment.
VI.2 Experimental Input
The combined fit is performed on a subset of available moment measurements
with correlations below to ensure the invertibility of the covariance matrix.
Since the omitted measurements are characterized by high correlations to other
measurements considered in the fit they do not contribute significant additional
information and the overall sensitivity of the results is not affected.
All results are based on the following set of moment measurements, 27 in total:
•
Lepton energy moments measured by BABAR Aubert et al. (2004b).
We use the partial branching fraction measured for and
the moments for .
The lepton energy moments are used at the minimal lepton momentum
and at .
•
Hadronic mass moments are used as presented in this paper. We select the following subset for
the fit:
for and for .
•
Photon energy moments measured in decays are taken from
Aubert et al. (2005) and Aubert et al. (2006):
for the minimal photon energy and for
.
In addition we use ,
taking into account the lifetimes Yao et al. (2006) of neutral and charged mesons,
and , and their relative production rates, Yao et al. (2006), the fraction of pairs.
VI.3 Theoretical Uncertainties
As discussed in Buchmüller and
Flächer (2006) and specified in
Gambino and
Uraltsev (2004) the following theoretical
uncertainties are taken into account:
The uncertainty related to the uncalculated perturbative corrections
to the Wilson coefficients of non-perturbative operators
are estimated by varying the corresponding parameters
and by and and
by around their expected values.
Uncertainties for the perturbative corrections are
estimated by varying up and down by for the hadronic mass moments
and by for the lepton energy moments around its nominal value.
Uncertainties in the perturbative corrections of the quark masses
and are addressed by varying both by up and down around
their expected values.
For the extracted value of an additional error
of is added for the uncertainty in the expansion of the
semileptonic rate
Benson et al. (2003); Bigi et al. (2007).
It accounts for remaining uncertainties in the perturbative corrections
to the leading operator, uncalculated perturbative corrections
to the chromomagnetic and Darwin operator, higher order power corrections, and
possible non-perturbative effects in the operators with charm fields.
This uncertainty is not included in the theoretical covariance matrix
but is listed separately as a theoretical uncertainty on .
For the predicted photon energy moments , additional
uncertainties are taken into account. As outlined in
Benson et al. (2005),
additional uncertainties of of the applied bias correction
to the photon-energy moments and half the difference in the moments
derived from two different distribution-function ansätze have to be
considered. Both contributions are added linearly.
The theoretical covariance matrix is constructed by assuming
fully correlated theoretical uncertainties for a given moment with different
lepton momentum or photon energy cutoff and assuming uncorrelated theoretical
uncertainties for moments of different orders and types. The additonal
uncertainties considered for the photon energy moments are assumed to be
uncorrelated for different moments and photon energy cutoffs.
VI.4 Results
A comparison of the fit results for the hadronic-mass and
mixed moments with the measured moments is shown in
Fig. 10.
The moments and are not included in the fit
and thus provide an unbiased comparison with the fitted HQE prediction.
We find an overall good agreement, also indicated by
for 20
degrees of freedom. The measured moments continue to decrease with
increasing and extend beyond theoretical predictions
available for .
Comparing the measured moments and with predictions resulting from the presented fit, a good agreement
is found. The calculations used for the predictions of the mixed
moments are currently missing -dependent perturbative
corrections. The dependence of the perturbative corrections
for those moments is however expected to be small
Uraltsev (2005).
The fit results for the standard model and HQE parameters are summarized in Table
1. We find as preliminary results and . The results are in good agreement with earlier determinations
Buchmüller and
Flächer (2006); Bauer et al. (2004), showing slightly increased
uncertainties due to the limited experimental input used in this fit.
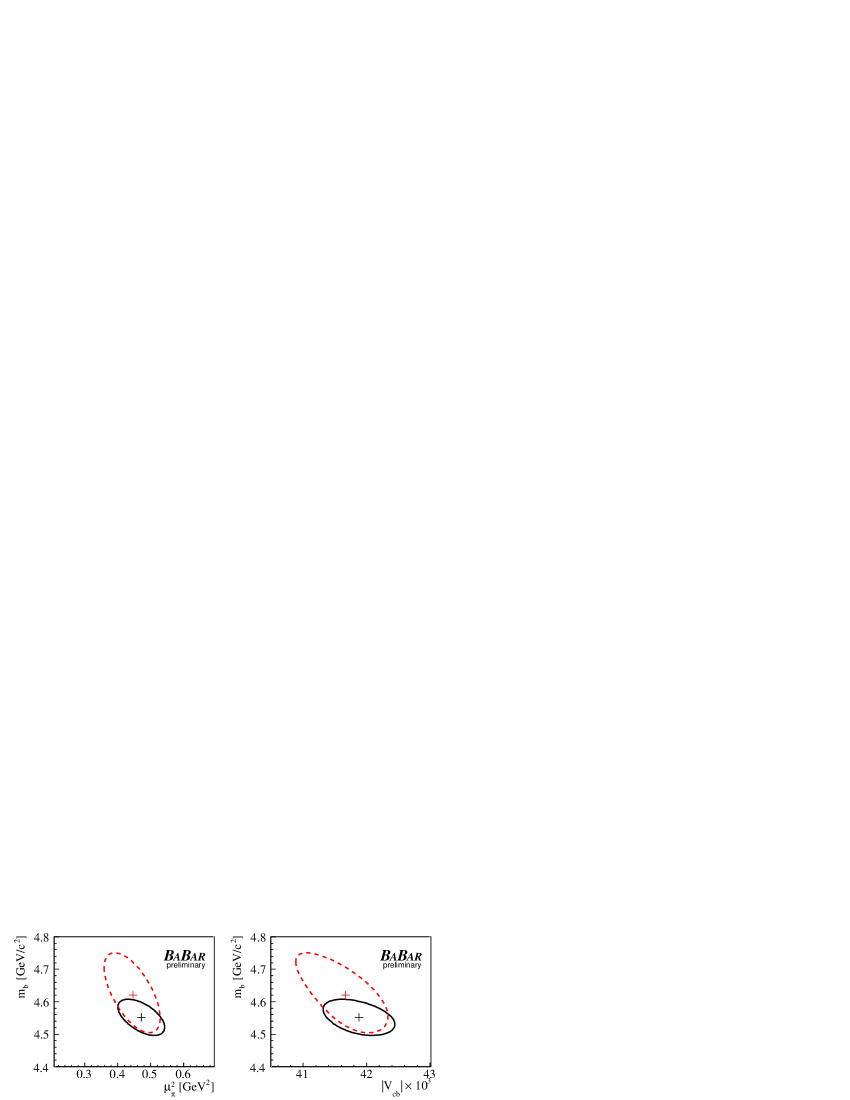
Figure 11 shows the contours in the and
planes. It compares the standard fit including photon energy moments, and
a fit based on moments from semileptonic decays only, clearly indicating the
significance of the constraints from the decays for both and .
Table 1: Fit results with experimental and theoretical uncertainties. For we take an
additional theoretical uncertainty of from the uncertainty in the expansion
of into account. Correlations coefficients for all parameters are summarized
below the results.
Results
41.88
4.552
1.070
10.597
0.471
0.330
0.220
-0.159
0.44
0.038
0.055
0.171
0.034
0.042
0.021
0.081
0.35
0.040
0.065
0.053
0.062
0.043
0.042
0.050
0.59
0.81
0.055
0.085
0.179
0.070
0.060
0.047
0.095
1.00
-0.42
-0.27
0.75
0.42
-0.28
0.25
0.10
1.00
0.96
0.09
-0.56
-0.07
-0.38
-0.24
1.00
0.15
-0.63
-0.32
-0.51
-0.15
1.00
0.09
-0.10
0.02
-0.04
1.00
0.40
0.87
0.10
1.00
0.41
-0.05
1.00
-0.21
1.00
Figure 11: contours for the fit results in the and
planes comparing the results of the presented fit (black line) with those of a fit
omitting the photon-energy moments (red dashed line).
VII Summary
We have reported preliminary results for the moments with
of the hadronic mass distribution in semileptonic
-meson decays to final states containing a charm quark.
In addition we have presented preliminary results for a first measurement of the moments
for with a combination of mass and energy
of the hadronic system .
The results for the mass moments agree with the previous measurements
Csorna et al. (2004); Aubert et al. (2004a); Acosta et al. (2005); Abdallah et al. (2006); Schwanda et al. (2007)
but tend in general to higher values, between and for and
, respectively, relative to the previous BABAR measurement Aubert et al. (2004a). The increased data sample compared to the
previous BABAR measurement led to significantly smaller statistical
uncertainties which are smaller than the systematic uncertainties.
We have made a combined fit in the kinetic scheme to the
hadronic mass moments, measured moments of the lepton-energy
spectrum Aubert et al. (2004b), and moments of the
photon energy spectrum in decays Aubert et al. (2005, 2006).
The combined fit yields preliminary results for , the quark masses and ,
the total semileptonic branching fraction , and the dominant
non-perturbative HQE parameters in agreement with previous determinations.
We obtain and
.
We are grateful for the
extraordinary contributions of our PEP-II colleagues in
achieving the excellent luminosity and machine conditions
that have made this work possible.
The success of this project also relies critically on the
expertise and dedication of the computing organizations that
support BABAR.
The collaborating institutions wish to thank
SLAC for its support and the kind hospitality extended to them.
This work is supported by the
US Department of Energy
and National Science Foundation, the
Natural Sciences and Engineering Research Council (Canada),
the Commissariat à l’Energie Atomique and
Institut National de Physique Nucléaire et de Physique des Particules
(France), the
Bundesministerium für Bildung und Forschung and
Deutsche Forschungsgemeinschaft
(Germany), the
Istituto Nazionale di Fisica Nucleare (Italy),
the Foundation for Fundamental Research on Matter (The Netherlands),
the Research Council of Norway, the
Ministry of Science and Technology of the Russian Federation,
Ministerio de Educación y Ciencia (Spain), and the
Science and Technology Facilities Council (United Kingdom).
Individuals have received support from
the Marie-Curie IEF program (European Union) and
the A. P. Sloan Foundation.
References
Csorna et al. (2004)
S. E. Csorna et al. (CLEO Collaboration),
Phys. Rev. D 70,
032002 (2004).
Aubert et al. (2004a)
B. Aubert et al. (BABAR Collaboration),
Phys. Rev. D 69,
111103 (2004a).
Acosta et al. (2005)
D. Acosta et al. (CDF Collaboration),
Phys. Rev. D 71,
051103 (2005).
Abdallah et al. (2006)
J. Abdallah et al. (DELPHI Collaboration),
Eur. Phys. J. C 45,
35 (2006).
Schwanda et al. (2007)
C. Schwanda et al. (Belle Collaboration),
Phys. Rev. D 75,
032005 (2007).
Aubert et al. (2004b)
B. Aubert et al. (BABAR Collaboration),
Phys. Rev. D 69,
111104 (2004b).
Abe et al. (2005)
K. Abe et al. (Belle Collaboration),
hep-ex/0508056 (2005).
Chen et al. (2001)
S. Chen et al. (CLEO Collaboration),
Phys. Rev. Lett. 87,
251807 (2001).
Koppenburg et al. (2004)
P. Koppenburg et al. (Belle Collaboration),
Phys. Rev. Lett. 93,
061803 (2004).
Aubert et al. (2005)
B. Aubert et al. (BABAR Collaboration),
Phys. Rev. D 72,
052004 (2005).
Aubert et al. (2006)
B. Aubert et al. (BABAR Collaboration),
Phys. Rev. Lett. 97,
171803 (2006).
Buchmüller and
Flächer (2006)
O. Buchmüller
and
H. Flächer,
Phys. Rev. D 73,
073008 (2006).
Bauer et al. (2004)
C. W. Bauer et al., Phys. Rev. D 70,
094017 (2004).
Gambino and
Uraltsev (2004)
P. Gambino and
N. Uraltsev,
Eur. Phys. J. C 34,
181 (2004).
Aubert et al. (2002)
B. Aubert et al. (BABAR Collaboration),
Nucl. Instrum. Meth. A 479,
1 (2002).
PEP-II: An Asymmetric B Factory. Conceptual
Design Report (1993)
PEP-II: An Asymmetric Factory. Conceptual
Design Report, SLAC-R-418 (1993).
Agostinelli et al. (2003)
S. Agostinelli et al. ( Collaboration),
Nucl. Instrum. Meth. A 506,
250 (2003).
Lange (2001)
D. J. Lange,
Nucl. Instrum. Meth. A 462,
152 (2001).
Richter-Was (1993)
E. Richter-Was,
Phys. Lett. B 303,
163 (1993).
Duboscq et al. (1996)
J. E. Duboscq et al. (CLEO Collaboration),
Phys. Rev. Lett. 76,
3898 (1996).
Scora and Isgur (1995)
D. Scora and
N. Isgur,
Phys. Rev. D 52,
2783 (1995).
Goity and Roberts (1995)
J. L. Goity and
W. Roberts,
Phys. Rev. D 51,
3459 (1995).
Aubert et al. (2004c)
B. Aubert et al. (BABAR Collaboration),
Phys. Rev. Lett. 92,
071802 (2004c).
Albrecht et al. (1987)
H. Albrecht et al. (ARGUS Collaboration),
Phys. Lett. B 185,
218 (1987).
Skwarnicki (1986)
T. Skwarnicki
(Crystal Ball Collaboration), DESY
F31-86-02 (1986).
Yao et al. (2006)
W.-M. Yao et al. (Particle Data Group (PDG)),
Journal of Physics G 33,
1 (2006),
URL http://pdg.lbl.gov.
Voloshin and Shifman (1985)
M. Voloshin and
M. Shifman,
Sov. J. Nucl. Phys. 41,
120 (1985).
Chay et al. (1990)
J. Chay,
H. Georgi, and
B. Grinstein,
Phys. Lett. B 247,
399 (1990).
Bigi and Uraltsev (1992)
I. I. Y. Bigi and
N. G. Uraltsev,
Phys. Lett. B 280,
271 (1992).
Bigi et al. (1992)
I. I. Bigi,
N. Uraltsev, and
A. I. Vainshtein,
Phys. Lett. B 293
(1992).
Bigi et al. (1993)
I. I. Bigi,
M. Shifman,
N. G. Uraltsev,
and
A. Vainshtein,
Phys. Rev. Lett. 71,
496 (1993).
Blok et al. (1994)
B. Blok,
L. Koyrakh,
M. Shifman, and
A. I. Vainshtein,
Phys. Rev. D 49,
3356 (1994).
Manohar and Wise (1994)
A. V. Manohar and
M. B. Wise,
Phys. Rev. D 49,
1310 (1994).
Gremm and Kapustin (1997)
M. Gremm and
A. Kapustin,
Phys. Rev. D 55,
6924 (1997).
Benson et al. (2003)
D. Benson,
I. I. Bigi,
T. Mannel, and
N. Uraltsev,
Nucl. Phys. B665,
367 (2003).
Benson et al. (2005)
D. Benson,
I. I. Bigi, and
N. Uraltsev,
Nucl. Phys. B710,
371 (2005).
Aquila et al. (2005)
V. Aquila,
P. Gambino,
G. Ridolfi, and
N. Uraltsev,
Nucl. Phys. B719,
77 (2005).
Uraltsev (2005)
N. Uraltsev,
Int. J. Mod. Phys. A 20,
2099 (2005).
Bigi et al. (2007)
I. I. Bigi,
N. Uraltsev, and
R. Zwicky,
Eur. Phys. J. C 50,
539 (2007).
Bigi et al. (1997)
I. Bigi,
M. Shifman,
N. Uraltsev, and
A. Vainshtein,
Phys. Rev. D 56,
4017 (1997).
Aubert et al. (2004d)
B. Aubert et al. (BABAR Collaboration),
Phys. Rev. Lett. 93,
011803 (2004d).
Table A.I: Results for the moments with for different cuts on the
minimal lepton momentum with absolute statistical and systematic uncertainties.
Individual errors sources are specified due to modeling of the
signal events, the calibration procedure, the background
subtraction, detector efficiencies and resolution, and stability of
moment measurements. Minimum lepton momenta cuts are given in .
Moments and uncertainties are given in .
Signal Model
BG subtr.
Detector
Stability
1
0.8
2.0958
0.0045
0.0042
0.0044
0.0095
0.0000
0.9
2.0920
0.0039
0.0040
0.0042
0.0082
0.0000
1.0
2.0872
0.0038
0.0041
0.0041
0.0070
0.0009
1.1
2.0796
0.0036
0.0035
0.0041
0.0066
0.0000
1.2
2.0717
0.0035
0.0047
0.0043
0.0067
0.0032
1.3
2.0661
0.0032
0.0054
0.0045
0.0067
0.0077
1.4
2.0583
0.0028
0.0059
0.0048
0.0065
0.0075
1.5
2.0518
0.0025
0.0063
0.0053
0.0071
0.0045
1.6
2.0433
0.0025
0.0077
0.0060
0.0079
0.0000
1.7
2.0378
0.0024
0.0075
0.0073
0.0080
0.0091
1.8
2.0379
0.0025
0.0070
0.0089
0.0096
0.0075
1.9
2.0350
0.0020
0.0098
0.0121
0.0121
0.0107
2
0.8
4.457
0.022
0.016
0.018
0.046
0.000
0.9
4.430
0.020
0.014
0.016
0.038
0.000
1.0
4.407
0.019
0.014
0.015
0.030
0.000
1.1
4.368
0.018
0.011
0.014
0.029
0.000
1.2
4.330
0.017
0.016
0.014
0.027
0.015
1.3
4.299
0.015
0.018
0.015
0.027
0.033
1.4
4.263
0.014
0.020
0.016
0.026
0.031
1.5
4.231
0.012
0.021
0.018
0.027
0.019
1.6
4.186
0.012
0.026
0.020
0.031
0.000
1.7
4.157
0.011
0.024
0.024
0.031
0.030
1.8
4.151
0.011
0.022
0.029
0.036
0.025
1.9
4.128
0.008
0.035
0.040
0.045
0.031
3
0.8
9.67
0.09
0.05
0.06
0.17
0.00
0.9
9.54
0.08
0.04
0.05
0.14
0.00
1.0
9.45
0.07
0.04
0.04
0.10
0.00
1.1
9.30
0.07
0.03
0.04
0.10
0.00
1.2
9.16
0.07
0.04
0.04
0.09
0.04
1.3
9.04
0.06
0.05
0.04
0.08
0.11
1.4
8.92
0.05
0.05
0.04
0.08
0.10
1.5
8.79
0.05
0.05
0.05
0.08
0.06
1.6
8.62
0.04
0.06
0.05
0.09
0.00
1.7
8.51
0.04
0.06
0.06
0.09
0.07
1.8
8.47
0.04
0.05
0.07
0.10
0.05
1.9
8.37
0.03
0.10
0.10
0.13
0.06
Table A.II: Results for the moments with for different cuts on the
minimal lepton momentum with absolute statistical and systematic uncertainties.
Individual errors sources are specified due to modeling of the
signal events, the calibration procedure, the background
subtraction, detector efficiencies and resolution, and stability of
moment measurements. Minimum lepton momenta cuts are given in .
Moments and uncertainties are given in .
Signal Model
BG subtr.
Detector
Stability
4
0.8
21.58
0.30
0.12
0.21
0.61
0.00
0.9
20.98
0.26
0.09
0.15
0.48
0.00
1.0
20.69
0.26
0.09
0.12
0.32
0.00
1.1
20.17
0.24
0.06
0.11
0.29
0.00
1.2
19.70
0.23
0.09
0.10
0.26
0.13
1.3
19.28
0.19
0.10
0.10
0.23
0.32
1.4
18.89
0.17
0.11
0.10
0.22
0.29
1.5
18.45
0.15
0.12
0.11
0.23
0.18
1.6
17.89
0.13
0.14
0.12
0.25
0.00
1.7
17.51
0.12
0.13
0.14
0.25
0.14
1.8
17.33
0.11
0.11
0.17
0.27
0.09
1.9
16.98
0.08
0.24
0.24
0.34
0.04
5
0.8
49.83
1.02
0.40
0.70
2.10
0.00
0.9
47.33
0.90
0.22
0.47
1.60
0.00
1.0
46.40
0.87
0.21
0.36
1.00
0.00
1.1
44.67
0.80
0.10
0.29
0.87
0.00
1.2
43.22
0.74
0.19
0.25
0.75
0.35
1.3
41.84
0.62
0.21
0.24
0.64
0.92
1.4
40.69
0.54
0.23
0.23
0.59
0.84
1.5
39.21
0.45
0.25
0.25
0.60
0.53
1.6
37.46
0.39
0.30
0.27
0.68
0.00
1.7
36.31
0.35
0.25
0.32
0.66
0.26
1.8
35.68
0.31
0.20
0.39
0.68
0.00
1.9
34.57
0.23
0.58
0.53
0.84
0.00
6
0.8
119.64
4.19
6.19
2.28
6.89
0.00
0.9
109.40
3.85
4.13
1.43
5.19
0.00
1.0
106.41
3.83
2.86
1.03
3.11
0.00
1.1
100.70
3.34
1.87
0.80
2.66
0.00
1.2
96.71
2.95
1.47
0.60
2.17
0.00
1.3
92.56
2.43
1.07
0.55
1.67
2.01
1.4
89.20
2.10
0.65
0.54
1.67
1.94
1.5
84.54
1.84
0.58
0.56
1.63
1.58
1.6
79.35
1.62
0.60
0.61
1.75
0.00
1.7
76.01
1.73
0.46
0.71
1.68
0.37
1.8
73.97
2.41
0.35
0.87
1.66
0.00
1.9
70.67
3.91
1.34
1.17
2.04
0.00
Table A.III: Results for for for all cuts .
The systematic uncertainties are grouped in four categories having related sources: rec. efficiency is the sum of
neutral and charged reconstruction efficiency differences data/MC, data/MC mismod. contains the errors from
differences and multiplicity differences, bg. decays sums all contributions from the variation of
the residual background component (including the fake lepton background), and signal model sums the impact of the
variation of the signal decay branching fractions and the error related to the bias correction.
[ ]
rec.
data/MC
signal
efficiency
mismod.
bg. decays
model
2
0.8
1.456
0.048
0.090
0.054
0.071
0.010
0.009
0.9
1.447
0.040
0.053
0.038
0.035
0.010
0.006
1.0
1.440
0.035
0.056
0.042
0.035
0.008
0.008
1.1
1.395
0.032
0.054
0.038
0.035
0.006
0.014
1.2
1.376
0.030
0.051
0.035
0.034
0.004
0.012
1.3
1.356
0.029
0.049
0.032
0.034
0.004
0.011
1.4
1.327
0.027
0.047
0.032
0.034
0.004
0.009
1.5
1.321
0.028
0.046
0.030
0.033
0.004
0.008
1.6
1.318
0.028
0.044
0.027
0.034
0.004
0.007
1.7
1.295
0.030
0.044
0.027
0.034
0.005
0.006
1.8
1.270
0.035
0.045
0.028
0.034
0.006
0.006
1.9
1.193
0.040
0.043
0.021
0.033
0.007
0.015
4
0.8
3.32
0.46
0.69
0.34
0.59
0.08
0.12
0.9
3.24
0.35
0.26
0.17
0.16
0.07
0.10
1.0
3.15
0.25
0.27
0.19
0.16
0.05
0.11
1.1
2.73
0.20
0.24
0.13
0.16
0.04
0.12
1.2
2.60
0.16
0.23
0.11
0.16
0.01
0.12
1.3
2.44
0.13
0.22
0.09
0.16
0.02
0.11
1.4
2.32
0.12
0.20
0.07
0.16
0.01
0.10
1.5
2.26
0.11
0.21
0.08
0.16
0.01
0.11
1.6
2.13
0.09
0.10
0.06
0.07
0.00
0.05
1.7
1.94
0.09
0.10
0.05
0.07
0.00
0.05
1.8
1.82
0.09
0.11
0.06
0.06
0.00
0.06
1.9
1.58
0.09
0.08
0.05
0.06
0.00
0.03
6
0.8
12.52
4.21
5.80
2.83
4.95
0.63
0.82
0.9
12.00
3.21
1.74
1.13
1.05
0.55
0.59
1.0
10.98
2.05
1.75
1.22
1.04
0.35
0.61
1.1
7.25
1.34
1.32
0.63
1.04
0.22
0.47
1.2
6.48
0.97
1.25
0.54
1.03
0.09
0.46
1.3
5.60
0.75
1.17
0.35
1.03
0.08
0.41
1.4
5.12
0.56
1.09
0.17
1.03
0.03
0.33
1.5
4.85
0.49
1.11
0.19
1.02
0.02
0.39
1.6
4.02
0.32
0.28
0.16
0.18
0.02
0.15
1.7
3.38
0.26
0.25
0.12
0.18
0.01
0.13
1.8
3.02
0.23
0.29
0.14
0.17
0.01
0.17
1.9
2.44
0.20
0.21
0.11
0.17
0.02
0.05
Table A.IV: Results for for all measured cuts on .
0.8
1.20
0.34
0.57
0.9
1.15
0.25
0.28
1.0
1.08
0.16
0.21
1.1
0.78
0.12
0.17
1.2
0.71
0.10
0.16
1.3
0.60
0.08
0.14
1.4
0.56
0.07
0.13
1.5
0.52
0.06
0.14
1.6
0.39
0.05
0.08
1.7
0.27
0.05
0.08
1.8
0.21
0.05
0.09
1.9
0.16
0.06
0.09
Table A.V: Results for for all measured cuts on .
0.8
1.21
0.40
0.69
0.9
1.16
0.30
0.35
1.0
1.09
0.20
0.28
1.1
0.78
0.15
0.22
1.2
0.71
0.12
0.20
1.3
0.60
0.09
0.18
1.4
0.56
0.08
0.16
1.5
0.52
0.07
0.16
1.6
0.39
0.05
0.06
1.7
0.27
0.05
0.04
1.8
0.21
0.03
0.05
1.9
0.19
0.02
0.02
Table A.VI: Results for for all measured cuts on .
0.8
4.19
2.38
3.92
0.9
3.99
1.85
1.99
1.0
3.33
1.13
1.36
1.1
1.26
0.66
0.84
1.2
0.96
0.43
0.67
1.3
0.68
0.34
0.59
1.4
0.57
0.22
0.53
1.5
0.51
0.18
0.53
1.6
0.18
0.12
0.17
1.7
0.18
0.11
0.16
1.8
0.19
0.12
0.19
1.9
0.16
0.15
0.21
Table A.VII: Results for for all measured cuts on .