The XMM-Newton view of IRAS 091044109:
evidence for a changing-look Type 2 quasar?
Abstract
Aims. We report on a 14 ks XMM–Newton observation of the hyperluminous infrared galaxy IRAS 091044109, which harbors a Type 2 quasar in its nucleus. Our analysis was aimed at studying the properties of the absorbing matter and the Fe K complex at 6-7 keV in this source.
Methods. We analyzed the spectroscopic data from the PN and the MOS cameras in the 0.4–10 keV band. We also used an archival BeppoSAX 1–50 keV observation of IRAS 091044109 to investigate possible variations of the quasar emission.
Results. The X-ray emission in the EPIC band is dominated by the intra-cluster medium thermal emission. We found that the quasar contributes 35% of the total flux in the 2-10 keV band. Both a transmission- (through a Compton-thin absorber with a Compton optical depth of 0.3, i.e. NH 5 1023 cm-2) and a reflection-dominated ( 1) model provide an excellent fit to the quasar continuum emission. However, the value measured for the EW of Fe K emission line is only marginally consistent with the presence of a Compton-thick absorber in a reflection-dominated scenario, which had been suggested by a previous, marginal (i.e. 2.5) detection with the hard X-ray (15–50 keV), non-imaging BeppoSAX/PDS instrument. Moreover, the value of luminosity in the 2–10 keV band measured by the transmission-dominated model is fully consistent with that expected on the basis of the bolometric luminosity of IRAS 091044109. From the analysis of the XMM–Newton data we therefore suggest the possibility that the absorber along the line of sight to the nucleus of IRAS 091044109 is Compton-thin. Alternatively, the absorber column density could have changed from Compton-thick to -thin in the five years elapsed between the observations. If this is the case, then IRAS 091044109 is the first “changing-look” quasar ever detected.
Key Words.:
Galaxies: individual: IRAS 09104+4109 – Galaxies: active – Galaxies: nuclei – X-ray: galaxies1 Introduction
IRAS 091044109 is one the most powerful objects in the 0.5 Universe. It is a hyperluminous infrared cD galaxy of IR luminosity at = 0.442, residing in the core of a rich cluster of galaxies (Kleinmann et al. 1988). Its optical spectrum shows only narrow emission lines, but broad Balmer and Mg II emission lines were observed in the polarized light (Hines & Wills 1993; Tran et al. 2000). These pieces of evidence have led to the conclusion that a dust-enshrouded Type 2 quasar lies in the nucleus of IRAS 091044109.
The X-ray observations of IRAS 091044109 collected so far lend support to this suggestion. Franceschini et al. (2000; F00) reported on the analysis of a BeppoSAX observation of this source. They found that the X-ray spectrum below 10 keV is dominated by the intra-cluster medium (ICM) thermal (T 5.5 keV) emission. The detection of a weak signal in the 15–60 keV band with the PDS instrument was interpreted by F00 as the primary emission of the buried quasar, which emerges from an absorbing screen of NH 5 1024 cm-2. They also reported on the marginal detection of a neutral Fe K emission line with an equivalent width (EW) of 1–2 keV, consistent with a reflection-dominated scenario for the quasar emission in the 2-10 keV band. This evidence makes this source the best example of a Compton-thick Type 2 quasar found to date. Exploiting the high spatial resolution of Chandra, Iwasawa et al. 2001 (I01 hereafter) were able to analyze the spectral data of the central source embedded in the extended ICM emission. Although limited by the low statistics ( 200 counts in the range 0.6-7 keV), these data allowed to confirm the presence of a heavily obscured quasar and, by the comparison with the BeppoSAX PDS flux, I01 concluded that the Chandra spectrum is also reflection-dominated.
2 XMM–Newton observation and data reduction
IRAS 091044109 was observed with XMM–Newton (Jansen et al. 2001 and references therein) on April 27, 2003 for 14 ks. The EPIC PN and MOS observations were carried out in the full frame mode using the Medium filter. XMM–Newton data were processed with SAS v6.5. We used the EPCHAIN and EMCHAIN tasks for processing the raw PN and MOS data files, respectively, to generate the relative linearized event files. X–ray events corresponding to patterns 0–12(0–4) for the MOS(PN) cameras were selected. Hot and bad pixels were removed. The event lists were furthermore filtered to ignore periods of high background flaring according to the method presented in Piconcelli et al. (2004) based on the cumulative distribution function of background lightcurve count-rates. Final net exposures of 10.8, 13.4, and 13.4 ks were obtained for PN, MOS1 and MOS2, respectively. The source photons were extracted for the PN(MOS) camera from a circular region with a radius of 37(40) arcsec, while the background counts were estimated from a larger (i.e. 75 arcsec radius) source-free region on the same chip. Appropriate response and ancillary files for all the EPIC cameras were created using respectively RMFGEN and ARFGEN tasks in the SAS. Combined MOS1MOS2 spectrum and response matrix were created.
| Modela | T | NH | EKα | IKα | EWKα | (dof) | |||
|---|---|---|---|---|---|---|---|---|---|
| (1) | (2) | (3) | (4) | (5) | (6) | (7) | (8) | (9) | (10) |
| (A) | 3.9 | 0.47 | 4.68 | 7.95 | 4.8 | 6.38 | 8.7 | 390 | 0.94(219) |
| (B) | 3.6 | 0.48 | 5.57 | 2.05 | 6.38 | 4.0 | 402 | 0.96(220) |
a (A) transmission model; (B) reflection model; b absorption-corrected line against absorption-corrected continuum; c with respect to the pure reflection component.
Light-curves in the 0.2–2 keV and 2–15 keV band were extracted. Both light-curves are consistent with a constant flux level over the whole XMM–Newton exposure.
3 Spectral modelling
Both PN and MOS spectra were grouped to have a minimum of 20 counts per bin to allow the use of minimization technique and fitted simultaneously. Given the current calibration uncertainties, we discarded events below 0.4 keV and above 10 keV. All fits were performed using the XSPEC package (v11.3) and included the Galactic column density value of NH=1.81 1020 cm-2 (Murphy et al. 1996). Best-fit parameter values are given in the source frame, unless otherwise specified. The quoted errors on the model parameters correspond to a 90% confidence level for one interesting parameter ( = 2.71; Avni 1976). A cosmology with (,) = (0.3,0.7) and a = 70 km s-1 Mpc-1 is assumed throughout.
The high-resolution ( 1 arcsec) Chandra observation of IRAS 091044109 presented by I01 has definitively established that the emission from the ICM dominates the X-ray spectrum below 10 keV. Furthermore IRAS 091044109 is a massive cooling-flow cluster (Fabian & Crawford 1995) showing a large radial temperature gradient, from T 3.3 keV in the bright, cool core up to T 7.8 keV at a distance of 200 kpc, i.e. 36 arcsec (I01). For this reason, we initially fitted the combined PNMOS spectrum with a model consisting of two thermal plasma emission components (i.e. MEKAL in XSPEC) plus an absorbed power law. We fixed the temperature of one thermal component to 7.8 keV in order not to underestimate the total ICM emission in the hard X-ray band. Since the photon index of the power law was loosely constrained ( 1.41) we fixed it to 1.8, which is the average value typically observed for radio-quiet quasars (e.g. Piconcelli et al. 2005).
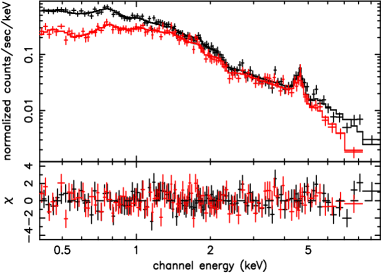
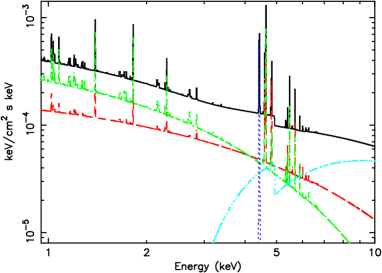
This model (transmission model hereafter) gave an excellent description of the EPIC data with a (dof) =0.94(219) (see Fig. 1). The best-fit values of the spectral parameters are listed in Table 1. The value of 4.8 1023 cm-2 found for the column density translates in a Compton optical depth 0.3 of the absorbing screen. The value of temperature (T = 3.9 keV) in the cluster core and metallicity ( = 0.47) of the ICM are consistent with I01.
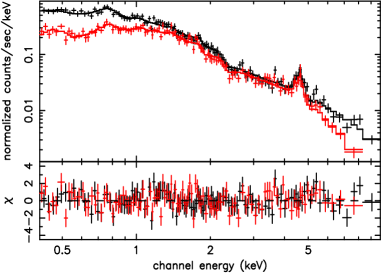
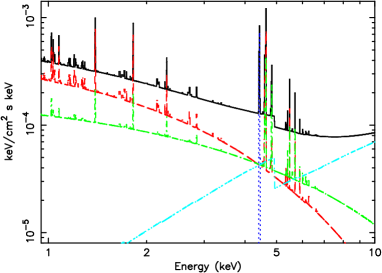
Works based on BeppoSAX and Chandra observations favored an interpretation of the spectrum of IRAS 091044109 below 10 keV in terms of reflection-dominated emission. We therefore replaced the absorbed power law in the transmission model with a Compton reflection component from neutral matter (i.e. PEXRAV model in XSPEC). For this spectral component, which is due to the reprocessing of the emission from the obscured primary X-ray source, we assumed a = 1.8 for the photon index of the incident power law, along with an inclination angle of = 50 deg (Tran et al. 2000) and solar metallicity for the reflector. This model (reflection model hereafter) yielded an equally good fit to the XMM–Newton spectrum with a final (dof)= 0.96(220) (see Table 1 and Fig. 2). According to both spectral models, the contribution of the quasar component to the total flux in the 2–10 keV band is 30–35%.
As shown in Figs. 1a and 2a, there is a prominent line-like emission feature at 4-5 keV (observer-frame) which is broader than the instrumental resolution at this energy and most likely due to a blend of lines associated with Fe K emission. This complex is partly accounted for by the strong FeXXV K emission line at 6.7 keV and the FeXXVI K emission line at 6.97 keV (which should be likely blended with a weak Fe K line at 7.06 keV due to the reprocessing of the quasar continuum) from the two-temperature ICM. However, significant (at 99% confidence level) positive residuals are still present. We modelled this excess with an unresolved Gaussian emission line at 6.38 keV. This energy is consistent with a range of ionization states from FeI to FeXVI (Kallman et al. 2004), as typically observed in quasars (Jimenez-Bailon et al. 2005). In the “reflection-dominated” scenario we measure an equivalent width of the Fe K line at 6.4 keV of EWKα = 402 eV (calculated with respect to the Compton reflection component). For the transmission model (i.e. assuming that the line and the continuum are both absorbed) we derive EWKα = 390 eV (see Table 1).
3.1 A comparison with broadband 1–50 keV BeppoSAX data
To investigate on the possible year-timescale variability of the overall continuum spectral shape, we plot in Fig. 3a the unfolded 2003 PN and 1998 BeppoSAX MECS+PDS spectra. These data have been unfolded through the instrument response with respect to the best-fit model found by F00 (i.e. ICM thermal emission component absorbed powerlaw reflection narrow Gaussian line at 6.4 keV; model sax98 hereafter). As expected, the 1–10 keV XMM–Newton and BeppoSAX spectra have similar shape being dominated by the ICM emission. The different normalizations of the two spectra can be ascribed to the different source extraction regions. In particular, a fraction of ICM emission from the outskirt region of the cluster spreads outside the PN/MOS extraction radius. Interestingly, the PDS data above 10 keV appear to lie slightly above the extrapolation of the MECS/PN continuum level. We calculated a 20–30 keV flux level of 6.1 10-13 and 1.3 10-12 erg cm-2 s-1 for the transmission111In the case of this model, we also added to the model a Compton reflection component with = 1 (where is the solid angle in units of 2 subtended by the reflecting material) as commonly observed in the 10–50 keV AGN spectra (e.g. Risaliti 2002; Reeves et al. 2006). and reflection model, respectively. The 20–30 keV flux of IRAS 091044109 measured by BeppoSAX is = 2.55 10-12 erg cm-2 s-1, whereby the extrapolated XMM–Newton flux in this band is fainter by a factor of 1.6–7.3, if the transmission model is assumed. On the other hand, the 20–30 keV flux estimated by reflection model is consistent with the BeppoSAX value.
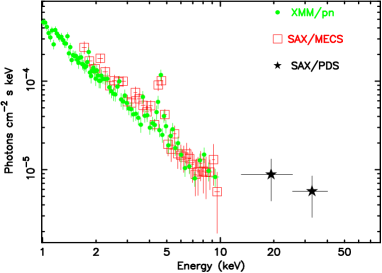
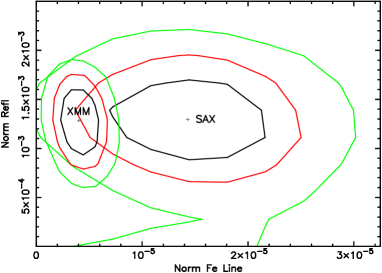
Fig. 3b shows the iso- contour plot of the intensity of the Fe K emission line at 6.4 keV (IKα) versus the intensity of the reflection continuum for the 1998 BeppoSAX and 2003 XMM–Newton observations. The XMM–Newton values were derived by the reflection model, while for the BeppoSAX data we employed the sax98 model (temperature and abundance of the ICM were permitted to vary within the 90% confidence interval measured for these parameters with XMM–Newton, e.g. Table 1). These measurements taken at different epochs are consistent within 3 errors, as expected if Compton hump and cold iron emission arise from distant material. Furthermore, the XMM–Newton measurements are also compatible with the values of IKα = 7.2 10-6 photons cm-2 s-1 and EWKα = 1.1 keV reported by I01 on the basis of a 1999 Chandra observation of IRAS 091044109. The mean values of EWKα were significantly larger, but the errors were also very large in the low S/N BeppoSAX and Chandra spectra.
4 Discussion
The XMM–Newton observation presented here has confirmed the presence of a heavily absorbed quasar in the nucleus of the hyperluminous infrared galaxy IRAS 091044109. The EPIC energy range is dominated by the thermal emission of the ICM and we estimated that the quasar contributes approximately 30–35% of the total 2–10 keV flux. We were able to accurately study the Fe K complex at 6–7 keV in this source, modelling it with three distinct narrow emission lines from FeI–XVI K, FeXXV K and FeXXVI K transition, respectively. The highly ionized Fe K lines originate in the ICM, while the line from cold iron is likely due to reprocessing of the quasar continuum off the circumnuclear environment. The better quality of EPIC data has allowed to overcome the problems of limited spectral resolution and statistics of BeppoSAX data (e.g. F00), which prevented a correct estimate of the contribution from the different ions to the Fe emission complex.
The quasar emission can be equally well fitted by either a transmission or a reflection model. The former implies a
Compton-thin absorber with NH 5 1023 cm-2, while the latter
suggests a scenario where the primary X-ray continuum is blocked by a
Compton-thick ( 1, i.e. NH 1.6
1024 cm-2) obscuring screen and the emission observed by XMM–Newton is
due to indirect radiation scattered into the line of sight (it is
generally assumed that the absorber and the reflector are the same
material, i.e. the torus, e.g. Matt et al. 1996; Molendi et al.
2003). Using the present data these models are statistically
indistinguishable. However, an EWKα 400200 eV
measured assuming the reflection model is significantly lower than
expected for a truly “reflection-dominated” spectrum with [Fe/H] = 0. In fact, the
most prominent feature in the 2-10 keV spectrum of a heavily obscured AGN, as
in the case of IRAS 091044109 (2 1024 NH 1025 cm-2, e.g. I01),
is a strong Fe K emission line with an EWKα 1 keV
(Levenson et al. 2002; Guainazzi et al. 2005).
This solid observational evidence matches well
with the EW value predicted by the theoretical calculations (e.g. Leahy &
Creighton 1993; Ghisellini et
al. 1994; Matt et al. 1996).
However, given the uncertainty in the reflection continuum flux
due to the presence of the diffuse cluster emission, we also conservatively estimated the
EWKα by using the lowest(highest) value in the 90% confidence interval measured for the
normalization of the reflection component(Fe K emission line) and vice versa.
We obtained a range of EWKα values spanning from 165 to 870
eV, which is
marginally consistent with the EWKα 1 keV expected for a
reflection-dominated scenario.
As the continuum flux estimated for the obscured quasar with
the reflection model ( = 4.68 10-13 erg cm-2 s-1)
is similar to the value measured with the spatially resolved Chandra spectrum ( 3.9
10-13 erg cm-2 s-1, e.g. I01), the marginal
discrepancy in the EWKα values between the two observations
arises from the different best-fit line flux intensity.
On the other hand, the EWKα = 390 eV (note the large error bars) found in the case of the transmission model is in agreement with the expected EW value of a Fe K line transmitted through an absorbing screen with NH 5 1023 cm-2 is (200–400 eV; e.g. Awaki et al. 1991; Leahy & Creighton 1993; Ghisellini et al. 1994). A scenario with a Compton-thin absorber along the line of sight to the nucleus of IRAS 091044109 is therefore physically plausible. Nonetheless, the flux difference by a factor of 1.6–7.3 between the 2003 XMM–Newton and 1998 BeppoSAX observation (a time interval of 3.5 yr at the source frame after the correction for the time dilation due to the = 0.442) in the 20-30 keV band is puzzling. In fact, given the observed power spectral densities of low black hole mass (i.e. 107 M⊙) Seyfert galaxies (Markowitz et al. 2003) and scaling linearly with the black hole mass (assuming = 2.4 109 M⊙ for the nuclear black hole in IRAS 091044109222We estimated a mass of 2.4 109 M⊙ for the black hole in the nucleus of IRAS 091044109 using the measurement of the MgII line width from Hines & Wills (1993), i.e. FWHM = 10,000 km/s, and the formula in Willott et al. (2003).), flux variations of a factor of 2 in 3.5 yr should be considered unlikely (e.g. Fiore et al. 1998). However, the major problem in the interpretation of this mismatch concerns the accuracy of BeppoSAX/PDS measurement. According to our analysis, the signal-to-noise ratio of these data is poor (only 2.5 between 15 and 50 keV). This implies that any conclusion based only on the PDS data about the Compton-thick or Compton-thin nature of the absorber in the nucleus of IRAS 091044109 could be misleading. The addition of a primary continuum power-law component modified by a Compton-thick absorber (i.e. similarly to the best-fit model proposed by F00 for the BeppoSAX broadband spectrum) might easily account for the above flux discrepancy, but, as stressed above, a scenario with a Compton-thick absorber for the EPIC spectrum is at odds with the inferred quite small value (i.e. 1 keV) of the Fe K EW.
Given the large 1.3∘ FWHM PDS field of view (FOV),
PDS data might be affected by the contamination of very hard X-ray
sources possibly located outside the XMM–Newton and Chandra 15 arcmin radius FOVs.
If a power-law source with = 1.8 is assumed, the 20–30 keV flux
measured for
the PDS source ( 2.55 10-12 erg cm-2 s-1) is translated
to 7.5 10-12 erg cm-2 s-1.
According to the RXTE all-sky slew survey log – log function in the
2–10 keV band (Revnivtsev et al. 2004), at this flux level 0.025 sources are
expected in a 1.5 deg2 area, which translates into a probability of 2.4%.
Moreover, using the NED and SIMBAD catalogs we found a probable contaminating source
in the H2O maser galaxy NGC 2782 ( = 0.008), which
is located at 50 arcmin away
from IRAS 091044109. The Chandra spectrum of this source (with a nuclear X-ray flux of a few
times 10-13 erg cm-2 s-1) strongly suggests the
presence of a heavily (NH 1024 cm-2) absorbed AGN (Zhang et
al. 2006), whereby it is likely that NGC 2782 provides a sizable contribution
to the 20–30 keV flux measured with the PDS. Assuming a
pure reflection model, we estimated a 6 10-13 erg cm-2 s-1,
which must be considered a lower limit of the 20–30 keV emission from
NGC 2782, because of the likely presence of the nuclear continuum emerging
after transmission through the absorber.
Alternatively, IRAS 091044109 could represent the first example of a “changing-look” quasar (Guainazzi et al. 2002; Matt et al. 2003 and reference therein) ever detected given that the XMM–Newton data are better explained by a transmission-dominated model with NH 5 1023 cm-2 while, if the PDS emission is entirely due to IRAS 091044109, the BeppoSAX data are consistent with a reflection-dominated spectral state. In fact, similar spectral transitions from a Compton-thick to a Compton-thin state (or vice-versa) have been observed, but only in Seyfert-like AGNs so far. This scenario implies a dramatic decrease (a factor of 5–10) in the line-of-sight absorbing column density during a timescale of 5 years and, in turn, suggests the presence of a largely inhomogeneous obscuring circumnuclear gas (Elvis et al. 2004; Elitzur & Shlosman 2006). We estimated the line-of-sight crossing-time of an obscuring cloud in Keplerian motion around the central black hole of 2.4 109 M⊙ to explain the possible transition from a reflection-dominated to a transmission-dominated spectrum. We assumed a scenario similar to that described for NGC 1365 in Risaliti et al. (2007) (or NGC 3227, e.g. Lamer et al. 2003) where they found that the Compton-thick obscuring material responsible of the spectral transition is located in the broad line region (BLR) and the size of the X-ray emitting region is 100 RG. We estimated a distance of the BLR = 0.14 pc using the empirical relation – in Kaspi et al. (2000). The redshift-corrected crossing-time (Guainazzi et al. 2002) of a Keplerian cloud covering a region of size 100 RG around a black hole of 2.4 109 M⊙ is 1.7 yr. Such a value is therefore consistent with the 3.5 yr (source frame) elapsed between the BeppoSAX and XMM–Newton observation.
Finally, we calculated a ratio /Lbol = 0.016 using the
2–10 keV luminosity
of = 7.95 1044 erg s-1 measured
for the transmission-scenario (see Table 1), and a bolometric luminosity of
Lbol( LIR) = 4.7 1046 erg s-1,
which is largely dominated by the obscured quasar (e.g. Hines et
al. 1999; Spoon et al. 2007).
We also derived the value of expected for IRAS 091044109 using
the value of (2500Å)/Lbol typical for quasars reported in
Elvis et al. (1994), correcting the Lbol value by a
factor of 1/3 as suggested by Fabian &
Iwasawa (1999) in order not to count twice the UV emission, and
the spectral index between 2500Å and 2 keV,
defined as = 0.384[(2 keV)/(2500Å)] (e.g.
Tananbaum et al. 1979).
In particular, we used the relation = 0.137log((2500Å)) - 2.638 reported by Steffen
et al (2006).
We converted from the monochromatic value of (2 keV) to the
value by multiplying by a factor of 1.61, applying a photon index of
= 2.
We obtained that /Lbol = 0.043 Lbol,45-0.357
(with Lbol,45=Lbol /1045 erg s-1).
This implies that the expected value of for IRAS 091044109 is 0.011, which
is close to the value of = 0.016 measured using the derived
for the transmission scenario.
Since the observed luminosity of = 2.05 1044 erg s-1 in the reflection
model should be just few percent of the intrinsic one (Comastri 2004; I01),
this result lends further support to the hypothesis of a
Compton-thin absorber along the line of sight to the nucleus of IRAS 091044109.
5 Summary
The XMM–Newton observation of IRAS 091044109 suggests the possibility that the absorber along the line of sight to the nucleus of IRAS 091044109 is Compton-thin. If this is the case, it implies a scenario completely different from that reported for this Type 2 quasar so far. It is worth stressing, however, that previous X-ray studies of IRAS 091044109 inferred a reflection-dominated nature of its 2–10 keV spectrum mainly on the basis of poor signal-to-noise 15–50 keV data taken with the non-imaging BeppoSAX/PDS detector. Future imaging spectroscopy of IRAS 091044109 performed in the 10–50 keV range, say with Simbol-X or XEUS, is therefore needed to make definitive progress in measuring the exact continuum emission from the quasar and constraining the column density of the nuclear absorber. A deep Chandra observation of IRAS 091044109 would also be useful to accurately quantify the strength of the Fe K emission line at 6.4 keV, which is a proxy for the Compton thickness of the absorber.
Acknowledgements.
We thak the referee, Dr. K. Iwasawa, for careful reading and for many useful comments that helped us to improve the manuscript. We are grateful to G. Miniutti, R. Maiolino, S. Colafrancesco and G. Risaliti for helpful discussions. Based on observations obtained with XMM–Newton, an ESA science mission with instruments and contributions directly funded by ESA Member States and NASA. This research has made use of the NASA/IPAC Extragalactic Database (NED) which is operated by the Jet Propulsion Laboratory, California Institute of Technology, under contract with the National Aeronautics and Space Administration. We acknowledge financial contribution from contract ASI-INAF I/023/05/0.References
- (1) Avni, Y., 1976, ApJ, 210, 642
- (2) Awaki, H., Koyama, K., Inoue, H., Halpern, J. P., 1991, PASJ, 43, 195
- (3) Comastri, A., 2004, in Supermassive Black Holes in the Distant Universe, ed. A. J. Barger (Kluwer Academic), 308, 245
- (4) Elitzur, M., Shlosman, I., 2006, ApJ, 648, L101
- (5) Elvis, M., et al., 1994, ApJS, 95, 1
- (6) Elvis, M., et al., 2004, ApJ, 615, L25
- (7) Fabian, A. C., Crawford, C. S., 1995, MNRAS, 274, L63
- (8) Fabian, A. C., Iwasawa, K., 1999, MNRAS, 303, L34
- (9) Fiore, F., Laor, A., Elvis, M., Nicastro, F., Giallongo, E., 1998, ApJ, 503, 607
- (10) Franceschini, A., et al., 2000, A&A, 353, 910 (F00)
- (11) Ghisellini, G., Haardt, F., Matt, G., 1994, MNRAS, 267, 743
- (12) Guainazzi, M., Matt, G., Fiore, F., Perola, G.C., 2002, A&A,388,787
- (13) Guainazzi, M., Matt, G., Perola, G. C., 2005, A&A, 444, 119
- (14) Hines, D. C., Wills, B. J., 1993, ApJ, 415, 82
- (15) Hines, D. C., Schmidt, G. D., Wills, B. J., Smith, P. S., Sowinski, L. G., 1999, Apj, 512, 145
- (16) Iwasawa, K., Fabian, A.C., Ettori, S., 2001, MNRAS, 321, L15, (I01)
- (17) Jansen, F., et al., 2001, A&A, 365, L1
- (18) Jimenez-Bailon, E., et al., 2005, A&A, 435, 449
- (19) Kallman, T. R., Palmieri, P., Bautista, A., Mendoza, C., Krolik, J. H., 2004, ApJ, 465, 994
- (20) Kaspi, S., et al., 2000, ApJ, 528, 445
- (21) Kleinmann, S. G., et al., 1988, ApJ, 328, 161
- (22) Lamer, G., Uttley, P., McHardy, I. M., 2003, MNRAS, 342, L41
- (23) Leahy, D. A., Creighton, J., 1993, MNRAS, 263, 314
- (24) Levenson, N. A., et al., 2002, ApJ, 573, L81
- (25) Markowitz, A., Edelson, R., Vaughan, S., 2003, ApJ, 598, 935
- (26) Matt, G., Guainazzi, M., Maiolino, R., 2003, MNRAS, 342, 422
- (27) Matt, G., Brandt, W. N.; Fabian, A. C., 1996, MNRAS, 280, 823
- (28) Molendi, S., Bianchi, S., Matt, G., 2003, MNRAS, 343, L1
- (29) Murphy, E. M., Lockman, F. J., Laor, A., Elvis, M., 1996, ApJS, 105,
- (30) Netzer, H., et al., 2005, ApJ, 629, 739
- (31) Piconcelli, E., Jimenez-Bailon, E., Guainazzi, M., et al., 2004, MNRAS, 351, 161
- (32) Piconcelli, E., Jimenez-Bailon, E., Guainazzi, M., et al., 2005, A&A, 432, 15
- (33) Reeves, J. N., et al., 2006, Astron.Nachr., 88, 789
- (34) Revnivtsev, M., Sazonov, S., Jahoda, K., Gilfanov, M., 2004, A&A, 418, 927
- (35) Risaliti, G., 2002, A&A, 386, 379
- (36) Risaliti, G., et al., 2007, ApJ, 659, L111
- (37) Spoon, H. W. W., et al., 2007, ApJ, 654, L49
- (38) Steffen, A. T., et al., 2006, AJ, 131, 2826
- (39) Tananbaum, H., et al., 1979, ApJ, 234, L9
- (40) Tran, H. D., Cohen, M.H., Villar-Martin, M., 2000, AJ, 120, 562
- (41) Willott, C. J., McLure, R. J., Jarvis, M. J., 2003, ApJ, 587, L15
- (42) Zhang, J. S., Henkel, C., Kadler, M., et al., 2006, A&A, 450, 933