Laser Guide Star Adaptive Optics Integral Field Spectroscopy
of a Tightly Collimated Bipolar Jet
from the Herbig Ae star LkH 23311affiliation: Some of the data
presented herein were obtained at the W.M. Keck Observatory, which is
operated as a scientific partnership among the California Institute of
Technology, the University of California and the National Aeronautics
and Space Administration. The Observatory was made possible by the
generous financial support of the W.M. Keck Foundation.
Abstract
We have used the integral field spectrograph OSIRIS and laser guide star adaptive optics at Keck Observatory to obtain high angular resolution (), moderate spectral resolution () images of the bipolar jet from the Herbig Ae star LkH 233, seen in near-IR [Fe II] emission at 1.600 & 1.644 µm. This jet is narrow and tightly collimated, with an opening angle of only 9 degrees, and has an average radial velocity of km s-1. The jet and counterjet are asymmetric, with the red-shifted jet much clumpier than its counterpart at the angular resolution of our observations. The observed properties are in general similar to jets seen around T Tauri stars, though it has a relatively large mass flux of year-1, near the high end of the observed mass flux range around T Tauri stars. We also spatially resolve an inclined circumstellar disk around LkH 233, which obscures the star from direct view. By comparison with numerical radiative transfer disk models, we estimate the disk midplane to be inclined relative to the plane of the sky. Since the star is seen only in scattered light at near-infrared wavelengths, we detect only a small fraction of its intrinsic flux. Because previous estimates of its stellar properties did not account for this, either LkHa 233 must be located closer than the previously believed, or its true luminosity must be greater than previously supposed, consistent with its being a star near the stellar birthline.
Subject headings:
ISM: jets and outflows — ISM: Herbig-Haro objects — stars: individual (LkHa 233) — stars:pre-main-sequence1. Introduction
Bipolar outflows from young stars feature prominently in many of the most spectacular images of our universe (see, e.g. Bally et al., 2007). But far from being merely aesthetically pleasing, these jets play crucial roles in star formation. Molecular cloud material must shed most of its angular momentum before it can accrete onto a newborn star, and jets have been identified as a key mechanism for this, removing angular momentum from disks and allowing accretion to continue (Ray et al., 2007, and references therein). Recent observations have for the first time provided indications of jet rotation (Bacciotti et al., 2002; Coffey et al., 2004; Woitas et al., 2005; Coffey et al., 2007), suggesting that outflows may indeed carry angular momentum away from their origin. Jets have also been implicated in regulating the overall efficiency of star formation by injecting turbulence into molecular clouds (Matzner & McKee, 2000).
The physical processes which drive these outflows remain poorly understood. Several competing theories have been proposed to explain how gas is accelerated and collimated. The leading contenders all invoke magnetic forces to shape the outflows, with the “X-wind” model (Shang et al., 2007) positing acceleration occurs near the star at the radius of magnetospherical truncation, while the “disk wind” model (Pudritz et al., 2007) posits acceleration from a wide range of radii across the circumstellar disk. Alternatively, outflows could originate in spherical coronae, which are then collimated by surrounding magnetic fields (Sauty et al., 1999). Outflows may even evolve through each of these processes in turn (Sauty et al., 2003). Distinguishing between these theories will require detailed studies of outflows as close to their origins as possible. At present, high angular resolution observations of outflows have mostly focused on older T Tauri stars approaching the main sequence (see Ray et al., 2007, and references therein). Observations of more sources at younger ages are needed, especially considering that outflows are intimately related to accretion, which is greatest at the youngest ages (Hartmann et al., 1998).
In addition to age, we also need to understand how outflows vary with stellar mass. Because jets are thought to be driven by magnetic fields, we might suppose that their properties should differ between fully convective T Tauri stars and more massive stars which lack a surface convection zone. Indeed, outflows from high mass YSOs are much less collimated than jets from T Tauri stars, with opening angles of (e.g. Hunter et al., 1997; Shepherd et al., 1998, 2001). The Herbig Ae/Be stars (Herbig, 1960; Waters & Waelkens, 1998) are intermediate between these two regimes, so studies of their outflows can potentially clarify this transition in jet properties, which in turn may shed light on the underlying physics through which jets are produced. Yet relatively few outflows from Herbig Ae/Be stars have been studied in detail, particularly at high resolution (Mundt & Ray, 1994). In a very few cases, studies of parsec-scale outflows from Herbig Ae stars have suggested that on large spatial scales their velocities and collimation are largely consistent with those observed in T Tauri jets (McGroarty et al., 2004).
But a lack of high angular resolution studies of Herbig Ae star outflows has thus far prevented detailed comparison with outflows from T Tauri stars. For T Tauri stars, we now have a sophisticated understanding of outflow properties on scales of a few tens of AU, derived from high angular resolution observations. Because stellar outflows are detectable primarily in emission lines from shock-excited ions, line ratios can provide measurements of many physical parameters within the outflow. When both spatially and spectrally resolved data are available, very detailed portraits of outflows have been obtained (e.g. Bacciotti et al., 1999; Beck et al., 2004; Hartigan & Morse, 2007). Since outflows have characteristic spatial scales of a few AU (corresponding to at typical distances) and velocities of tens to hundreds of km s-1, the necessary observations combine high angular resolution () with moderate spectral resolution (). Having both spatially and spectrally resolved data is key to disentangling the outflow structures as close to the disk as possible. In optical wavelengths, such as for the [S II] 6717, 6731 Å and [O I] 6300, 6364 Å emission lines, the necessary angular resolution is available only from space (e.g., Hartigan et al., 1999; Bacciotti et al., 2000; Woitas et al., 2002; Coffey et al., 2004; Hartigan & Morse, 2007) However, the arrival of integral field spectroscopy with adaptive optics on 8-10 m telescopes has now opened the door to high angular resolution studies of jets from the ground. At the near-infrared wavelengths suitable for adaptive optics, several emission lines of [Fe II] between m are ideal tracers of shocked outflows (Graham et al., 1987). Furthermore, these lines provide diagnostic potential enabling the determination of physical conditions within the jet (Pesenti et al., 2003; Hartigan et al., 2004), and ultimately the mass flux, a key parameter in any model of outflow physics.
In this paper, we seek to investigate whether the similarity on large spatial scales between outflows from T Tauri and Herbig Ae stars still holds true on finer spatial scales. Toward that end, we present the first high angular resolution integral field spectroscopy of an outflow from a Herbig Ae star, enabling us to investigate its collimation, kinematics, and certain physical parameters on angular scales of milliarcseconds. By comparison with the properties of jets seen from T Tauri stars, we hope to clarify the influence of stellar mass upon outflow physics. Also, from a technical perspective, we wish to demonstrate the utilty of laser guide star adaptive optics (LGS AO) for obtaining high angular resolution spectroscopy of an outflow from a fairly faint and obscured source. Because many young stars which drive jets are still deeply embedded in their dusty birthplaces, only a limited number are accessible to traditional natural guide star AO. The growing availability of LGS AO on large telescopes promises to enable high angular resolution studies of a greatly increased target sample, particularly at the youngest ages.
We present here observations made with Keck’s new integral field spectrograph OSIRIS, using laser guide star adaptive optics, which show in exquisite detail a tightly collimated jet from the Herbig Ae star LkH 233 (also V375 Lac, HBC 313). This star, part of the original Ae star sample identified by (Herbig, 1960), is one of the relatively few Herbig Ae/Be stars known to possess a jet. It is an A4 star, with (Hernández et al., 2004). Its distance has generally been considered to be 880 pc (Calvet & Cohen, 1978). We adopt this distance as well, but some authors have argued for a closer distance; see §3.4 below. Hernandez et al. also derived , , and age = 2.61 Myr, with = 3.7, , but those values are likely not accurate, because they were derived without accounting for the fact that LkH 233 is seen only in scattered light. Hence both the extinction to the star and its total luminosity must be higher; see §3.2.
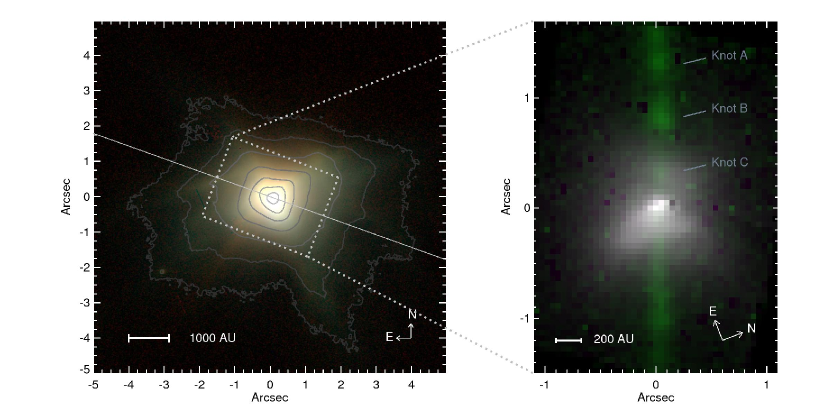
LkH 233 sits at the center of an X-shaped bipolar nebula visible from optical to near-infrared wavelengths (Aspin et al., 1985; Li et al., 1994). Near infrared polarimetry shows a dark lane passing in front of the star, indicating the presence of a roughly edge-on circumstellar disk (Perrin et al., 2004). Corcoran & Ray (1998a) discovered that LkH 233 possesses an extended bipolar jet and counterjet visible in the optical [S II] 6716, 6731 Å lines. The blueshifted jet extends toward position angle (PA) 250°, perpendicular to the inferred circumstellar disk and along the symmetry axis of the surrounding nebula. The redshifted counterjet, at 70°, was not detected within 06 of the star, which Corcoran et al. interpreted as occultation by the circumstellar disk. A followup study by McGroarty et al. (2004) found that a chain of Herbig Haro objects extends almost 2 pc to either side of LkH 233, located approximately along the jet axis but with considerable scatter.
In the following section, §2, we present our observations and outline the data reduction process. We then describe in §3 the observed properties of both the jet and the circumstellar disk, derive estimates for the mass flux in the jet, and re-examine the question of the distance to LkH 233. In §4 we discuss the implications of these results, with special attention to comparison with the observed properties of jet around other Herbig Ae and T Tauri stars. Conclusions and prospects for future work are given in §5.
2. Observations
We observed LkH 233 on 2005 Oct 13 UTC using the integral field spectrograph OSIRIS and laser guide star adaptive optics system (Wizinowich et al., 2006; van Dam et al., 2006) on the W. M. Keck II telescope. The performance of the LkH 233 itself served as the tip-tilt reference for the adaptive optics system. The skies were clear and seeing was average, at , with winds from 15-20 km hr-1.
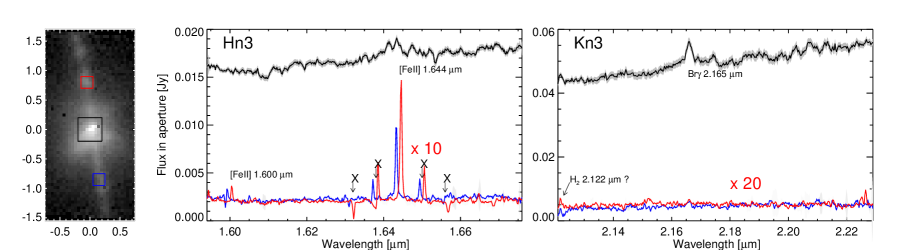
OSIRIS is a lenslet-based integral field spectrograph which provides a spectral resolution of 3800 from 1-2.5 microns (Larkin et al., 2003). We selected its 50 mas pixel-1 spectrographic plate scale for our observations. While this scale does not Nyquist-sample the diffraction-limited PSF, it provides a larger field of view and better signal to noise per integration time for extended emission than the finer plate scales. We observed LkH 233 using the narrow-band Hn3 and Kn3 filters, covering the wavelength ranges 1.594-1.676 and 2.121-2.229 , respectively. Total integration time on-source was 1800 s for Hn3 and 900 s for Kn3. Between exposures on LkH 233, we obtained equally deep sky observations at a position 20” away.
We reduced the data using an early version of the OSIRIS data reduction pipeline (Krabbe et al., 2004). The data were sky-subtracted, corrected for offsets between the 32 detector readout channels, spatially rectified to extract the individual spectra into a data cube, and corrected for cosmic rays and other blemishes. The A stars BD +9 5007 and HD 7789 served as telluric standards and Point Response Function111We follow the Spitzer convention of distinguishing between the intrinsic optical Point Spread Function (PSF) and the Point Response Function (PRF), which is the PSF convolved with the detector’s pixel response. See http://ssc.spitzer.caltech.edu/postbcd/doc/PRF_vs_PSF.pdf. Because our OSIRIS data used the 50 mas pixel scale, coarser than Nyquist for the Keck AO PSF at 1.6 µm, the PRF is dominated by the pixel response. By taking the quadrature difference of the observed 61 mas PRF FWHM and 50 mas pixel scale, we estimate that the intrinsic optical PSF had mas FWHM, approximately the diffraction limit. Because of the difficulties inherent in trying to accurately measure Strehl ratios on undersampled data (Roberts et al., 2004), we do not attempt to directly measure the Strehl ratio achieved in these observations. (PRF) references. For BD +9 5007, observed immediately before LkH 233, we measure a PRF FWHM of mas. We also used these stars to establish photometric zero points: we converted their 2MASS and magnitudes into magnitudes in the OSIRIS Hn3 and Kn3 filters via synthetic photometry, and then derived from those magnitudes a zero point for flux-calibrating our LkH 233 data.
These observations were made during the instrument’s commissioning period, and show a variety of instrumental artifacts, most notably ghost images at certain wavelengths caused by crosstalk between lenslets due to a grating misalignment. These ghost images do not occur in the wavelength ranges of interest to us, and so we simply ignore them. The grating has been realigned subsequent to these observations and more recent data do not suffer from these ghosts.
OSIRIS also includes an imaging camera whose field of view is offset by 194 from the spectrograph field. Our sky observations were obtained such that LkH 233 fell on the imager field of view (FOV) while we were obtaining spectrograph skies, and vice versa. In this manner we obtained and band observations of LkH 233, with total exposure times of 300, 360, 360, and 315 s, respectively. These observations were reduced via the usual steps of flat fielding, sky subtraction, image registration, and summation.
During this observing run, we also observed the Herbig Ae/Be stars LkH 198, V376 Cas, and Parsamian 21, with identical instrument configuration and exposure times. No outflows were visible around the first two sources. Parsamian 21 has a faint outflow extending to the north, which we postpone discussing for a subsequent paper.
3. Results
3.1. The Jet
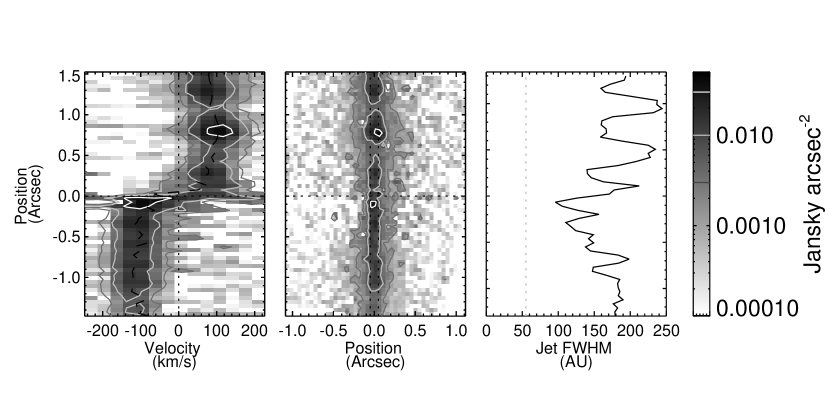
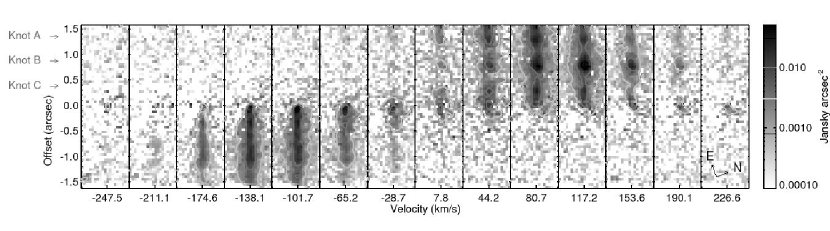
A well-collimated bipolar emission-line jet extends several arcseconds on either side of LkH 233 (Figure 1), with the blueshifted jet at a position angle of 249°, and the redshifted jet at 69°. We also see a roughly edge-on circumstellar disk and bipolar nebula extending perpendicular to the jet. The jet has excavated a cavity in this envelope, the limb-brightened edges of which form the well-known “X” centered on LkH 233. We detect the jet in the [Fe II] 1.600 and 1.644 lines, and possibly H2 2.122 µm (Figure 2). Faint hydrogen Br 2.16 emission is also detected along the course of the jet, but does not show velocity shifts and is spread over a wider spatial extent than the [FeII] emission; this appears to just be Br emission from the star, scattered by dust in the circumstellar envelope. Of the lines observed here, the 1.644 line is the brightest, and we choose to concentrate our analysis on it. In Figure 3 we show continuum-subtracted images in a range of velocity channels centered on 1.644 , and we show in Figure 4 a position-velocity diagram, an summed continuum-subtracted jet image, and a plot of the FWHM.
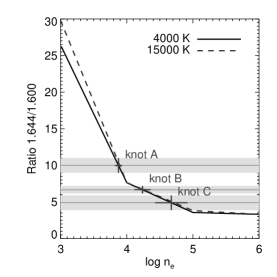
The jet is narrow, tightly collimated, and knotty. Its FWHM increases slowly from 100 AU near its base to AU at the edge of our FOV, 1300 AU from the star, giving an opening angle of 9°(Figure 4). Three bright knots are apparent in the redshifted jet, at approximate distances of 0.3, 0.8, and 1.3″ from the star, corresponding to 260, 700, and 1150 AU in the plane of the sky. We will refer to these as knots C, B, and A, respectively. The blueshifted jet is noticeably less clumpy, but brightens considerably near its base, reaching its peak intensity at 01 (88 AU) from the star. There is an anticorrelation between jet width and intensity (Figure 4, right), with the bright knots having lower FWHM than the fainter inter-knot emission. This behavior has also been observed for the outflows from RW Aur (Woitas et al. 2002) and HH 23 (Ray et al. 1996).
We were unable to find any reported measurements of LkH 233’s radial velocity in the literature222We note that Corcoran and Ray (1997,1998) state they measured the systemic velocity using optical Na D lines, but do not anywhere report the actual measured velocity, nor are there stellar lines suitable for measuring it in our data (since is in emission). Hence we compute velocities relative to the solar system barycenter, without correcting for the radial motion of the star. In this reference frame, the red- and blueshifted jets have average velocities of and km s-1, respectively. If the red and blue jets have the same speed relative to the star but opposite directions, then the stellar barycentric radial velocity appears to be km s-1.
A significant difference between the two directions is that the blueshifted jet has a relatively constant velocity along its length, while the redshifted jet shows variation in its velocity. Knot B, at , has a higher velocity than the other two clumps by about 30 km s-1 (Figure 4, left). This velocity variation so close to the jet’s origin indicates that the amount of acceleration imparted to the jet must fluctuate with time, and must do so in a way that is not symmetric between the jet and counterjet.
If we assume the jet is perpendicular to the disk, which has an estimated inclination of (see §3.2 below), then the radial velocities we observe are only percent of the total jet velocity. The implied total jet velocity, 200-300 km s-1, is consistent with outflows seen around other Herbig Ae stars (Mundt & Ray, 1994). Based on this, we estimate the proper motion of the jet should be per year. Hence the bright knots in the jet were launched from the star within the last 10 to 20 years, and their motion should be apparent over short timescales.
We do not see much evidence for the low velocity component (LVC) reported by Corcoran & Ray (1998a) at about -25 km/s. This may be due to the fact that the [Fe II] 1.644 line traces higher densities than the [S II] 6716, 6731 Å lines, so in the NIR we are only sensitive to dense gas in the core of the jet.
The emission lines of [Fe II] can be used to measure several important physical quantities, such as temperature, electron density, and extinction (Hartigan et al., 2004). Most such measurements require the comparison of flux ratios between different lines of [Fe II] , or between [Fe II] and other species in the optical. The limited wavelength coverage of our data restricts their diagnostic capabilities, as only the 1.644 and 1.600 m lines are present in our wavelength range. The flux ratio of those two lines does provide a measure of the electron density in the shocked gas (Nisini et al., 2002). We find that the electron density in LkH 233’s jet is cm-3 and decreases at larger distances from the star; see Figure 5. This decrease at larger distances has also been seen in many jets from T Tauri stars (Nisini et al., 2002; Podio et al., 2006; Beck et al., 2007; Hartigan & Morse, 2007) and is believed to show the slow recombination of hydrogen after the initial shock ionization (Bacciotti & Eislöffel, 1999). However, as [Fe II] emission traces denser regions of the gas, our measured electron densities are not necessarily indicative of LkH 233’s outflow as a whole. Future observations which also include the optical [S II] doublet are needed to provide complementary measures for gas at lower densities and/or different distances from the shock fronts.
3.2. The Disk
In addition to showing the jet, these observations also clearly reveal the circumstellar disk around LkH 233, in the form of a bright nebula crossed by a dark lane, the characteristic signature of a roughly edge-on circumstellar disk (Figure 1, right). The presence of this disk was originally suspected based on optical polarimetry (Aspin et al., 1985). Corcoran & Ray (1998a) were unable to trace the redshifted optical [S II] emission any closer than 06 to the star, and inferred the presence of a disk with this radius that occulted the jet. We confirm here that interpretation: the circumstellar disk extends from below to above the locus of peak intensity. In contrast to the [S II] line, in [Fe II] 1.644 light the jet can be traced all the way in to the star on both sides (Figure 3). There is at most a two-pixel-wide () region at the base of the red jet where the emission is somewhat fainter, possibly due to obscuration. This indicates that the circumstellar dust is not optically thick at these wavelengths, in contrast to the optical. The observed disk morphology is consistent with that seen in visible light in HST WFPC2 observations (Stapelfeldt et al., in prep).
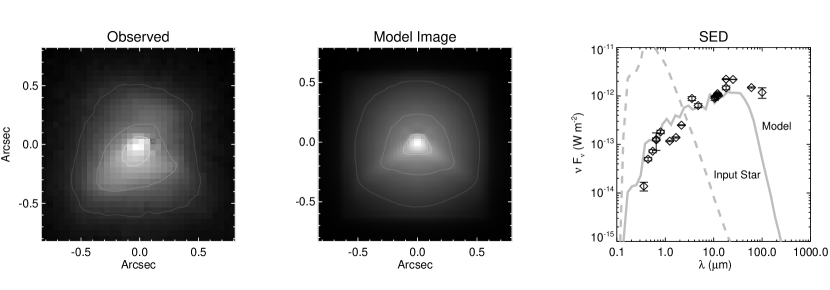
The continuum intensity peak is well-resolved in these data, with a FWHM of 0135 versus 006 for a PRF reference star. Therefore we do not observe the star directly, but instead see it in disk-scattered light. The peak intensity is located at the apex of the southwest face of the disk, which is the brighter of the two faces. This is consistent with the southwest side of the system being inclined toward us, as indicated by the blueshifted jet. By comparison with a series of circumstellar disk models computed using the MCFOST Monte Carlo radiative transfer code of Pinte et al. (2006), we determined that LkH 233’s disk is inclined approximately degrees333We measure inclinations of the disk midplane relative to the plane of the sky, such that pole-on disks have and edge-on disks have . A numerical model of a circumstellar disk at this inclination extending from 0.6 to 500 AU reproduces fairly well both the observed appearance and SED of LkH 233 (Figure 6). We caution that some parameters, such as the inner disk radius, are not well constrained by these data. Hence this is only one possible disk model which fits the current data, not necessarily a unique best-fit solution.
Previous estimates of the stellar properties of LkH 233 itself were obtained assuming only regular interstellar extinction, typically around , with reddening between 3 and 5 (Hernández et al., 2004; Manoj et al., 2006). However, our results here confirm that LkH 233 is seen entirely in scattered light at optical and near-IR wavelengths. The true is much higher than previously estimated, so the observed SED contains only a small fraction of the total luminosity. LkH 233 must therefore be substantially more luminous than previously thought. With the stellar temperature fixed at (appropriate for an A5 star), we were able to simultaneously match both the observed disk morphology and SED by using a stellar radius of . This implies a total stellar luminosity —about an order of magnitude higher than the 20-80 previously found by Hernández et al. (2004). These revised stellar properties place LkH 233 near the stellar birthline for intermediate mass stars (Palla & Stahler, 1990; Palla, 2005), and therefore LkH 233 may in fact be an very young star with mass .
The key parameters of our model are as follows: = 8600 K, = 9 , AU, and grain sizes from with power law index -3.5. However, we emphasize that the model presented here is not a rigorous best fit to the data, merely one plausible fit, and there remain large uncertainties in both disk and stellar properties. In particular, the MCFOST Monte Carlo code used does not yet account for any puffed up inner rim to the disk (Dullemond & Dominik, 2004) nor does it include the extended bipolar envelope also present around LkH 233 in addition to the disk (Perrin et al., 2004). The lack of the bipolar envelope component results in the present model having an unrealistically large scale height (30 AU at 100 AU) in order to fit the data well. More detailed modeling, quantitatively fit to observations across a wide range of wavelengths, would help clarify the situation, but is beyond the scope of this paper.
3.3. Mass Flux
The observed intensity in the [Fe II] lines allows us to estimate the mass flux. Currently the physical parameters of the jet, such as the temperature, ionization, and Fe depletion onto grains, are not well known so our estimate will require making several assumptions; future observations will enable a more refined calculation. Podio et al. (2006) presented two separate methods for estimating mass flux based on [Fe II] emission, based on either (A) the jet’s apparent size and density, or (B) the observed emission line luminosity.
The first method relies on computing the mass outflow rate across a given plane perpendicular to the jet, based on the observed jet cross section, velocity, and density:
where is the mean molecular weight, taken to be 1.24, is the mass of hydrogen, is the number density of hydrogen, and is the jet velocity. In the case of LkH 233, we do not know , but we do know that , from which we can estimate . Typical ionization fractions for HH objects are , as determined from both shock models and observational diagnostics (Hartigan et al., 1994; Bacciotti & Eislöffel, 1999; Lavalley-Fouquet et al., 2000), so if we assume , then . Using a rough estimate of AU, we compute year-1. This method relies on the assumption that the jet can be treated as a uniformly filled cylinder with density measured by our diagnostic, and thus may be better considered an upper limit on the true .
The second method relies on the observed luminosity being proportional to the total number of emitting atoms. Unlike the first method, this second approach does take into account spatial variations in the jet density, but is subject to uncertainties in the absolute flux calibration. In this method we compute using
where is the volume filled by the emitting gas, is the tangential velocity of the jet, is the tangential length of the jet volume element, and are the ionization fraction and atomic abundance relative to hydrogen, is the Einstein A radiative rate coefficient, and and are as usual the Planck constant and frequency of the radiation. Based on our estimated disk inclination and observed km s-1, we compute km s-1, and we take to be the tangential length of each OSIRIS pixel, AU at 880 pc. Several assumptions are needed in order to transform the observed line luminosity into the density-volume product : without accurate knowledge of the temperature we have to estimate the ionization fraction and upper state fraction for iron. We base our estimates on conditions observed in typical HH objects, for instance by Podio et al. (2006) and Hartigan & Morse (2007), who measured temperatures of K based on optical line ratios. Taking those temperatures plus our measured , we used a 16-level model of the Fe+ ion (Pesenti et al., 2003, similar to that described by) to estimate the fraction of ions in the upper energy level is . We further assumed that Fe is entirely ionized (), and that iron has a solar abundance but is 90% depleted onto solid grains (based on the 87% depletion reported for the HH 23 jet by Podio et al. 2006).
Our spatially resolved IFU data enable us to measure the mass flux rate as it varies along the jet. We first collapse the 2d continuum-subtracted [Fe II] image perpendicular to the jet to get a total for each row, and then apply the above algorithm to compute . The computed mass flux has a median value of year-1, and is fairly constant along most of the jet, varying between year-1. The one exception is the middle knot in the redshifted jet, knot B, where the flux rises to year-1. We caution that these values are approximate at best, given the lack of knowledge of the temperature and ionization structure, and furthermore represent lower limits, because all of the outflow is not necessarily shocked and luminous, and because we have not corrected for extinction.
The two methods give results which differ by an order of magnitude, with the estimate based on method A higher than that of method B. This discrepancy is not entirely unexpected, since the filling factor for [Fe II] emission is less than unity. Podio et al. (2006) found masses computed with method A were often 3-10 times higher than those computed based on emission line fluxes, and they considered the latter method to provide a better estimate of the mass flux transported by the atomic component of the outflow.
The values for for LkH 233 are comparable to the high end of the range of mass fluxes seen around T Tauri stars. For instance, if we adopt the lower of the two estimates as the more reliable, the flux in LkH 233’s jet is roughly comparable to the mass flux computed for RW Aur by Woitas et al. (2002), year-1, though about an order of magnitude higher than the values measured for HH 34 and HH 111 by Podio et al. (2006).
Outflow rates from young stars are proportional to the accretion rates onto those stars (Cabrit et al., 1990; Hartigan et al., 1995; Edwards et al., 2006), across a mass range spanning from brown dwarfs (Mohanty et al., 2005) to Herbig Ae/Be stars (Corcoran & Ray, 1998b). Outflow mass fluxes are typically a few percent of the accreting mass flux (Hartigan et al., 1995) As far as we know, there are currently no measurements of the accretion rate onto LkH 233, but based on our estimated outflow mass flux, the accretion rate of onto it should be year-1.
3.4. The Distance to LkH 233, Revisited
As discussed above, the fact that LkH 233 is seen entirely in scattered light implies that it must be substantially more luminous than has previously been thought, assuming it is indeed at a distance of 880 pc. It is worth considering whether it might instead be closer.
Establishing accurate distances to Herbig Ae stars is often problematic (e.g. Stine & O’Neal, 1998; Merín et al., 2004; Perrin et al., 2006). The 880 pc distance to LkH 233 was originally derived by Calvet & Cohen (1978), and the majority of subsequent authors have adopted their estimate. Calvet & Cohen derived that value from the distance modulus to the nearby star HD 213976, a bright B1 star located 65 away on the edge of the dark cloud in which LkH 233 is embedded. They also estimated photometric distances to two other members of this small cluster, the K stars LkH 231 and 232, finding pc subject to the assumption that those stars are both overluminous by 2 mags. in due to their youth.
Is it possible that HD 213976 is in fact not at the same distance as LkH 233? Aspin (1985) noted that HD 213976’s optical colors imply its is only 0.42, significantly less than the typical per kpc. This implies both that we look toward it along a galactic sightline with lower than average extinction, and that HD 213976 must be located on the near side of the dark cloud. Hence LkH 233 should be at least as far away as HD 213976, if not farther.
Some authors (e.g. Bowey et al., 2003) have instead described LkH 233 as being a member of condensation A of the Lac OB1 molecular cloud, which is only pc distant (Hernández et al., 2005). While LkH 233’s position on the sky does place it on the apparent edge of Lac OB1, we consider it unlikely to actually be a member of that association, for several reasons. First, LkH 233’s proper motion is very different from that of Lac OB1: mas/yr (Ducourant et al., 2005) versus for Lac OB1; (de Zeeuw et al., 1999). Even more problematic is the fact that Lac OB1 is believed to be 16 Myr old (de Zeeuw et al., 1999). Because protoplanetary disks dissipate on time scales of 3-10 Myr, the presence of a massive disk around LkH 233 is inconsistent with its being that old. For these reasons we prefer to retain the traditional 880 pc distance for LkH 233.
Because the system’s inclination can be constrained based on the disk’s appearance, the proper motion of the clumps in the jet can potentially provide a direct measure of the distance. For a disk inclination and , the jet proper motion should be year-1, while would imply a proper motion of year-1. However, this will be a challenging measurement given uncertainty in the inclination, the possibility of jet precession, variations in the internal working surfaces traced by the clumps, etc.
4. Discussion
The outflow from LkH 233 is in general quite similar to those seen around T Tauri stars. The velocity structure and collimation of the jet, the morphology of the knots, and the presence of asymmetries between the jet and counterjet all resemble the properties of outflows seen around lower-mass stars.
For instance, we see that for both the red and blue directions, the higher velocity channels are more tightly collimated than the lower velocity channels. Such increased collimation at higher velocities has also been seen in the outflow from DG Tau (Bacciotti et al., 2002). This is in agreement with predictions of MHD models that inner streamlines should dominate the emission (e.g. Dougados et al., 2004).
It is striking how similar LkH 233 appears to the T Tauri star HH 30, with its well-known edge-on disk and perpendicular outflow (Burrows et al., 1996). LkH 233’s disk is asymmetric in brightness between the left and right sides, as is HH 30’s disk (Watson & Stapelfeldt, 2004). The outflows from both stars are knotty, and even the characteristic periods for knot production are similar, 2.5 years for HH 30 and years for LkH 233. These knots appear to be due to internal shocks within the jet, rather than the jet shocking into the ambient medium. The properties of the knots in LkH 233’s jet are indeed consistent with internal working surfaces caused by variations in jet outflow velocity. In particular, the brightest knot is also that with the highest velocity, just what would be expected for more rapid material plowing into a slower portion of the jet.
It is curious that, at our angular resolution and S/N, only the redshifted jet appears knotty. Similar asymmetries have been seen in outflows from about half of T Tauri stars (Hirth et al., 1994). On the other hand, at least some jets are very symmetric, such as HH 212 in Orion (Zinnecker et al., 1998), which displays a very regular series of knots in nearly perfect pairs on opposite sides of the star. The symmetry of the HH 212 knots and the regularity of knot spacing in many systems (including LkH 233) suggest that the production of knots is an inherent part of the jet launch process, possibly due to disk instabilities or recurrent stellar activity cycles. However, the commonness of asymmetric systems indicates that any inherent regularity in the process can easily be disrupted or masked, by collisions with surrounding ambient material, pressure gradients, or asymmetries in magnetic fields very near the star (Wassell et al., 2006). But then what causes those asymmetries in magnetic field or pressure? The origin of these various symmetries and asymmetries remains mysterious, and poses a key challenge to theories of jet acceleration and collimation.
A particularly useful comparison object is HD 163296, which has perhaps the best-studied outflow from any Herbig Ae star (Devine et al., 2000; Wassell et al., 2006). HD 163296, an A2Ve star at pc (van den Ancker et al., 1998), launches a bipolar collimated jet, HH 409, which also is broken into an asymmetric series of knots. The HH 409 jet displays knots on both the jet and counterjet, but on the two sides the knots differ in both and distance from the star. Based on their high spatial resolution observations of HD 163296, Wassell et al. concluded that the asymmetries must originate near or within the jet launch region itself, rather than being the result of interactions with the ambient medium. Other authors have reached the same conclusion regarding the asymmetries observed in outflows from T Tauri stars (Woitas et al., 2002; Pyo et al., 2006). Similarly for LkH 233 , given that strong asymmetries are present in the outflow within the innermost few hundred AU, it seems unlikely that those asymmetries could be due to the ambient medium. While there is indeed substantial dust and gas near the star (in the observed disk and nebula), we know the outflow from LkH 233 has been ongoing for thousands of years based on the length of the observed outflow (at least 1.3 pc; McGroarty et al. 2004). Therefore any primordial material along the jet axis was long ago swept away, out of the inner few arcseconds where we observe the asymmetries and knots. Explaining the difference in appearance between the red- and blue-shifted jets thus requires the presence of an asymmetric geometry within the inner jet launch region. This asymmetry may take the form of pressure gradients, different magnetic field strengths or differing field geometries between the two directions.
The mass flux in the jet of LkH 233 is about two orders of magnitude greater than that of HD 163296. The measured electron density for LkH 233 is also about a factor of ten higher than that reported for HD 163296, but the value for HD 163296 was measured using ratios of optical [S II] transitions which trace lower density parts of the post-shock gas (Wassell et al., 2006). Hence it is hard to say how meaningful this difference in is, and the true difference in accretion rate may be somewhat less than this estimate.
Outflow mass fluxes are believed to be proportional to accretion rate, and accretion rates are generally larger for younger stars (Hartmann et al., 1998). Therefore, together with its higher extinction, greater infrared excess, and larger amount of nebulosity, the high mass flux of LkH 233 suggests that it is at a younger evolutionary state than HD 163296. This is consistent with our revised stellar parameters which place LkH 233 near the stellar birthline for intermediate mass stars. The outflow velocity is expected to be of order the escape velocity, . For our revised stellar properties (4 , 9 ), the escape velocity is km s-1, which compares favorably with the estimated total jet velocity.
There is a growing body of evidence that outflows from high mass stars are generally less collimated than those of low mass stars. Given the tightly collimated nature of LkH 233’s outflow, the transition to poorly collimated jets appears to occur at a higher mass. However, the opening angle of the bipolar cavity in the envelope around LkH 233 (Perrin et al., 2004) is 30°, much wider than the jet collimation angle. This, plus the scatter in HH objects seen by McGroarty et al. (2004), argues either for a change in outflow direction with time (such as from precession), for a much lower degree of collimation during earlier stages of the outflow, or for the presence of a wide-angle wind around the inner jet, unseen in the [Fe II] emission which traces relatively dense gas.
5. Conclusions
We have used Keck Observatory’s laser guide star adaptive optics system and integral field spectrograph OSIRIS to observe the bipolar outflow of the Herbig Ae star LkH 233. Based on these observations, we believe that:
-
1.
LkH 233 has a narrow, collimated bipolar outflow, with the blueshifted jet at a position angle of 249° and the redshifted counterjet at 69°.
-
2.
At the present angular resolution and sensitivity, the blueshifted and redshifted jets have similar opening angles but very different appearances, with the red-shifted jet broken up into several knots while the blue-shifted jet is smooth. The knots in the red-shifted jet are consistent with shocked inner working surfaces within the jet.
-
3.
Based on [Fe II] emission intensity, we estimate the mass flux in this jet to be year-1. This is toward the top end of mass fluxes observed around other T Tauri and Herbig Ae stars, and suggests that LkH 233 is a very young source with strong ongoing accretion.
-
4.
The observed properties of LkH 233’s outflow – its kinematics, collimation, asymmetric and knotty appearance, electron density, and estimated mass flux – are all largely consistent with the observed properties of jets from T Tauri stars. The transition to the less-collimated outflows observed around massive YSOs must therefore occur at some still higher mass threshhold.
-
5.
The jet extends perpendicular to a flattened circumstellar disk, the innermost region of the X-shaped nebula around LkH 233.
-
6.
LkH 233 is seen only in scattered light from this disk; the star itself remains obscured at near-infrared wavelengths. Because of this, previous estimates of the extinction to the star are low, causing the total stellar luminosity to be underestimated in prior studies.
-
7.
Revised stellar parameters, based on fitting disk models to the SED, indicate that LkH 233 may be a 4 star near the stellar birthline, but there remain large uncertainties in its true stellar properties.
The main result of this study is confirmation that the outflow from LkH 233 is quite similar to typical outflows from T Tauri stars, as has been suggested based on prior observations at lower spatial resolution (Corcoran & Ray, 1998a; McGroarty et al., 2004). This supports the hypothesis that the same physical mechanism is responsible for creating stellar outflows, across the entire mass range from T Tauri to Herbig Ae stars. It is worth noting that circumstellar disks around Herbig Ae stars are also similar in broad outline to those around T Tauri stars (e.g. Grady et al., 2005; Perrin et al., 2006; Millan-Gabet et al., 2007) In contrast, there are suggestions that circumstellar disks around the Herbig Be and more massive YSOs differ from those around lower masses. In particular, there is evidence for a transition from magnetic accretion (for T Tauri and Herbig Ae stars) to direct disk accretion onto the star (for Be stars and beyond) (Vink et al., 2002; Mottram et al., 2007). Neither this transition in accretion mechanisms nor the transition from collimated to wide-angle outflows are particularly well understood. But the fact that both transitions occur at approximately the same stellar mass may be an important clue that these processes are connected. This may indicate either that the properties of outflows depend primarily on the properties of the circumstellar disks and how they accrete onto the star, or that both outflow and disk properties depend in turn on some third parameter (stellar magnetic fields?) which undergoes a transition at the Ae/Be boundary.
Further insight into these matters will depend on obtaining increasingly detailed spatially resolved spectra of outflows, such as those provided by integral field spectroscopy. We have shown here the measured electron density using the 1.644/1.600 m ratio, and have also presented a rough estimate of the mass flux using the 1.644 m line. But much more could be done with a more complete spectrum: Ratios of other lines (most notably 1.644/1.533) provide alternate measures of electron density, and comparison with optical [Fe II] lines can measure the temperature as well (Nisini et al., 2005; Podio et al., 2006). The 1.644, 1.320, and 1.257 lines all originate in the same upper state, and thus their ratios directly constrain the extinction . This is a particularly exciting prospect for the redshifted jet in LkH 233: it is located partially behind the inclined circumstellar disk (occulting it in the visible but not in the near infrared), and thus it can be used to measure the extinction through the disk. Future observations that include the complete optical and near-IR spectrum of [Fe II] and other shock tracers should enable a complete suite of diagnostics for temperature, density, ionization, refractory element depletion, and more. Detailed modeling of LkH 233 thus holds great promise for understanding outflow mechanisms around intermediate-mass stars.
References
- Aspin et al. (1985) Aspin, C., McCaughrean, M. J., & McLean, I. S. Astron. Astrophys., 144, 1985, 220
- Bacciotti & Eislöffel (1999) Bacciotti, F. & Eislöffel, J. A&A, 342, 1999, 717
- Bacciotti et al. (1999) Bacciotti, F., Eislöffel, J., & Ray, T. P. A&A, 350, 1999, 917
- Bacciotti et al. (2000) Bacciotti, F., Mundt, R., Ray, T. P., et al. ApJ, 537, 2000, L49
- Bacciotti et al. (2002) Bacciotti, F., Ray, T. P., Mundt, R., et al. ApJ, 576, 2002, 222
- Bally et al. (2007) Bally, J., Reipurth, B., & Davis, C. J. In B. Reipurth, D. Jewitt, & K. Keil, eds., “Protostars and Planets V,” 2007, 215–230
- Beck et al. (2004) Beck, T. L., Riera, A., Raga, A. C., & Aspin, C. AJ, 127, 2004, 408
- Beck et al. (2007) Beck, T. L., Riera, A., Raga, A. C., & Reipurth, B. AJ, 133, 2007, 1221
- Bowey et al. (2003) Bowey, J. E., Adamson, A. J., & Yates, J. A. MNRAS, 340, 2003, 1173
- Burrows et al. (1996) Burrows, C. J., Stapelfeldt, K. R., Watson, A. M., et al. ApJ, 473, 1996, 437
- Cabrit et al. (1990) Cabrit, S., Edwards, S., Strom, S. E., & Strom, K. M. ApJ, 354, 1990, 687
- Calvet & Cohen (1978) Calvet, N. & Cohen, M. MNRAS, 182, 1978, 687
- Coffey et al. (2007) Coffey, D., Bacciotti, F., Ray, T. P., et al. ArXiv Astrophysics e-print astro-ph/0703271, 2007
- Coffey et al. (2004) Coffey, D., Bacciotti, F., Woitas, J., et al. ApJ, 604, 2004, 758
- Corcoran & Ray (1998a) Corcoran, M. & Ray, T. P. Astron. Astrophys., 336, 1998a, 535
- Corcoran & Ray (1998b) Corcoran, M. & Ray, T. P. A&A, 331, 1998b, 147
- de Zeeuw et al. (1999) de Zeeuw, P. T., Hoogerwerf, R., de Bruijne, J. H. J., et al. AJ, 117, 1999, 354
- Devine et al. (2000) Devine, D., Grady, C. A., Kimble, R. A., et al. ApJ, 542, 2000, L115
- Dougados et al. (2004) Dougados, C., Cabrit, S., Ferreira, J., et al. Ap&SS, 292, 2004, 643
- Ducourant et al. (2005) Ducourant, C., Teixeira, R., Périé, J. P., et al. A&A, 438, 2005, 769
- Dullemond & Dominik (2004) Dullemond, C. P. & Dominik, C. A&A, 417, 2004, 159
- Edwards et al. (2006) Edwards, S., Fischer, W., Hillenbrand, L., & Kwan, J. ApJ, 646, 2006, 319
- Grady et al. (2005) Grady, C. A., Woodgate, B. E., Bowers, C. W., et al. ApJ, 630, 2005, 958
- Graham et al. (1987) Graham, J. R., Wright, G. S., & Longmore, A. J. ApJ, 313, 1987, 847
- Hartigan et al. (1995) Hartigan, P., Edwards, S., & Ghandour, L. ApJ, 452, 1995, 736
- Hartigan & Morse (2007) Hartigan, P. & Morse, J. ApJ, 660, 2007, 426
- Hartigan et al. (1994) Hartigan, P., Morse, J. A., & Raymond, J. ApJ, 436, 1994, 125
- Hartigan et al. (1999) Hartigan, P., Morse, J. A., Tumlinson, J., et al. ApJ, 512, 1999, 901
- Hartigan et al. (2004) Hartigan, P., Raymond, J., & Pierson, R. ApJ, 614, 2004, L69
- Hartmann et al. (1998) Hartmann, L., Calvet, N., Gullbring, E., & D’Alessio, P. ApJ, 495, 1998, 385
- Herbig (1960) Herbig, G. H. Astrophys. J. Suppl. Ser., 4, 1960, 337
- Hernández et al. (2004) Hernández, J., Calvet, N., Briceño, C., et al. AJ, 127, 2004, 1682
- Hernández et al. (2005) Hernández, J., Calvet, N., Hartmann, L., et al. AJ, 129, 2005, 856
- Hirth et al. (1994) Hirth, G. A., Mundt, R., Solf, J., & Ray, T. P. ApJ, 427, 1994, L99
- Hunter et al. (1997) Hunter, T. R., Phillips, T. G., & Menten, K. M. ApJ, 478, 1997, 283
- Krabbe et al. (2004) Krabbe, A., Gasaway, T., Song, I., et al. In A. F. M. Moorwood & M. Iye, eds., “Ground-based Instrumentation for Astronomy. Edited by Alan F. M. Moorwood and Iye Masanori. Proceedings of the SPIE, Volume 5492, pp. 1403-1410 (2004).”, 2004, 1403–1410
- Larkin et al. (2003) Larkin, J. E., Quirrenbach, A., Krabbe, A., et al. In M. Iye & A. F. M. Moorwood, eds., “Instrument Design and Performance for Optical/Infrared Ground-based Telescopes. Edited by Iye, Masanori; Moorwood, Alan F. M. Proceedings of the SPIE, Volume 4841, pp. 1600-1610 (2003).”, 2003, 1600–1610
- Lavalley-Fouquet et al. (2000) Lavalley-Fouquet, C., Cabrit, S., & Dougados, C. A&A, 356, 2000, L41
- Li et al. (1994) Li, W., Evans, N. J., Harvey, P. M., & Colome, C. Astrophys. J., 433, 1994, 199
- Manoj et al. (2006) Manoj, P., Bhatt, H. C., Maheswar, G., & Muneer, S. ArXiv Astrophysics e-prints, 2006
- Matzner & McKee (2000) Matzner, C. D. & McKee, C. F. ApJ, 545, 2000, 364
- McGroarty et al. (2004) McGroarty, F., Ray, T. P., & Bally, J. A&A, 415, 2004, 189
- Merín et al. (2004) Merín, B., Montesinos, B., Eiroa, C., et al. A&A, 419, 2004, 301
- Millan-Gabet et al. (2007) Millan-Gabet, R., Malbet, F., Akeson, R., et al. In B. Reipurth, D. Jewitt, & K. Keil, eds., “Protostars and Planets V,” 2007, 539–554
- Mohanty et al. (2005) Mohanty, S., Jayawardhana, R., & Basri, G. ApJ, 626, 2005, 498
- Mottram et al. (2007) Mottram, J. C., Vink, J. S., Oudmaijer, R. D., & Patel, M. MNRAS, 377, 2007, 1363
- Mundt & Ray (1994) Mundt, R. & Ray, T. P. In P. S. The, M. R. Perez, & E. P. J. van den Heuvel, eds., “ASP Conf. Ser. 62: The Nature and Evolutionary Status of Herbig Ae/Be Stars,” 1994, 237–+
- Nisini et al. (2005) Nisini, B., Bacciotti, F., Giannini, T., et al. A&A, 441, 2005, 159
- Nisini et al. (2002) Nisini, B., Caratti o Garatti, A., Giannini, T., & Lorenzetti, D. A&A, 393, 2002, 1035
- Palla (2005) Palla, F. In R. Cesaroni, M. Felli, E. Churchwell, & M. Walmsley, eds., “IAU Symposium,” 2005, 196–205
- Palla & Stahler (1990) Palla, F. & Stahler, S. W. ApJ, 360, 1990, L47
- Perrin et al. (2006) Perrin, M. D., Duchene, G., Kalas., P., & Graham, J. R. ApJ, 645, 2006, 1272
- Perrin et al. (2004) Perrin, M. D., Graham, J. R., Kalas, P., et al. Science, 303, 2004, 1345
- Pesenti et al. (2003) Pesenti, N., Dougados, C., Cabrit, S., et al. A&A, 410, 2003, 155
- Pinte et al. (2006) Pinte, C., Ménard, F., Duchêne, G., & Bastien, P. A&A, 459, 2006, 797
- Podio et al. (2006) Podio, L., Bacciotti, F., Nisini, B., et al. A&A, 456, 2006, 189
- Pudritz et al. (2007) Pudritz, R. E., Ouyed, R., Fendt, C., & Brandenburg, A. In B. Reipurth, D. Jewitt, & K. Keil, eds., “Protostars and Planets V,” 2007, 277–294
- Pyo et al. (2006) Pyo, T.-S., Hayashi, M., Kobayashi, N., et al. ArXiv Astrophysics e-prints, 2006
- Ray et al. (2007) Ray, T., Dougados, C., Bacciotti, F., et al. In B. Reipurth, D. Jewitt, & K. Keil, eds., “Protostars and Planets V,” 2007, 231–244
- Roberts et al. (2004) Roberts, L. C., Jr., Perrin, M. D., Marchis, F., et al. In D. Bonaccini Calia, B. L. Ellerbroek, & R. Ragazzoni, eds., “Advancements in Adaptive Optics. Edited by Domenico B. Calia, Brent L. Ellerbroek, and Roberto Ragazzoni. Proceedings of the SPIE, Volume 5490, pp. 504-515 (2004).”, 2004, 504–515
- Sauty et al. (1999) Sauty, C., Tsinganos, K., & Trussoni, E. A&A, 348, 1999, 327
- Sauty et al. (2003) Sauty, C., Tsinganos, K., Trussoni, E., & Meliani, Z. Ap&SS, 287, 2003, 25
- Shang et al. (2007) Shang, H., Li, Z.-Y., & Hirano, N. In B. Reipurth, D. Jewitt, & K. Keil, eds., “Protostars and Planets V,” 2007, 261–276
- Shepherd et al. (2001) Shepherd, D. S., Claussen, M. J., & Kurtz, S. E. Science, 292, 2001, 1513
- Shepherd et al. (1998) Shepherd, D. S., Watson, A. M., Sargent, A. I., & Churchwell, E. ApJ, 507, 1998, 861
- Stine & O’Neal (1998) Stine, P. C. & O’Neal, D. AJ, 116, 1998, 890
- van Dam et al. (2006) van Dam, M. A., Bouchez, A. H., Le Mignant, D., et al. PASP, 118, 2006, 310
- van den Ancker et al. (1998) van den Ancker, M. E., de Winter, D., & Tjin A Djie, H. R. E. A&A, 330, 1998, 145
- Vink et al. (2002) Vink, J. S., Drew, J. E., Harries, T. J., & Oudmaijer, R. D. MNRAS, 337, 2002, 356
- Wassell et al. (2006) Wassell, E. J., Grady, C. A., Woodgate, B., et al. ApJ, 650, 2006, 985
- Waters & Waelkens (1998) Waters, L. B. F. M. & Waelkens, C. ARA&A, 36, 1998, 233
- Watson & Stapelfeldt (2004) Watson, A. M. & Stapelfeldt, K. R. ApJ, 602, 2004, 860
- Wizinowich et al. (2006) Wizinowich, P. L., Le Mignant, D., Bouchez, A. H., et al. PASP, 118, 2006, 297
- Woitas et al. (2005) Woitas, J., Bacciotti, F., Ray, T. P., et al. A&A, 432, 2005, 149
- Woitas et al. (2002) Woitas, J., Ray, T. P., Bacciotti, F., et al. ApJ, 580, 2002, 336
- Zinnecker et al. (1998) Zinnecker, H., McCaughrean, M. J., & Rayner, J. T. Nature, 394, 1998, 862