The SDSS-GALEX viewpoint of the truncated red sequence in field environments at
Abstract
We combine GALEX near-UV photometry with a volume-limited sample of local () SDSS DR4 galaxies to examine the composition and the environmental dependencies of the optical and UV-optical colour-magnitude (C-M) diagrams. We find that 0% of red sequence galaxies in the optical C-M diagram show signs of ongoing star-formation from their spectra having EW(HÅ. This contamination is greatest at faint magnitudes (M) and in field regions where as many as three-quarters of red sequence galaxies are star-forming, and as such has important consequences for following the build-up of the red sequence. We find that the colour instead allows a much more robust separation of passively-evolving and star-forming galaxies, which allows the build-up of the UV-selected red sequence with redshift and environment to be directly interpreted in terms of the assembly of stellar mass in passively-evolving galaxies. We find that in isolated field regions the number density of UV-optical red sequence galaxies declines rapidly at magnitudes fainter than M and appears completely truncated at M. This confirms the findings of Haines et al. (2007) that no passively-evolving dwarf galaxies are found more than two virial radii from a massive halo, whether that be a group, cluster or massive galaxy. These results support the downsizing paradigm whereby the red sequence is assembled from the top down, being already largely in place at the bright end by , and the faint end filled in at later epochs in clusters and groups through environment-related processes such as ram-pressure stripping or galaxy harassment.
keywords:
galaxies: clusters: general — galaxies: evolution — galaxies: luminosity function — galaxies: stellar content1 Introduction
The most widely studied bimodality in the galaxy properties is that observed for their colours, that is the clear separation of galaxies into the red sequence and blue cloud populations (e.g. Strateva et al., 2001). This has the advantage that it is easy to measure, particularly at high-redshifts, allowing studies to follow the evolution of the bimodality to (Bell et al., 2004; Willmer et al., 2006), and demonstrating its existence at even (Giallongo et al., 2005; Cirasuolo et al., 2006). The main drawback of using optical colours is that they do not necessarily fully relate to the underlying star-formation history, in particular galaxies can appear red not only because they are passive, but also through high levels of dust extinction produced by star-bursts.
A number of studies have followed separately the evolution of the red and blue galaxy luminosity functions to , in particular with regard to characterising the build-up of the red sequence population. There is little evolution in the number density of massive red sequence galaxies with , with only a factor two increase in the stellar mass density from to the present day (Bell et al., 2004; Willmer et al., 2006), or a factor six since (Glazebrook et al., 2004). At lower stellar masses however a much more rapid evolution is observed. By the stellar mass density of red galaxies with has dropped by an order of magnitude, while by this cut-off mass has risen to (Bundy et al., 2006). The red sequence thus appears to be built up from the top down, with the most massive galaxies in place first at , and the faint end incrementally filled in at lower redshifts.
The epoch and rapidity over which the red sequence is assembled is found to be a function of environment. Tanaka et al. (2005) follow the build-up of the red sequence as a function of environment at three redshifts, (based on SDSS data), and . In cluster environments the data are consistent with there being no significant growth of the red sequence since , except for a hint of evolution in the lowest mass bin () between and . Similarly, De Lucia et al. (2007) find evidence for a deficit of faint () red sequence galaxies in 18 EDiSCS clusters at with respect to present day clusters. They find that the observed decrease in the numbers of faint red sequence galaxies are consistent with a simple model whereby these galaxies are formed as the result of blue galaxies in clusters at having their star-formation suppressed by the hostile cluster environment. In field environments the fraction of galaxies on the red sequence is lower than in clusters at all luminosities and all redshifts to (Tanaka et al., 2005), showing that the colour-density relation is already in place at . There is also a deficit of faint red sequence galaxies in field regions, both at and at the present day, indicating that the assembly of the red sequence is still incomplete in low density environments (Tanaka et al., 2005).
In Haines et al. (2006, 2007, Papers I and II) we presented an analysis of star-formation in galaxies as a function of both luminosity and environment in order to constrain the physical mechanisms that drive the star-formation histories of galaxies of different masses. In Paper I we used the fourth data release of the Sloan Digital Sky Survey (SDSS DR4; Adelman-McCarthy et al., 2006) to investigate the possible mass dependency of the SF-density and age-density relations in the vicinity of the supercluster centred on the rich cluster Abell 2199. For giant galaxies (M) we found gradual age-density and SF-density trends extending to the lowest densities studied, with the clusters dominated by old, passively-evolving galaxies while in field regions we found equal fractions of old, passively-evolving and young, star-forming galaxy populations which were completely interspersed. In contrast for the dwarf galaxy population () we found a sharp transition from the virialized regions of clusters and groups which were still dominated by old, passively-evolving galaxies, to outside where virtually all dwarf galaxies were young with ongoing star-formation. The few old, passively-evolving dwarf galaxies outside of the clusters were always found to reside in poor groups or as a satellite to a massive galaxy.
In Paper II we extended the analysis to the entire SDSS DR4, using a sample of 27 753 galaxies in the redshift range that is 0% complete to M. In high-density regions we found 70% of galaxies to be passively-evolving (EW[HÅ) independent of luminosity. In the rarefied field however, the fraction of passively-evolving galaxies was found to be strongly luminosity-dependent, dropping from 50% for M to zero by M. Indeed for the lowest luminosity bin studied () none of the 00 galaxies in the lowest density quartile were found to be passive. Throughout the SDSS DR4 dataset we found no passively-evolving dwarf galaxy more than two virial radii from a massive halo, whether that be a cluster, group or massive galaxy.
These results imply fundamental differences in the formation and evolution of giant and dwarf galaxies. Recently a theoretical framework has been proposed whereby the differences are related to: (i) the increasing star-formation efficiencies and decreasing gas consumption time-scales with galaxy mass resultant from the Kennicutt-Schmidt law (Kennicutt, 1998; Chiosi & Carraro, 2002); (ii) the way that gas from the galaxy halo cools and flows onto the galaxy (Kereš et al., 2005; Dekel & Birnboim, 2006) and which affects its ability to maintain star-formation over many Gyr; as well as (iii) AGN feedback which can effectively permanently shut down star-formation in massive galaxies (Springel et al., 2005a; Croton et al., 2006). The lack of passively-evolving dwarf galaxies in isolated field regions implies that internal processes, such as AGN feedback, merging or gas consumption through star-formation, are not able to completely shut down star-formation in these galaxies. Instead star-formation in dwarf galaxies is only terminated once they become satellites in massive halos, probably through the combined effects of tidal forces and ram-pressure stripping.
In this article we examine what consequences these differences have on the form of the red sequence in the local universe, and its variation from within the high-density environments of clusters and groups, to the lowest density regions of the rarefied field. In 2 we describe the dataset used, that is the same spectroscopic sample as in Paper II, which allows us to classify the galaxies as passive, star-forming or AGN, as well as fully define the local environment of each galaxy. In 3 we examine the extent and make-up of the red sequence as a function of environment, based on the colour-magnitude diagram. In particular we examine the issue of the contamination of the red sequence by dusty star-forming galaxies as found by Wolf et al. (2005) and Davoodi et al. (2006), and which are likely to represent a major problem for high-redshift samples. To resolve these problems in 4 we take advantage of the significant coverage of the SDSS DR4 footprint by near-ultraviolet (NUV) imaging from the GALEX public archive, to obtain colour-magnitude diagrams in both cluster and field environments. We show that this provides a much cleaner separation of passive and star-forming galaxies, and find that in isolated field regions the red sequence appears truncated at M, confirming the lack of passively-evolving dwarf galaxies in these rarefied environments. We also examine the issue of aperture bias on our classification of galaxies, as our spectroscopic sample covers the redshift range for which aperture biases are known to be important, at least for massive galaxies (Brinchmann et al., 2004; Kewley et al., 2005). Finally in 5 we present our discussion and conclusions. Throughout we assume a concordance CDM cosmology with , and Hkm s-1Mpc-1.
2 The Data
The galaxy sample is the same as that used and described in Paper II, consisting of 27 753 galaxies in the redshift range from the low-redshift subsample (Blanton et al., 2005a) from the New York University - Value Added Catalogue (NYU-VAGC; Blanton et al., 2005b). This is a subsample of galaxies from the SDSS DR4 spectroscopic dataset for which additional checks have been made for badly deblended objects and absolute magnitudes have been calculated using version 3.2 of the software k-correct (Blanton et al., 2003). We consider only those galaxies belonging to the two large contiguous regions in the North Galactic Cap, excluding the three narrow stripes with .
We use the stellar indices of the MPA/JHU SDSS DR4 catalogues (Kauffmann et al., 2003), in which the emission-line fluxes are corrected for stellar absorption using a continuum fitting code based on the Bruzual & Charlot (2003) population synthesis models (Tremonti et al., 2004). In Paper II we showed that the distribution of the H equivalent widths of M galaxies is strongly bimodal, allowing them to be robustly separated into passively-evolving and star-forming populations about a value EW(HÅ. Additionally we identify AGN using the [Nii] versus [Oiii] diagnostic diagrams of Baldwin, Phillips & Terlevich (1981) as those galaxies lying above the lower limit of the models defined by Kewley et al. (2001). When either the [Oiii] or H lines are unavailable (), the two-line method of Miller et al. (2003) is used, with AGN identified as having log([Nii].
The local environment of each galaxy is quantified using a variant of the adaptive kernel estimator (Pisani, 1996), whereby each M galaxy is represented by a Gaussian kernel in redshift-space, , of width 500 km s-1 in the radial direction, and whose transverse width is defined by the distance to its third nearest neighbour within 500 km s-1. The choice both of the method and of the kernel dimensions is designed to resolve the galaxy’s environment on the scale of its host dark matter halo, as it is the mass of a galaxy’s host halo and whether the galaxy is the central or a satellite galaxy, that is believed to be the dominant factor in defining its global properties such as its star-formation history or morphology (e.g. Lemson & Kauffmann, 1999; Kauffmann et al., 2004; Yang et al., 2005; Blanton et al., 2006). In the case of galaxies within groups or clusters, the local environment is measured on the scale of their host halo (0.1–1 Mpc), while for galaxies in field regions the local density is estimated by smoothing over its 5–10 nearest neighbours or scales of 1–5 Mpc. In Paper II we tested the efficiency of this density estimator by applying it to the public galaxy catalogues from the Millennium simulations (Springel et al., 2005b), finding it very sensitive to the presence of even very poor groups comparable to the Local Group containing as few as four M galaxies, which represent the preferred mass-scale of major mergers for galaxies of stellar mass –1 (Hopkins et al., 2007). By selecting galaxies with Mpc-2 (500 km s a pure field sample is produced with no contamination from group members. In contrast 60% of and 90% of galaxies lie within the virial radius of a galaxy group or cluster.
3 The make-up of the red sequence in optical surveys
The high quality photometric and spectroscopic data of the SDSS have allowed thorough analyses of the bivariate colour-magnitude distribution of galaxies to be determined, demonstrating its bimodal nature, particularly in terms of galaxy colours (e.g. Strateva et al., 2001; Baldry et al., 2004). Baldry et al. (2004) show that the colour distribution of galaxies in any given magnitude bin is well described by double Gaussians for the entire magnitude range covered (), allowing galaxies to be split into red and blue populations. The relative contribution of the red sequence population is found to increase with luminosity/mass, as well as increasing local density (Baldry et al., 2004; Balogh et al., 2004). The relative simplicity of observing this bimodal colour-magnitude distribution of galaxies has allowed it to be followed out to (Bell et al., 2004; Bundy et al., 2006; Willmer et al., 2006). To relate these observational results to theoretical predictions for the growth and evolution of galaxies it is broadly assumed that red sequence galaxies are passively-evolving galaxies dominated by old stellar populations formed at , while blue galaxies are star-forming galaxies whose optical emission is dominated by young stellar populations. The main uncertainty in such a model is that the optical colours of galaxies do not necessarily fully relate to the underlying star-formation history as described above. In particular galaxies can appear red both because they are passive, but also through high levels of dust extinction produced by star-bursts. A much more reliable measure of the recent star-formation history of galaxies than their optical colour can be made from their spectra, in particular the level of H emission.
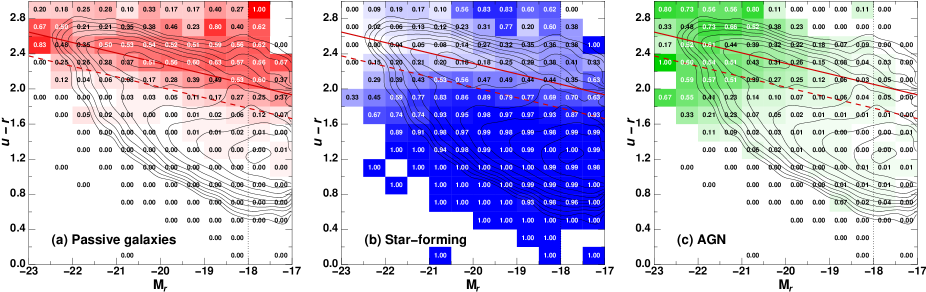
In Figure 1 we look at how the colour-magnitude diagram is broken up into (a) passively-evolving, (b) star-forming and (c) AGN components as determined from their spectra. In each panel the black contours indicate the global bivariate density distribution of galaxies in colour-magnitude space. The black contours are spaced logarithmically, such that the galaxy density doubles every two contours. Over this redshift range the SDSS spectroscopic sample is expected to be 0% complete to M, the main source of incompleteness being due to fibre collisions, but at fainter magnitudes galaxies will only be observable within a certain redshift range, which in some cases may be much less than overall redshift range of the sample. To correct for this issue, we weight each galaxy by V where Vmax is the maximum volume over which the galaxy could be observed within the survey volume, Vsurvey.
For each bin in colour and Mr magnitude we calculate the relative contribution of passively-evolving galaxies (EW[HÅ; not AGN), star-forming galaxies (EW[HÅ; not AGN) and AGN, in panels (a-c) respectively. For each bin in the colour-magnitude diagram containing at least one galaxy, the global fraction of passively-evolving galaxies is indicated both by the numeric value, and the colour shading of the box, with increasingly intense red colours indicating higher passive galaxy fractions in that bin. Panels (b) and (c) show respectively the contributions of star-forming galaxies (blue-shaded boxes) and AGN (green-shaded boxes).
The bimodality of galaxy properties in colour-magnitude space is clear, with a population of red () galaxies that extends over the full magnitude range covered forming the red sequence, and a second population of blue () galaxies that show a greater dispersion in colour, but tend to be less luminous in general than their red counterparts. Panel (a) shows that passively-evolving galaxies are well confined to the red sequence, with virtually no passive galaxies showing blue optical colours with .
The C-M relation of red sequence galaxies shows the well known slope due to metallicity effects. We apply the method of López-Cruz, Barkhouse & Yee (2004) to estimate the slope and width of the C-M relation, using the biweight algorithm (Beers et al., 1990) to estimate the dispersion about the relation, and varying the slope to minimize the biweight scale of the deviations about the median (see e.g. Haines et al., 2004). Considering just the passively-evolving galaxies we obtain a best-fitting relation of:
| (1) |
(shown by the red solid lines in panels a-c), and a width . The best fit closely follows the main axis of the maximum in the galaxy density contours due to the red sequence population, demonstrating the validity in using only the passive galaxies to obtain the fit. We identify red sequence galaxies as those which have colours redder than the black dashed line, which corresponds to a relation bluer than the red sequence, and where equal numbers of passive and star-forming galaxies are observed when averaged over all environments.
In panel (b) we see that virtually all blue galaxies are identified as star-forming from their spectra, and hence to a first approximation the correlation between galaxy colour and the current star-formation rate appears good. However it is also notable that a significant fraction of galaxies with red optical colours () are in fact star-forming, particularly at the faint end (), where 53% of red sequence galaxies (i.e. above the dashed line) are spectroscopically classed as star-forming. Finally in panel (c) we see that AGN are generally red and confined to the most luminous galaxies in the sample where they make up 0% of the galaxy population, this fraction falling to close to zero by M as shown in Paper II.
Hence, while passive galaxies are red, red galaxies are not necessarily passive. In an analysis of the SDSS main sample galaxies covered by infrared imaging from the SWIRE survey, Davoodi et al. (2006) find that 17% of red sequence galaxies are dusty, star-forming galaxies (identified by their high 24 m to 3.6 m flux ratios and H emission), while Wolf et al. (2005) find that dusty, star-forming galaxies make up more than one-third of the red sequence population in the the A 901/2 supercluster system at , finding them preferentially in the medium-density outskirts of the clusters.
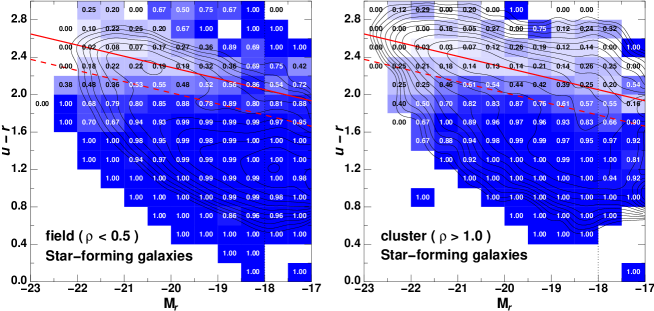
Given that the relative fractions of passively-evolving/red and star-forming/blue galaxies of a given luminosity/stellar mass are strongly dependent on local environment, particularly at the faint end (Balogh et al., 2004; Baldry et al., 2006; Haines et al., 2007), the contamination of the red sequence by star-forming galaxies is also likely to be strongly dependent on environment. In Fig. 2 we show how the optical colour-magnitude diagram and the relative contribution from star-forming galaxies changes from field (; left panel) to cluster (; right panel) environments. The contours in each panel indicate the bivariate volume-corrected number density in colour-magnitude space as in Fig. 1, this time for field and cluster galaxies respectively. The bivariate distribution of field galaxies is similar to that for the global population, mainly as the majority (64%) of galaxies are found in field regions. The main difference is that in field regions the red sequence is less well populated, particularly at faint magnitudes. In cluster regions, the bivariate colour-magnitude distribution of galaxies is instead dominated by the red sequence, which can be clearly seen to extend to the completeness limit of the sample at M, the “blue cloud” appearing now merely as a tail of galaxies extending bluewards from the red sequence.
Looking now at the fraction of red sequence galaxies which are in fact spectroscopically classed as star-forming, it is clear that the contamination of dusty star-forming galaxies is much greater in field regions than in clusters, and in all environments the contamination is greater at faint magnitudes. It is also notable that most galaxies that are above the red sequence () are in fact star-forming, their red colours simply due to dust extinction.
We summarize these trends in Table 1 which shows the fraction of red sequence galaxies (i.e. above the red dashed lines in Figures 1 and 2) which are spectroscopically classed as star-forming as a function of both environment and luminosity. Globally, we find that 31% of red sequence galaxies (with M) are star-forming, similar to that found by Wolf et al. (2005), but larger than the 17% obtained by Davoodi et al. (2006). This difference is most likely due to their sample being biased towards more luminous galaxies than ours, and in fact we find just 18% of M galaxies to be star-forming.
| Magnitude | Global | Field | Cluster |
|---|---|---|---|
| range | fraction | () | () |
| all | 31.% | 3% | 24.% |
| M | 1.1% | 21.% | 14.% |
| 5% | 7% | 3% |
The most notable figure in Table 1 is that for red sequence galaxies in field regions, where we find 7% to be classed as star-forming. This has important consequences for interpreting many of the recent studies for the build-up of the red sequence, both in the local universe, and at high redshifts. For example, Baldry et al. (2006) show that in low-density regions the fraction of galaxies belonging to the red sequence is strongly dependent on stellar mass, dropping from 0% at to % at . However in a similar analysis where galaxies are spectroscopically classified as passive or star-forming from their H emission, Haines et al. (2007) find that the fraction of passively-evolving galaxies drops to precisely zero by M or . Similarly, Tanaka et al. (2005) determine the luminosity function of red sequence galaxies in field regions, obtaining a Schechter function with a very shallow faint-end slope (), but which appears to flatten out at the faintest magnitudes () due to a residual population of faint red sequence galaxies. Our results indicate that around three-quarters of this residual faint red sequence population in field regions are in fact star-forming galaxies. Hence if a more robust colour selection could be applied to separate passive and star-forming galaxies, this residual faint red population would largely disappear in field regions (if not entirely111In Paper II, we find all the few passively-evolving dwarf galaxies in field regions to be satellites to massive galaxies), and the resultant luminosity function of red sequence galaxies would have an even shallower faint-end slope, and could even be completely truncated.
4 The GALEX-SDSS view of the red sequence at
To resolve the limitations inherent in the SDSS colour-magnitude diagram in separating passively-evolving and star-forming galaxies, we consider instead the colour-magnitude relation. The launch of the Galaxy Evolution Explorer (Martin et al., 2005) has allowed both near-ultraviolet (NUV; Å, Å) and far-ultraviolet (FUV; Å, Å) photometry to be obtained for a large sample of galaxies from the SDSS. The UV photometry from GALEX provides a global measure of star-formation on timescales years, that is an order of magnitude more sensitive to low levels of recent star-formation (where % of the mass in stars in the galaxy form in the last Gyr) overlaid on otherwise old stellar populations than optical photometry (e.g. ) alone (e.g. Martin et al., 2005, 2007; Kauffmann et al., 2006). Similarly, the colour is shown to correlate tightly with the birthrate parameter (the ratio of the current to past-averaged star-formation rates; Salim et al., 2005) and the age-sensitive spectral indices d4000 and H (Martin et al., 2007), implying that the star-formation history of a galaxy can be constrained from its colour alone. Indeed analyses of the UV-optical colour-magnitude relations of early-type galaxies selected from the matched GALEX/SDSS catalogues found a much greater scatter in the UV-optical colours than from their optical colours, a result that was interpreted as due to low-level residual star-formation being common in early-type galaxies (Rich et al., 2005; Kaviraj et al., 2006; Schawinski et al., 2006). Moreover Salim et al. (2007) show that the combined FUV and NUV photometry can be used to obtain reliable measures of dust-corrected SFRs for star-forming galaxies to an accuracy of 0.2 dex that agree with estimates based on H fluxes to 10% across the entire range of galaxy masses.
For this analysis we use the 3rd data release of the Galaxy Evolution Explorer (GALEX GR3) near-ultraviolet imaging (Martin et al., 2005). Passively-evolving galaxies at have .5–6 (Yi et al., 2005), requiring imaging to detect all galaxies from our SDSS spectroscopic sample. Hence we consider those GALEX GR3 images from the Medium Imaging Survey (MIS), Nearby Galaxy Survey (NGS) and the publicly available Guest Investigator images which have exposure times ksec and depths of . We also use images from the Deep Imaging Survey (DIS) and two fields from Guest Investigator Program 35 (PI: G. Williger) which have exposure times ksec and depths of (Martin et al., 2005). In total 528 GALEX GR3 NUV images from these surveys overlap with the SDSS DR4 footprint, for a total area of 490.1 deg2.
For each galaxy in our catalogue that is covered by deep GALEX NUV imaging, we take the best (using the best available reduction which may not be that used to select the spectroscopic target) SDSS -band “corrected frame” () image from the SDSS Data Archive Server (DAS). If there is more than one image, we take the one where the galaxy is furthest from the image boundaries. We then register the associated GALEX NUV image with the SDSS -band image using the iraf tool sregister. This takes as input the pipeline astrometric calibrations for each image, the relative astrometric precision between the two images being 0.49 arcsec (Morrissey et al., 2007). We obtain the integrated galaxy colour, by running SExtractor in dual-image mode, determining the colour over the Kron aperture determined from the image. This step is necessary as the light distribution from galaxies can be quite different between the NUV and -bands: the dominant source of NUV flux are star-forming regions in the disks, while that the -band flux comes more from the old stellar populations in the bulge. In late-type spirals in particular, the NUV flux distribution may be shredded by SExtractor into separate star-forming regions. Hence simply matching the nearest GALEX NUV detection with the SDSS -band detection can result in artificially red colours as the NUV aperture does not cover the whole galaxy. We use the SDSS and GALEX photometric calibrations (Stoughton et al., 2002; Morrissey et al., 2005) which have zero-point uncertainties of 0.01 and 0.03 mAB in the and NUV bands respectively (Morrissey et al., 2007). We make no correction for the different point-spread functions (PSFs) of the NUV and -band images, the typical FWHMs being 4.9 and 1.0–1.5 arcsec respectively. This can result in a loss of flux due to the extended PSF in the NUV-band, but for the typical-sized Kron apertures in our sample the effects should be less than 0.10 mag (Morrissey et al., 2007). We correct for Galactic extinction using A(NUV and A( using the dust extinction maps of Schlegel et al. (1998).
In total 4065 galaxies from our sample were covered by the GALEX NUV imaging, of which just two were not detected, both of which were passively-evolving dwarf galaxies (M) in high-density regions ().
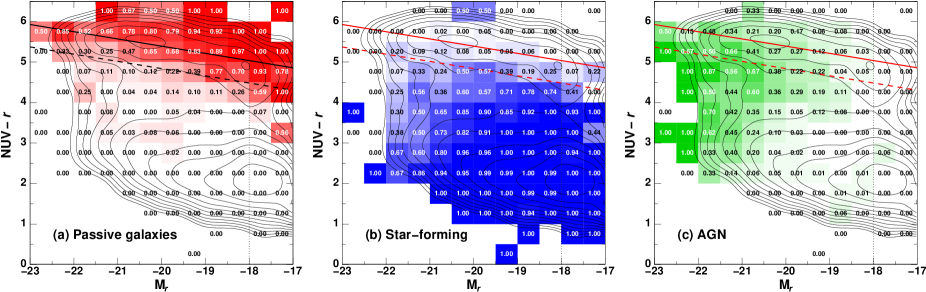
In Figure 3 we show the global make-up of the colour-magnitude diagram, breaking it up into its (a) passive-evolving, (b) star-forming and (c) AGN components, analogously to the optical colour-magnitude diagram of Fig. 1. As before, the contours indicate the global volume-weighted bivariate number distribution of galaxies. The bimodality of galaxy properties in colour-magnitude space is again apparent, with a robust separation of red and blue galaxies about a colour that extends over the full magnitude range covered (see also Wyder et al., 2007), and appears much cleaner than for the optical counterpart. The separation of the red sequence and the “blue cloud” is mag in , but only mag in .
Panel (a) shows that, as for the optical colour-magnitude diagram, passive galaxies are well confined to the red sequence, with few passive galaxies showing blue UV-optical colours with . We estimate the zero-point, slope and dispersion of the red sequence as before using the colours and -band absolute magnitudes of each galaxy classified as passively-evolving (EW[HÅ; including AGN), obtaining a C-M relation of:
| (2) |
(shown by the black solid line in panel a) and a dispersion of . This value is consistent with the 0.3–0.5 mag obtained by Wyder et al. (2007) who fitted the colour distribution for each half magnitude bin in Mr,0.1 by two Gaussian functions for the red and blue sequences. Thus the scatter in the NUV-optical red sequence of Wyder et al. (2007) is principally due to the scatter from the passively-evolving component which dominates it. Our is notably smaller than the mag dispersion observed by Kaviraj et al. (2006) for morphologically selected early-type galaxies (with the SDSS parameter in , and bands) from the SDSS DR3, due to a significant fraction of these early-type galaxies having ongoing star-formation. As before we identify red sequence galaxies as those which are less than bluer than the C-M relation, i.e. that lie above the dashed line.
In panel (b) we see that virtually all blue galaxies with are spectroscopically star-forming (except at the very bright end where AGN begin to dominate as shown in panel c). Unlike the optical colour-magnitude diagram where a significant fraction of red galaxies were also classified as star-forming, we see few star-forming galaxies with . Indeed, globally we find that just 8% of galaxies belonging to the NUV-optical red sequence are classified as star-forming as opposed to 31% of galaxies from the optical red sequence. In Table 2 we report the corresponding fractions of star-forming galaxies among the NUV-optical red sequence population as a function of both magnitude and environment. In all cases the contamination of the NUV-optical red sequence by star-forming galaxies is significantly less (by typically a factor 3–5) than for the optically selected red sequence galaxies, being 0% for all subsamples except for the faint, field galaxy population where 30% appear to be star-forming. However we note that this last result is based on just four star-forming galaxies out of thirteen red sequence galaxies. We thus argue that the position of a galaxy in the colour-magnitude diagram can be used as a robust classifier of its recent star-formation history, efficiently separating passively-evolving and star-forming galaxies.
In panel (c) we show that AGN dominate the bright end of the colour-magnitude diagram, and typically have colours that are intermediate between the red sequence and blue cloud, lying in the so-called “green valley”. Indeed this preponderance of AGN in the transition zone between the red sequence and blue cloud has been proposed as evidence for galaxies becoming passive as the result of AGN feedback (e.g. Kauffmann et al., 2006; Martin et al., 2007). The concept that these intermediate objects in the “green valley” represent a third population that is distinct both from the red and blue sequences is confirmed by Wyder et al. (2007) who were unable to fit the overall colour distribution of galaxies by double Gaussians in the same way as Baldry et al. (2004) were able to using their colours, due to excess galaxies with intermediate colours. Moreover, they show that this “green valley” population remains even after correcting their colours for dust exctinction, confirming that they represent a true intermediate population.
| Magnitude | Global | Field | Cluster |
|---|---|---|---|
| range | fraction | () | () |
| all | 8.% | 10.% | 53% |
| M | 6.6% | 3% | 5.% |
| 10..7% | 30.% | 50% |
In Paper II we found that the fraction of passively-evolving galaxies is a strong function of both luminosity/stellar mass and local environment. In particular we found that in low-density regions corresponding to field environments well outside the influence of clusters and groups, the fraction of passively-evolving galaxies is a strong function of luminosity, dropping from 0% for galaxies to zero by M. Moreover, those few passively-evolving galaxies outside groups and clusters were invariably found to be satellites to massive galaxies. This was put forward as strong evidence that dwarf galaxies do not become passive through internal mechanisms, but only through environment-related processes after they become satellites within massive halos.
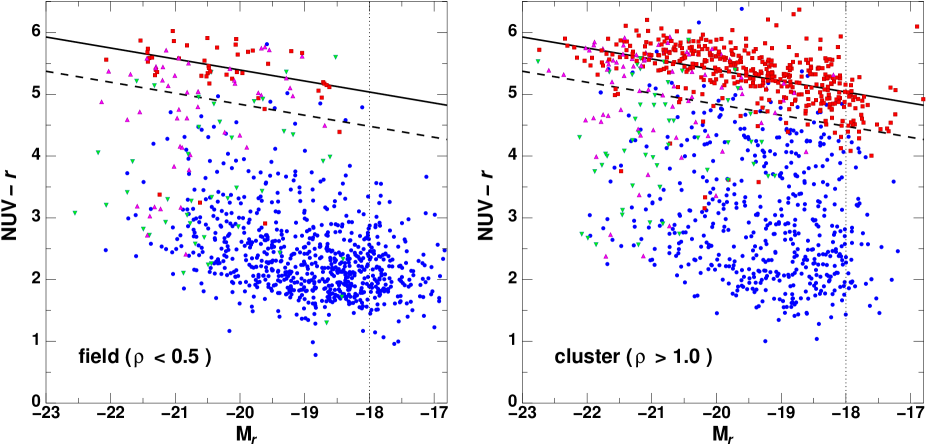
In Figure 4 we compare the colour-magnitude diagrams of galaxies in field (; left panel) and cluster (; right panel) environments. In Paper II we found that the few passively-evolving dwarf galaxies in field regions () were almost always satellites to massive galaxies (M), and that throughout the SDSS DR4 dataset there were no passively-evolving dwarf galaxies more than two virial radii from a massive halo, whether that be a cluster, group or massive galaxy. Hence to confirm this result we remove those field galaxies within a projected distance of 400 kpc and a radial velocity within 300 km s-1 of a M galaxy. These comprise around 10% of the total field galaxy population. Our resultant field galaxy sample thus only contains galaxies that are unlikely to have had any encounter with a massive halo in their past. The NUV-optical red sequence should then represent only those galaxies which have become passive through internal processes such as merging, AGN feedback and gas exhaustion through star-formation.
We separate galaxies into star-forming (EW[HÅ; shown as blue circles) and passively-evolving (EW[HÅ; red squares) galaxies, to measure the correspondence between the current star-formation rate and the colour of galaxies. Galaxies with optical AGN signatures are indicated by green triangles (for those with EW[HÅ) or magenta triangles (EW[HÅ).
In cluster regions (; right panel) there is a clear NUV-optical red sequence dominated by passively-evolving galaxies that extends to at least the completeness limit of the survey (M). There appears to be a break in the red sequence at M, with massive red sequence galaxies having similar colours () while fainter galaxies become increasingly blue. Similar trends have been seen by Boselli et al. (2005) who find the dichotomy between giant and dwarf red sequence galaxies to be even stronger when using the FUV-optical or FUV-NIR colours. Wyder et al. (2007) in contrast find no evidence of a break in the NUV-optical red sequence, fitting it instead by a straight line for . Fitting separate C-M relations to bright (M) and faint () passively-evolving galaxies we obtain slopes of and respectively, and hence the break appears significant. Considering now a C-M relation with break at M the overall dispersion is reduced slightly to , with no significant difference between bright and faint magnitudes.
At all luminosities we see an extended tail of galaxies with bluer colours, being mostly AGN at the bright-end and star-forming galaxies at fainter magnitudes. Although many of these galaxies have corresponding to the peak of the blue cloud distribution seen in Fig. 3, a significant fraction are found with transitional colours being in the “green valley” with –5. We see no obvious separation between the red sequence and the blue cloud populations in cluster environments.
In isolated field regions however, the dominant feature of the colour-magnitude diagram becomes the blue cloud population at , made up almost entirely of star-forming galaxies, except at the very bright tip (M) where AGN take over. The red sequence is now sparsely populated at all magnitudes and appears truncated below M.
4.1 The red and blue galaxy luminosity functions
The galaxy luminosity function, which describes the number of galaxies per unit volume as a function of luminosity, is a powerful tool to constrain galaxy evolution and transformations, since it is directly related to the galaxy mass function. In particular, by separating galaxies by their colour into the red sequence and blue cloud populations, and obtaining the type-specific luminosity functions, the growth of the red sequence and the transformation of blue to red galaxies can be followed.
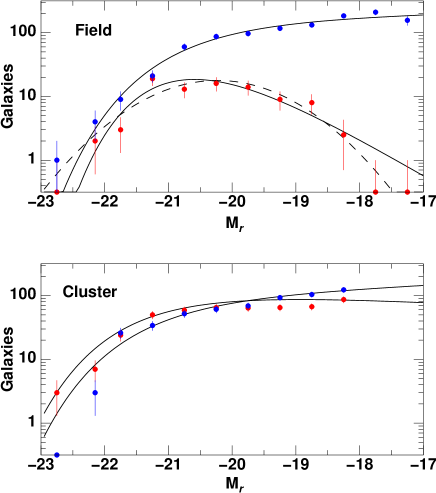
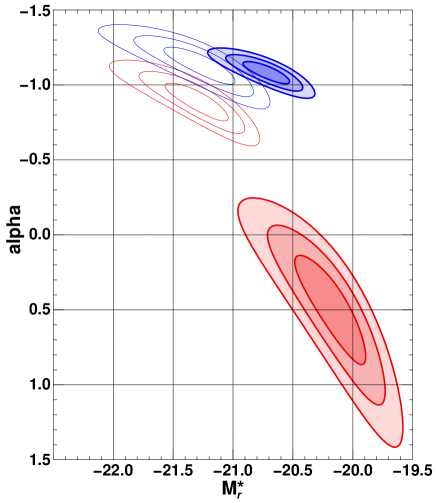
In Figure 5 we plot the red and blue volume-corrected galaxy luminosity functions (as red and blue symbols respectively) in both field and cluster environments, based on the galaxies shown in Fig. 4, where the dashed line is used to separate the red and blue galaxy populations. We correct for incompleteness at faint magnitudes as before by weighting each galaxy by V. For each luminosity function we determine the best-fitting single Schechter (1976) function based on a maximum-likelihood analysis, shown by the black curves. The resultant best-fit parameters are presented in Table 3, where the reported errors represent the 68.3% confidence limits in and M∗. The uncertainties in and M∗ are expected to be correlated, and in Figure 6 we present the 1, 2 and 3 confidence limits in M and defined as the regions containing 68.3, 95.4 and 99.7% of the probability of finding the parameters within the contours. The filled and empty contours correspond respectively to the galaxy luminosity functions in field and cluster environments.
We see little sign of variations in the luminosity function of blue galaxies from field to cluster environments, with marginal evidence for an increase in the luminosity of M∗ from field to cluster environments, but no difference in the faint-end slope. In contrast the luminosity function of the red sequence populations in field and cluster environments are inconsistent at level. In particular, the red sequence luminosity function in field regions peaks at M and drops rapidly at magnitudes fainter than M, with no red galaxies at M. This decline results in a very shallow faint-end slope , and we are also able to fit the red sequence field galaxy population equally well by a single Gaussian function with and M as shown by the dashed curve in Fig 5. Although we are limited by the small number of red galaxies in our SDSS-GALEX field sample, it is possible that the red sequence is completely truncated below M in these rarefied environments.
| LF params | M∗ | ||
| Field regions (, 0 kpc from M galaxy) | |||
| red | 49.3 | ||
| blue | 163.2 | ||
| Cluster regions () | |||
| red | 135.9 | ||
| blue | 110.3 | ||
4.2 Aperture biases in the SDSS spectroscopic sample
One of the major concerns of using the fibre-obtained SDSS spectra for nearby galaxy samples, such as those used in Papers I and II, is the effect of aperture biases, due to the spectra being obtained through 3 arcsec diameter apertures rather than over the full extent of the galaxy. Significant radial star-formation gradients are possible within galaxies, particularly those undergoing nuclear star-bursts or spiral galaxies with prominent passively-evolving bulges, that can result in the “global” star-formation rate extrapolated from spectra containing flux from only the galaxy nucleus being significantly over or underestimated. Kewley, Jansen & Geller (2005) indicate that star-formation rates based on spectra obtained through apertures containing less than 0% of the integrated galaxy flux can be over or underestimated by a factor , and to ensure the SDSS fibres sample more than 20% require galaxies to be at . Clearly in order to use the SDSS dataset to study star-formation in dwarf galaxies this is not possible, as at they are already too faint to be included in the SDSS spectroscopic sample.
In Papers I and II we are primarily interested in the simple classification of galaxies into passive and star-forming, and so the main issue is the number of early-type spiral galaxies which may appear passive from spectra that sample only their bulge, but have also normal star-forming disks. As demonstrated earlier, the integrated colour gives a robust separation of passive and star-forming galaxies. Hence we can quantify the level of aperture bias as the fraction of galaxies that are classified as “passive” from their spectra by having EW(HÅ, yet have global UV-optical colours indicative of star-forming galaxies, defined as those with .
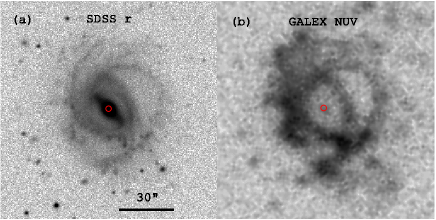
In Figure 7 we show the band (panel a) and NUV-band (panel b) images of a typical misclassified galaxy from our sample (, M), with the apertures used to obtain the SDSS spectra indicated by the red circles. The galaxy is a clearly face-on early-type spiral, whose -band flux is dominated by a bulge, but also with clear spiral arms. In the NUV-band image however, this bulge disappears almost completely, while the extended UV-flux from star-formation in the disk and spiral arms is now dominant. The reason for the misclassification is clear, the SDSS aperture covers only the central bulge which is passively-evolving as apparent from the “hole” in the UV-emission in the nuclear regions, yet misses entirely the extended star-forming regions from the outer disk and spiral arms.
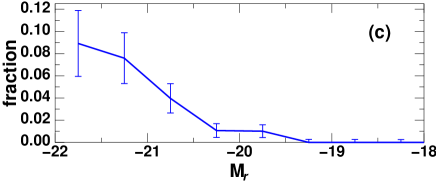
In panel (c) we show the fraction of galaxies misclassified due to aperture effects as a function of absolute magnitude. We find that the level of misclassification due to aperture effects is strongly luminosity dependent, dropping from eight per cent at M (20 out of 246) to zero for M galaxies. We indicate that aperture biases are significant for M galaxies, where seven per cent are spectroscopically classified as passive, yet whose blue integrated colours are indicative of recent star-formation. As expected many of these galaxies appear as face-on spiral galaxies with prominent bulges, whose predominately old and passive stellar populations dominate the flux within the SDSS spectral apertures. In contrast we find that none of the 1375 M galaxies in the SDSS sample covered by GALEX NUV photometry are misclassified, indicating that the classification of such low-luminosity galaxies based on their H emission as measured through the SDSS fibres is robust against aperture biases.
We can understand this luminosity dependence for the level of aperture bias as the combination of two effects: (i) more luminous galaxies at the same distance will have larger apparent sizes, and so the fraction of flux covered by the SDSS fibres will be reduced; and (ii) low-luminosity galaxies tend to be either late-type spirals or dwarf ellipticals and hence do not have such significant radial gradients in their star-formation rates. The luminosity function of early-type spirals (Sa+b) for which aperture biases are by far the most important has a Gaussian distribution centred at M and width mag (de Lapparent, 2003), and hence are rare at M.
5 Discussion
We have combined GALEX NUV photometry from the 3rd data release with a volume-limited sample of local SDSS DR4 galaxies to examine the make-up and the environmental dependencies of the optical and UV-optical colour-magnitude (C-M) diagrams. We consider the same SDSS DR4 spectroscopic sample of 27 753 galaxies in the redshift range as used in Paper II, that is 0% complete to M. From this sample, 4 065 galaxies are also covered by NUV photometry from the 490.1 deg2 area covered by both the SDSS DR4 spectroscopic survey and GALEX GR3.
We find that 0% of red sequence galaxies in the optical C-M diagram show signs of ongoing star-formation from their spectra having EW(HÅ. This contamination is greatest at faint magnitudes (M) and in field regions where as many as three-quarters of red sequence galaxies are star-forming. This has important consequences for understanding the build-up of the red and blue sequences being interpreted as the hierarchical assembly of star-forming and passively-evolving galaxies, as the colour of the galaxy cannot be always reliably related to its star-formation history. Instead a significant fraction (and in some cases the majority) of galaxies on the red sequence have star-formation histories more in common with the blue cloud population and appear red simply due to dust, the presence of which is directly related to them having active ongoing star-formation.
The effect of the contamination of the faint end of the red sequence by dusty star-forming galaxies is likely to become increasingly important at higher redshifts, where the global star-formation rates (Noeske et al., 2007; Zheng et al., 2007), and hence the effects of dust extinction are that much higher. This produces a significant overestimation of the amount of stellar mass already in the red sequence at a given epoch, particularly at the low mass end, and an overestimation of the look-back time by which the stellar mass is assembled in passively-evolving galaxies. Similarly, the amount of stellar mass in the blue sequence or star-forming galaxies will be underestimated, as will the global amount of star-formation in the blue sequence. These effects could bias the interpretation of studies looking at the evolution of the optically-defined red and blue sequences with redshift in terms of the hierarchical assembly and conversion of accreted gas into stars in passive and star-forming galaxies (e.g. Bell et al., 2004; Bundy et al., 2006; Glazebrook et al., 2004; Willmer et al., 2006), the result of which could be the over-estimation of the importance of dry mergers to create the present day population of passively-evolving galaxies.
We find that instead the colour allows a much more robust separation of passively-evolving and star-forming galaxies, with a clear red sequence of passively-evolving galaxies at and a well separated blue sequence of star-forming galaxies at . We find that globally only 8% of UV-selected red sequence galaxies are star-forming, i.e. one quarter of the contamination seen in the optical red sequence. This robust separation allows the build-up of the UV-selected red sequence with redshift and environment to be directly interpreted in terms of the assembly of stellar mass in passively-evolving galaxies (see also Arnouts et al., 2007; Martin et al., 2007).
In cluster and group environments we find the UV-selected red sequence to be fully in place to at least M, being well described by a single Schechter function with a faint-end slope . In sharp contrast we find that in isolated field regions the number density of UV-optical red sequence galaxies declines rapidly at magnitudes fainter than M and is completely truncated at M. This confirms the findings of Paper II that no passively-evolving dwarf galaxies are found more than two virial radii from a massive halo, whether that be a group, cluster of massive galaxy. Moreover we show that the classification of dwarf galaxies into passively-evolving and star-forming from their SDSS fibre-obtained spectra as used in Paper II is robust to aperture effects, finding that none of the 1375 M galaxies with integrated colours indicative of recent star-formation were also spectroscopically classified as passive with EW(HÅ. Hence in isolated field regions (where the majority of galaxies are found) we find that the build-up of the red sequence of passively-evolving galaxies is incomplete, forming from the top down and being truncated at M. In these regions only internal processes such as merging, supernovae and AGN feedback mechanisms, and gas exhaustion due to star-formation can be responsible for completely stopping star-formation in galaxies, and hence cannot be effective in low-mass galaxies (for a discussion see Haines et al., 2007) as otherwise passively-evolving dwarf galaxies would be ubiquitous. Instead the passively-evolving dwarf galaxies that dominate (in terms of numbers) groups and clusters and make up the faint-end of the cluster red sequence must have had their star-formation quenched through processes directly related to their environment such as ram-pressure stripping or tidal shocks.
Arnouts et al. (2007) have followed the build-up with redshift of the passive and star-forming galaxy populations as selected from their rest-frame colour and/or their spectral energy distributions obtained by fitting their optical+IR photometry. They are able to obtain a similarly robust separation of rest-frame UV-selected red and blue sequence galaxies to at least and probably as early as . For each redshift bin (using either spectroscopic redshifts from the VIMOS VLT Deep Survey or photometric redshifts) they obtain separate stellar mass functions for the quiescent/red and active/blue galaxy populations. They find that the stellar mass density of red sequence galaxies has increased by a factor two since , and that this increase can be accounted for entirely by the shutdown of star-formation in active galaxies without requiring additional growth through dry mergers, in agreement with the results of Bell et al. (2007) who derive the global star-formation contribution of blue and red galaxy populations from ultraviolet and Spitzer 24 m luminosities.
These results support the downsizing paradigm whereby the red sequence is built-up from the top down, being already largely in place at the bright end by (Bell et al., 2004; Willmer et al., 2006), and the faint end filled in at later epochs in clusters and groups through environment-related processes such as ram-pressure stripping or galaxy harassment. This filling in of the faint end appears to occur mainly at , and occurs earlier in the richest clusters. Tanaka et al. (2007) find few faint red galaxies in four clumps belonging to a large-scale structure at suggesting that the red sequence is truncated within groups at M, whereas by combining several rich clusters at Strazzullo et al. (2006) find the red sequence to be fitted by a Schechter function with to at least M. De Lucia et al. (2007) find an increase of a factor two in the dwarf-to-giant ratio of red sequence galaxies from to , while Stott et al. (2007) find evidence for a further doubling of the dwarf-to-giant ratio in the cluster red sequence since . De Lucia et al. (2007) find that this incremental filling in of the faint cluster red sequence population since is consistent with a simple model whereby blue galaxies in clusters at have their star-formation suppressed by the hostile cluster environment.
At all epochs to Tanaka et al. (2005) find a deficit of faint (M) red sequence galaxies in field regions, with respect to cluster and group environments, although their deficits are not as dramatic as presented here due to the use of photometric redshifts and statistical subtraction methods to define the field sample, as well as the use of rest-frame colour-magnitude diagrams to define the red sequence population. To obtain clearer results for the field dwarf galaxy population at these redshifts would require a large-scale spectroscopic survey of galaxies to in order to define both the redshifts and environments of each galaxy, something that is within reach of present surveys (e.g. DEEP2, VVDS), at least to .
acknowledgements
CPH acknowledges the financial supports provided through the European Community’s Human Potential Program, under contract HPRN-CT-2002-0031 SISCO. The authors thank Gianni Busarello, Amata Mercurio and Francesco La Barbera for stimulating discussions during this project.
Funding for the SDSS and SDSS-II has been provided by the Alfred P. Sloan Foundation, the Participating Institutions, the National Science Foundation, the U.S. Department of Energy, the National Aeronautics and Space Administration, the Japanese Monbukagakusho, the Max Planck Society, and the Higher Education Funding Council for England. The SDSS Web Site is http://www.sdss.org/.
The SDSS is managed by the Astrophysical Research Consortium for the Participating Institutions. The Participating Institutions are the American Museum of Natural History, Astrophysical Institute Potsdam, University of Basel, University of Cambridge, Case Western Reserve University, University of Chicago, Drexel University, Fermilab, the Institute for Advanced Study, the Japan Participation Group, Johns Hopkins University, the Joint Institute for Nuclear Astrophysics, the Kavli Institute for Particle Astrophysics and Cosmology, the Korean Scientist Group, the Chinese Academy of Sciences (LAMOST), Los Alamos National Laboratory, the Max-Planck-Institute for Astronomy (MPIA), the Max-Planck-Institute for Astrophysics (MPA), New Mexico State University, Ohio State University, University of Pittsburgh, University of Portsmouth, Princeton University, the United States Naval Observatory, and the University of Washington.
This research has made use of the NASA/IPAC Extragalactic Database (NED) which is operated by the Jet Propulsion Laboratory, California Institute of Technology, under contract with the National Aeronautics and Space Administration.
GALEX (Galaxy Evolution Explorer) is a NASA Small Explorer, launched in April 2003. We gratefully acknowledge NASA’s support for the construction, operation, and science analysis for the GALEX mission, developed in cooperation with the Centre National d’Etudes Spatiales of France and the Korean Ministry of Science and Technology.
References
- Adelman-McCarthy et al. (2006) Adelman-McCarthy, J. K., et al. 2006, ApJS, 163, 38
- Arnouts et al. (2007) Arnouts S., et al. 2007, preprint (astro-ph/0705.2438)
- Baldry et al. (2004) Baldry I. K., et al. 2004, ApJ, 600, 681
- Baldry et al. (2006) Baldry I. K., et al. 2006, MNRAS, 373, 469
- Baldwin et al. (1981) Baldwin J. A., Phillips M. M., Terlevich R., 1981, PASP, 93, 5
- Balogh et al. (2004) Balogh M. L., Baldry I. K., Nichol R., Miller C., Bower R., Glazebrook K., 2004, ApJL, 615, 101
- Beers et al. (1990) Beers T.C., Flynn K., Gebhardt K., 1990, AJ, 100, 32
- Bell et al. (2004) Bell E. F., et al. 2004, ApJ, 608, 752
- Bell et al. (2007) Bell E. F., et al. 2007, preprint (astro-ph/0704.3077)
- Blanton et al. (2006) Blanton M. R., Berlind A. A., Hogg D. W., 2006, preprint (astro-ph/0608353)
- Blanton et al. (2003) Blanton M. R., et al. 2003, AJ, 125, 2348
- Blanton et al. (2005a) Blanton M. R., et al. 2005a, ApJ, 631, 208
- Blanton et al. (2005b) Blanton M. R., et al. 2005b, AJ, 129, 2562
- Boselli et al. (2005) Boselli A., et al. 2005, ApJL, 629, 29
- Brinchmann et al. (2004) Brinchmann J., et al. 2004, MNRAS, 351, 1151
- Bruzual & Charlot (2003) Bruzual A. G., Charlot S., 2003, MNRAS, 344, 1000
- Bundy et al. (2006) Bundy K., et al. 2006, ApJ, 651, 120
- Chiosi & Carraro (2002) Chiosi C., Cararro G., 2002, MNRAS, 335, 335
- Cirasuolo et al. (2006) Cirasuolo M., et al. 2006, preprint (astro-ph/0609287)
- Croton et al. (2006) Croton D. J., et al. 2006, MNRAS, 368, 11
- Davoodi et al. (2006) Davoodi P., et al. 2006, MNRAS, 371, 1113
- Dekel & Birnboim (2006) Dekel A., Birnboim Y., 2006, MNRAS, 368, 2
- de Lapparent (2003) de Lapparent V., 2003, A&A, 408, 845
- De Lucia et al. (2007) De Lucia G., et al. 2007, MNRAS, 374, 809
- Giallongo et al. (2005) Giallongo E., et al. 2005, ApJ, 622, 116
- Glazebrook et al. (2004) Glazebrook K., et al. 2004, Nature, 430, 181
- Haines et al. (2004) Haines C. P., Merluzzi P., Mercurio A., Gargiulo A., Krusanova N., Busarello G., La Barbera F., Capaccioli M. 2004, MNRAS, 371, 55
- Haines et al. (2006) Haines C. P., La Barbera F., Mercurio A., Merluzzi P., Busarello G., 2006, ApJL, 647, 21 (Paper I)
- Haines et al. (2007) Haines C. P., Gargiulo A., La Barbera F., Mercurio A., Merluzzi P., Busarello G., 2007, MNRAS in press, preprint (astro-ph/0707.1262) (Paper II)
- Hopkins et al. (2007) Hopkins P. F., Hernquist L., Cox T. J., Kereš D., 2007, preprint (astro-ph/0706.1243)
- Kauffmann et al. (2003) Kauffmann G., et al. 2003, MNRAS, 341, 33
- Kauffmann et al. (2004) Kauffmann G., et al. 2004, MNRAS, 353, 713
- Kauffmann et al. (2006) Kauffmann G., et al. 2006, preprint (astro-ph/0609436)
- Kaviraj et al. (2006) Kaviraj S., et al. 2006, preprint (astro-ph/0601029)
- Kennicutt (1998) Kennicutt R. C., Jr. 1998, ARA&A, 36, 189
- Kereš et al. (2005) Kereš D., Katz N., Weinberg D.H., Davé R., 2005, MNRAS, 363, 2
- Kewley et al. (2001) Kewley L. J., Dopita M. A., Sutherland R. S., Heisler C. A., Trevena J., 2001, ApJ, 556, 121
- Kewley et al. (2005) Kewley L. J., Jansen R. A., Geller M. J., 2005, PASP, 117, 227
- Lemson & Kauffmann (1999) Lemson G., Kauffmann G., 1999, 302, 111
- López-Cruz, Barkhouse & Yee (2004) López-Cruz O., Barkhouse W., Yee H. K. C., 2004, ApJ, 614, 679,
- Martin et al. (2005) Martin D. C., et al. 2005, ApJL, 619, 1
- Martin et al. (2007) Martin D. C., et al. 2007, preprint (astro-ph/0703281)
- Miller et al. (2003) Miller C. J., et al. 2003, ApJ, 597, 142
- Morrissey et al. (2005) Morrissey P., et al. 2005, ApJL, 619, 7
- Morrissey et al. (2007) Morrissey P., et al. 2007, preprint (astro-ph/0706.0755)
- Noeske et al. (2007) Noeske K. G., et al. 2007, ApJL, 660, 43
- Pisani (1996) Pisani A., 1996, MNRAS, 278, 697
- Rich et al. (2005) Rich R., et al. 2005, ApJL, 619, 107
- Salim et al. (2005) Salim S., et al. 2005, ApJL, 619, 39
- Salim et al. (2007) Salim S., et al. 2007, preprint (astro-ph/0704.3611)
- Schlegel et al. (1998) Schlegel D. J., Finkbeiner D. P., Davis M., 1998, ApJ, 500, 525
- Schawinski et al. (2006) Schawinski K., et al. 2006a, preprint (astro-ph/0601036)
- Schawinski et al. (2006) Schawinski K., et al. 2006b, Nature, 442, 888
- Schechter (1976) Schechter P., 1976, ApJ, 203, 297
- Springel et al. (2005a) Springel V., di Matteo T., Hernquist L., 2005a, MNRAS, 361, 776
- Springel et al. (2005b) Springel V., et al. 2005b, Nat, 435, 629
- Stoughton et al. (2002) Stoughton C., et al. 2002, AJ, 123, 485
- Stott et al. (2007) Stott J. P., Smail I., Edge A. C., Ebeling H., Smith G. P., Kneib J.-P., Pimbblet K. A., 2007, ApJ, 661, 95
- Strateva et al. (2001) Strateva I., et al. 2001, AJ, 122, 1861
- Strazzullo et al. (2006) Strateva I., et al. 2006, A&A, 450, 909
- Tanaka et al. (2005) Tanaka M., et al. 2005, MNRAS, 362, 268
- Tanaka et al. (2007) Tanaka M., et al. 2007, MNRAS, 377, 1206
- Tremonti et al. (2004) Tremonti C. A., et al. 2004, ApJ, 613, 898
- Willmer et al. (2006) Willmer C. N. A., et al. 2006, 647, 853
- Wolf et al. (2005) Wolf C., Gray M. E., Meisenheimer K. 2005, A&A, 443, 435
- Wyder et al. (2007) Wyder T., et al. 2007, prepint (astro-ph/0706.3938)
- Yang et al. (2005) Yang X., Mo H. J., van den Bosch F. C., Jing Y. P. 2005, MNRAS, 356, 1293
- Yi et al. (2005) Yi S. K., et al. 2005, ApJL, 619, 111
- Zheng et al. (2007) Zheng X. Z., et al. 2007, preprint (astro-ph/0702208)