Dust-scattered X–ray halos around two Swift gamma-ray bursts: GRB 061019 and GRB 070129
Two new expanding X–ray rings were detected by the
Swift XRT instrument during early follow-up observations of GRB
061019 and GRB 070129, increasing to 5 the number of dust
scattering X–ray halos observed around GRBs. Although these two
halos were particularly faint, a sensitive analysis can be
performed that optimizes the method originally developed
by Tiengo & Mereghetti (2006) to analyze dust scattering rings
observed with XMM-Newton for the Swift satellite. In the case of GRB 061019, a known giant
molecular cloud is identified as the one responsible for the
scattering process, and its distance is accurately measured
(d=94040 pc) through the dynamics of the expanding ring. In
the second case, XRT observed both the main peak of the prompt
emission of GRB 070129 and the scattering halo, but the small
number of detected halo photons prevents us from distinguish between different dust
models.
Key Words.:
Gamma Rays: bursts - Methods: data analysis1 Introduction
The scattering of X–rays from interstellar dust grains is often responsible for the formation of diffuse halos surrounding bright sources. The study of such halos can then be used to infer the properties of the dust and its spatial distribution (Mathis & Lee, 1991; Draine, 2003), and, in case of variable sources, can also yield information on the source’s distance (Trümper & Schönfelder, 1973).
Thanks to rapid follow-up observations with sensitive X–ray telescopes, it has recently become possible to observe halos around gamma-ray bursts. Scattering halos due to dust in our Galaxy have been detected around three gamma-ray bursts: GRB 031203 (Vaughan et al., 2004), GRB 050724 (Vaughan et al., 2006), and GRB 050713A (Tiengo & Mereghetti, 2006). Due to the short duration of the bursts and the relatively small thickness of the dust layers, such halos appear as expanding rings. For the dust distances typically involved here (hundreds of parsecs) the rings have angular radii of a few arcminutes after several thousand seconds from burst time:
| (1) |
The brightness of the halo, IHALO, depends on the intensity of the GRB emission, IGRB, and on the scattering optical depth, : IHALO = IGRB (1–e-τ) IGRB. The same dust is responsible both for the X–ray halos and for the interstellar reddening, so is usually inferred from measurements of the optical reddening . However, different relations have been reported in the literature between and . Draine has developed a detailed physical model of the dust (Draine, 2003) and extracted from this model the following relation between optical extinction and scattering optical depth in the soft X–ray range (Draine & Bond, 2004):
| (2) |
However, a different relation was empirically found by Predehl & Schmitt (1995), that is:
| (3) |
If both IHALO and IGRB are known or can be estimated, as in the case of GRB 050724 (Vaughan et al., 2006), some information on the amount of dust and its properties can be derived. Otherwise, by knowing or making assumptions about the amount of dust and its properties, the measurement of the radiation scattered in the halo can provide some information on the GRB prompt emission at a few keV. This has been done, for example, for GRB 031203 (Vaughan et al., 2004; Tiengo & Mereghetti, 2006). Here we report on two new dust-scattering rings recently observed with Swift around the gamma-ray bursts GRB 061019 (Romano et al., 2006) and GRB 070129 (Vianello et al., 2007). Our analysis is based on a method particularly convenient in the case of faint, expanding halos (Tiengo & Mereghetti, 2006), which is briefly described in the next section.
2 Analysis method
The method developed by Tiengo & Mereghetti (2006) for detecting and analyzing expanding dust halos can be applied to any imaging X–ray detector. We applied it to data obtained with the X–Ray Telescope (XRT) onboard Swift (Burrows et al., 2000).
For each count detected by the XRT, we computed the arrival time , in seconds from the burst time, and its squared angular distance from the GRB position, . Based on these quantities, we built a dynamical image, that is a 2-D histogram with on the x-axis and on the y-axis. In such an image an expanding ring forms a straight line with an angular coefficient depending on the dust distance, as can be seen from Eq.1. In this way we can easily detect a dust-scattering ring and estimate the distance of the dust layer from the line slope. In order to determine the halo intensity and dust layer distance and thickness, we removed the GRB afterglow and any other point sources from the event list, and we computed the value for each detected event. In the ideal case (thin dust layer and perfect instrument), every halo event will have the same value of , corresponding to the actual distance of the dust layer. In real cases, instead, the instrument point spread function (PSF) and the intrinsic width of the scattering dust layer produce a distribution of centered on the dust layer distance. If we plot the distribution of the quantity (dust distance distribution hereinafter), we obtain a single peak centered on the real dust layer distance, formed by the photons belonging to the ring, superimposed on a background distribution.
If the instrument PSF is described well by a King function (as in the case of both XMM-EPIC and Swift-XRT), the dust ring peak is well-modeled by a Lorentzian function. When the observation is continuous (as typically in the case of XMM-EPIC observations), the background distribution is a power law, so the dust distance distribution is described by a Lorentzian plus a power law. Unfortunately, the Swift observations are always discontinuous, owing to the low earth orbit of the satellite and to the particular observation plan adopted by XRT 111Typically the observing plan of a GRB afterglow is composed of several individual exposures separated by time gaps.. Since in this case the background distribution cannot be easily described analytically, we developed a Montecarlo simulation that reproduces the contribution to the dust distance distribution produced by the background counts, as well as the dust scattering ring, taking the actual observation plan into account. This simulation is also useful for understaning some other aspects of the phenomenon better, such as the effects due to the instrumental PSF and effective area or due to the dust layer intrinsic width. Our simulation can generate a GRB prompt X–ray emission based on input parameters describing its timing and spectral characteristics; alternatively, it can use as input an event file obtained during real observations of the X–ray prompt emission. Then it models the scattering process using the layer distance and thickness as input. Our simulation can use either of the relations (2) or (3). Taking the characteristics of the instrument (PSF and effective area), the background and the given observation plan into account, the program generates an output event file in a standard format allowing its analysis as that of a real observation.
3 GRB 061019
GRB 061019 was discovered with the Swift Burst Alert Telescope (BAT) and localized at Galactic coordinates l= and b= (Guidorzi et al., 2006a, b). The XRT and UVOT began their observations of the burst location 2800 s after the trigger time = 04:19:06 UT. A dust scattering ring was discovered (Romano et al., 2006) in the first three orbits of XRT Photon Counting data (from s to s).
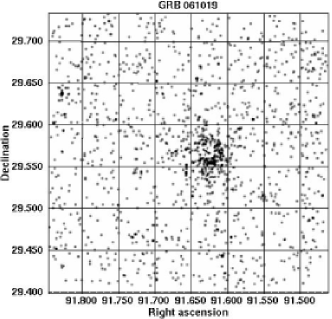
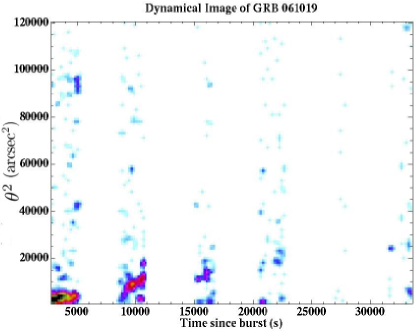
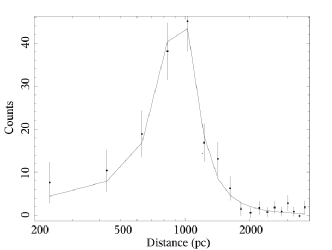
Our analysis of these data has confirmed the detection of the ring. The scattering halo is very visible in the sky image and in the dynamical image shown in Fig.1. These images, as well as all the analysis discussed below, refer to the 0.2–4 keV energy range. The line formed by the halo events in the dynamical image is rather wide due to the intrinsic thickness of the expanding ring, which remains clearly visible until s after the burst. We estimated the background count rate from four regions of the XRT field of view, at least away from the afterglow position and with no evident point sources. The average count rate was counts s-1 arcsec-2 and no significant spatial variability was found by comparing the different regions. Using the Montecarlo simulator described above with this background rate (and its error), we estimated the dust distance distribution expected for the background counts. This distribution was subtracted from the data, taking both the statistical (poissonian) errors and that of the background rate into account, in order to derive the net distance distribution for the halo shown in Fig. 2. After removing the background, the halo counts are in the keV energy range. The peak is well-fitted with a Lorentzian centered at pc and with FWHM width pc ( with 16 d.o.f.). Our simulations show that in this case the XRT PSF produces a peak width of pc. By fixing the Lorentzian FWHM at this value, we obtained a fit to the peak with the same center ( pc), but with a significantly worse chi-square ( with 17 d.o.f.) corresponing to a chance probability of 4%, so that the hypothesis of a zero-thickness cloud is rejected at 3 sigma level. We thus conclude that the PSF is only partially responsible for the observed ring width and that the dust layer causing the scattering has an intrinsic width pc.
The halo spectrum can be fitted with an absorbed power law. Due to
the small number of counts we fixed the hydrogen column
density to the best-fit value obtained for the afterglow
( cm-2, Guidorzi et al. 2006b), finding a
photon index and a halo fluence of
cm-2 ( with 2 d.o.f). Adopting the
optical depth-energy relation in Eq.2 and assuming the optical extinction reported in Schlegel et al. (1998) for the bust direction (), we estimated the prompt X–ray fluence following the method described in Tiengo & Mereghetti (2006) as
erg cm-2 ( keV) . If we
extrapolate the BAT spectrum (, 15-150 keV
fluence = erg cm-2, Sakamoto et al. 2006)
to the keV energy range, we obtain a fluence of
erg cm-2, in agreement with our
estimate.
We thus conclude that, for this GRB, the prompt emission
at soft X–ray energies ( keV) is consistent with an
extrapolation of the hard X–ray emission ( keV),
suggesting that it probably has the same origin.
If we instead adopt the optical depth-energy relation in Eq.3 we obtain a flux in the 1-2 keV band that is times greater than the BAT-extrapolated value. However, owing to the errors in the estimate of the spectral parameters of the ring and in the optical extinction , this result is not conclusive.
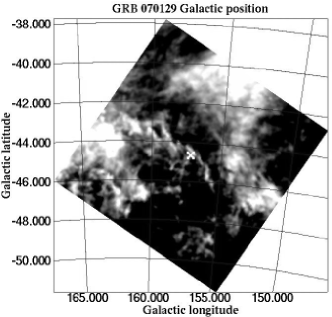
4 GRB 070129
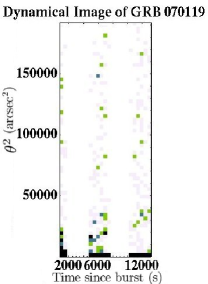
On 2007-01-29 the BAT instrument was triggered at 23:35:10 UT by a precursor of GRB 070129, and the Swift satellite automatically slewed to the derived sky position. This allowed detection of the main peak of emission, which was detected at 23:41:30 UT by both the BAT and XRT instruments. Despite the burst location at high Galactic latitude (l=, b=), in a region of moderate absorption (optical extinction , Schlegel et al. 1998), a detailed analysis of the XRT data led to the discovery of a faint partial ring (Vianello et al., 2007) centered at the afterglow position. The ring radius increased from to during the second and third Swift orbits (from s to s). Figure 3 shows the dynamical image obtained from the XRT Photon Counting data. The expanding ring is evident in the second and third orbits. The cross section of the scattering process decreases rapidly with energy (see Eqs.2 and 3) and becomes vanishingly small above a few keV, so just as for the previous burst, we restricted our analysis to energies below 4 keV. From an annulus with radii of and centered on the afterglow and excluding point sources and flickering pixels, we estimated a background count rate of cts s-1 arcsec-2. Inspecting the dynamical image, we selected the region containing the halo as an annulus of inner radius of and outer radius of . If we consider for the moment only the second orbit, this region contains counts, of which are expected to be background. Thus the net number of halo counts in the second orbit is , corresponding to a detection at the confidence level.
Owing to the small number of halo counts, we based our analysis on the integral distribution of . This approach has the advantage of using all the available information and avoids the arbitrariness of data binning. The integral distributions of the Lorentzian peaks are arctan profiles, with corresponding to an inflection point. Consider the expected halo region, which is an annulus centered on the GRB position with inner radius of (in order to exclude the afterglow) and outer radius of (the scattering cross section is negligible at larger radii): the integral dust distance distribution obtained from such a region using only the second and the third orbits is reported in Fig. 4.
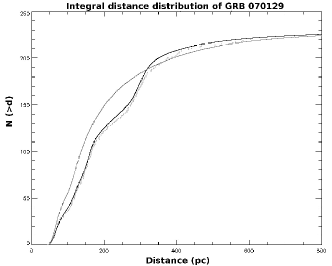
In order to model this distribution, we used the XRT observation of the prompt X–ray emission as input for our simulation, initially with the optical depth-energy relation in Eq.2 and the background rate estimated above. Then we defined a grid of possible values for the distance of the dust layer, and for every value of the grid we made a large number of simulation runs in order to derive the expected shape for the integral distribution. We then used the Kolmogorov-Smirnov (KS) test to compare the observed distribution with those generated by the simulation. We found that the model that described the observations (with a KS-test probability of ) best corresponds to a dust distance of pc. In contrast, if we try to describe the observed distribution with what is expected only from the background, we obtain a probability of only (see Fig. 4). We applied the same procedure to a late observation of the afterglow of GRB 070129, when the dust ring has disappeared. In this case the distance distribution measured from the same annular region is described well (KS-test probability of ) by the one expected from uniform background, demonstrating the accuracy of the background distributions derived with our simulation. Inspecting Fig. 4, one can see that there is another inflection point at 150 pc. This could be due to another, fainter dust ring. Using the same procedure as described above, we found a significant improvement (KS-test probability of ) with two layers of dust, at distances pc and pc. We thus conclude that the halo observed around GRB 070129 is probably due to two dust layers along its line of sight. The knowledge of the prompt X–ray emission should allow us to test and possibly distinguish between different proposed optical depth-energy relations for the scattering process like Eqs.2 and Eq.3, corresponding to different dust properties, such as grain size distribution and composition. Our simulations with the best model derived above for the dust distributions predicts halo counts in the second XRT orbit using the Draine optical depth-energy relation (Eq. 2) and halo counts using the Predehl relation (Eq.3). Although the first value is closer to the observed one ( cts), the inadequate statistics do not allow us to derive a firm conclusion in favor of one of the two possibilities.
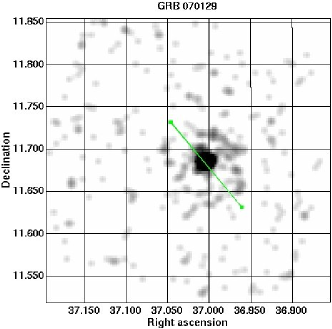
There is some evidence that the ring spatial distribution is not uniform around the GRB position, being more intense in the north west part. Dividing the halo region into two parts, as indicated by the line in Fig. 5, we find counts (halo+background) in the north west part and on the opposite side. We checked that this uneven distribution, corresponding to a chance probability of 1.6%, is not due to a non uniformity in the XRT exposure. The asymmetry in the ring intensity is thus probably due to a inhomogeneous distribution of the dust in the distant layer.
5 Discussion
The first dust scattering ring around a GRB (Vaughan et al., 2004) was discovered thanks to the rapid localization provided by INTEGRAL (Mereghetti et al., 2003) and the large collecting area at the X–ray energy of the EPIC instrument on XMM-Newton. The results reported here demonstrate that, despite its smaller collecting area, Swift can also detect GRB halos, thanks to its capability to point in the GRB direction within a few tens of seconds, thus catching the possible rings near the maximum of their intensity (Mereghetti et al., 2006).
Besides providing in some cases useful information on the GRB prompt X–ray emission, detection of these expanding dust rings offers a powerful tool for mapping the three-dimensional distribution of Galactic dust clouds. It should be noted that the derived distances, based purely on dynamical arguments, can be extremely accurate.
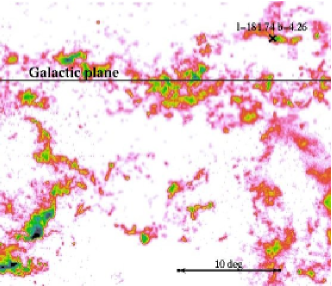
This is exemplified by our results for GRB 061019. The line of sight of the burst passes through the Perseus spiral arm and near the galactic anti-center, where the usual kinematic methods of estimating distances are not applicable. The molecular clouds and nebulae present in this region (see Fig.6) have been extensively studied (Lynds, 1962; Dame et al., 2001; Lee, 1999; Kawamura et al., 1998). In particular, the position of GRB 061019 is consistent with the coordinates of the cloud [KOY98] 66 of the 13CO (J=1-0) survey by Kawamura et al. (1998), placed at a distance of kpc from Earth. Thus our determination of the distance to the dust layer ( pc) suggests an identification with the molecular cloud [KOY98] 66, confirming and refining its distance estimate.
Assuming dust properties, one can extract some information about the
prompt X–ray emission of the GRB from the
spectrum and intensity of the halo, which is generally difficult to
observe directly. This is exemplified by our study of the GRB
061019 halo: adopting the optical depth-energy relation in Eq. 2, we found a prompt
X–ray spectrum consistent with the extrapolation to the few keV
range of the prompt hard X–ray emission observed by Swift-BAT
(Sakamoto et al., 2006). Note that this apparently unsurprising result is
not the rule, as shown by the case of GRB 031203
(Vaughan et al., 2004; Tiengo & Mereghetti, 2006), for which, independent of the adopted
dust models, the derived soft X–ray emission is not
compatible with an extrapolation of the hard X–ray spectrum.
When the prompt X–ray emission is known, the study of the rings
in principle permits us to verify and eventually distinguish between different
proposed scattering optical depth-energy relations (like Eqs.2 and 3), which depends via scattering cross section on the dust properties
like size and composition. This is exemplified in our study of the
rings around GRB 070129, which could not however distinguish
between the two proposed formula, due to the inadequate
statistics of this halo. Future observations of prompt X–ray
emissions followed by dust scattering rings as intense as those of
GRB 061019 or GRB 031203 might lead to more concrete possibilities
of obtaining useful information on the properties of the interstellar
dust in our Galaxy.
Acknowledgements.
This research has been supported by the Italian Space Agency through contract ASI-INAF I/023/05/0.References
- Burrows et al. (2000) Burrows D.N., Hill J.E., et al. 2000, Proc. SPIE Vol. 4140,64
- Dame et al. (2001) Dame T.M., Hartmann D., Thaddeus P., 2001, ApJ 547, 792
- De Luca et al. (2005) De Luca A. et al. 2005, GCN Circ. n. 3695
- Dickey & Lockman (1990) Dickey J.M. & Lockman F.J. 1990, ARA&A 28, 215
- Draine (2003) Draine B.J. 2003, ApJ 598, 1026
- Draine & Bond (2004) Draine B.J. & Bond N.A. 2004, ApJ 617, 987
- Falcone et al. (2005) Falcone A. et al. 2005, GCN Circ n. 3581
- Guidorzi et al. (2006a) Guidorzi C., Marshall, F.E. et al. 2006, GCN Circ n. 5728
- Guidorzi et al. (2006b) Guidorzi C., Romano, P. et al. 2006, GCN Circ n. 5733
- Hakkila et al. (1997) Hakkila, J., Myers, J. M., Stidham, B. J., & Hartmann, D. H. 1997, AJ 114,2043
- Kawamura et al. (1998) Kawamura, A., Onishi, T., et al. 1998, ApJ Suppl., 117, 387
- Kim et al. (2000) Kim, H.G., Lee, Y., et al. 2000, Journal of Korean Astronomical Society, 33, 151-158
- Klose (1994) Klose S. 1994, A&A 289, L1
- Lee (1999) Lee, Y., Jung, J.H., et al. 1999, A&A Suppl., 138, 187-202
- Lynds (1962) Lynds, B.T. 1962, ApJ Suppl., 7, 1
- Loiseau et al. (2005) Loiseau N. et al. 2005, GCN Circ. n. 3594
- Mathis & Lee (1991) Mathis J.S. & Lee C.-W. 1991, ApJ 376, 490
- Mauche & Gorenstein (1986) Mauche C.W. & Gorenstein P. 1986, ApJ 302, 371
- Mereghetti et al. (2003) Mereghetti S., Götz D., Borkowski J., Walter R. & Pedersen H., 2003, A&A 411, L291
- Mereghetti et al. (2006) Mereghetti S., Tiengo A., Vianello G., 2006, Astro-ph, 0612543
- Miralda-Escudé (1999) Miralda-Escudé J. 1999, ApJ 512, 21
- Morris et al. (2005) Morris D. et al. 2005, GCN Circ. n. 3606
- Neckel & Klare (1980) Neckel T. & Klare G. 1980, A&AS 42, 251
- Palmer et al. (2005) Palmer D. et al. 2005, GCN Circ. n. 3597
- Paczynski (1991) Paczynski B. 1991, Acta Astronomica 41, 257
- Predehl & Schmitt (1995) Predehl P. & Schmitt J.H.M.M. 1995, A&A 293, 889
- Prochaska et al. (2004) Prochaska J.X. et al. 2004, ApJ 611, 200
- Racine (1968) Racine, R. 1968, Astronom. Journ., 73, 233
- Romano et al. (2005) Romano P. et al. 2005, GCN Circ. n. 3685
- Romano et al. (2006) Romano P., Guidorzi C., Moretti A., Page K.L., 2006, GCN Circ n. 5737
- Sakamoto et al. (2006) Sakamoto T., Barbier L., Barthelmy S.D. et al. 2006, GCN Circ n.5732
- Sazonov et al. (2004) Sazonov S.Y., Lutovinov A.A. & Sunyaev R.A. 2004, Nature 430, 646
- Schlegel et al. (1998) Schlegel D.J., Finkbeiner D.P., Davis M., ApJ 1998, 500, 525
- Strüder et al. (2001) Strüder L. et al. 2001, A&A 365, L18
- Tiengo & Mereghetti (2006) Tiengo A., Mereghetti S. 2006, A&A 449, 203
- Trümper & Schönfelder (1973) Trümper J. & Schönfelder V. 1973, A&A 25, 445
- Vaughan et al. (2004) Vaughan S., Willingale R., O’Brien P.T., et al. 2004, ApJ 603, L5
- Vaughan et al. (2006) Vaughan S., Willingale R., Romano P., et al. 2006, ApJ 639, 323
- Vianello et al. (2007) Vianello G., Tiengo A., Mereghetti S., 2007, GCN Circ n. 6065
- Watson et al. (2005) Watson D., Vaughan S.A., Willingale R., et al. 2005, ApJ Letters in press, astro-ph/0509477
- Xu et al. (2006) Xu Y., Reid M.J., Zheng X.W., Menten K.M. 2006, Science 311, 54