Detection of M⊙ of molecular gas in
the host galaxy of the SDSS quasar J0927+2001.
Abstract
We have detected emission by the CO 5-4 and 6-5 rotational transitions at from the host galaxy of the SDSS quasar J0927+2001 using the Plateau de Bure interferometer. The peak line flux density for the CO 5-4 line is mJy, with a line FWHM = km s-1. The implied molecular gas mass is M⊙. We also detect the 90 GHz continuum at mJy, consistent with a 47K dust spectrum extrapolated from higher frequencies. J0927+2001 is the second example of a huge molecular gas reservoir within the host galaxy of a quasar within 1 Gyr of the big bang. Observations of J0927+2001 are consistent with a massive starburst coeval with a bright quasar phase in the galaxy, suggesting the rapid formation of both a super-massive black hole through accretion, and the stellar host spheroid, at a time close to the end of cosmic reionization.
1 Introduction
Understanding the relationship between quasars and their host galaxies has become imperative since the discovery of the bulge mass – black hole mass correlation in nearby galaxies, a result which implies a fundamental relationship between the formation of supermassive black holes (SMBH) and spheroidal galaxies (Ferrarese & Merrit 2000; Magorrian et al. 1998; Gebhardt et al. 2000). In our extensive study of the dust and gas content, and star formation activity, of the host galaxies of , luminous (), optically selected high redshift quasars (Omont et al. 2003; Carilli et al. 2002; Bertoldi et al. 2003a; Petric et al. 2003; Beelen et al. 2006; Wang et al. 2007a), we have found that roughly 30% of these sources are also hyper-luminous infrared galaxies ( L⊙). This FIR emission corresponds to thermal emission from warm dust. Searches for CO emission from these sources typically yield molecular gas masses M⊙ (Solomon & Vanden Bout 2005). Such molecular gas represents the fuel for star formation, and can serve as a dynamical tracer in a forming galaxy.
An important finding of our program is that the 30% fraction of FIR luminous quasars continues to the highest redshifts, , approaching the end of cosmic reionization, and hence pushing toward the very first galaxies and SMBHs (eg. Fan, Carilli, & Keating 2006; Fan et al. 2006a). A particularly enlightening example is the highest redshift quasar known, J1148+5251 at . The host galaxy has been detected in thermal dust, non-thermal radio continuum, and CO line emission (Walter et al. 2003; Bertoldi al. 2003b; Carilli et al. 2004), with an FIR luminosity (integrated between m and 122m) of L⊙ (Beelen et al. 2006), a molecular gas mass of M⊙, and a dust mass of M⊙. The dynamical mass to a radius of 2.5 kpc in the host galaxy, as estimated from high resolution VLA imaging of the molecular gas distribution, is comparable to the gas mass, but much less than the mass predicted by the black hole mass – bulge mass relation measured at low redshift (Walter et al. 2004). We have also detected the dominant cooling line of interstellar gas, [CII] 158 m, from J1148+5251 (Maiolino et al. 2005). These observations demonstrate that large reservoirs of dust and metal enriched atomic and molecular gas can exist in massive galaxies within 1 Gyr of the Big Bang. The current observations suggest active star formation in the host galaxy, with a massive star formation rate of order M⊙ year-1, although the question remains as to the contribution to dust heating by the AGN (Wang et al. 2007a; Li et al. 2007a).
The source SDSS J092721.82+200123.7 (hereafter J0927+2001) is similar to J1148+5251 in many ways. J0927+2001 is a quasar selected from the Sloan Digital Sky Survey (York et al. 2000), with an optical redshift of (corresponding to Gyr, assuming a standard concordance cosmology), based on fitting to the (relatively weak) Ly + NV lines, and with L erg s-1 (Fan et al. 2006b; Wang et al. 2007a). The black hole mass estimated from both the Eddington limit, and from UV line widths, is M⊙ (Jiang et al. 2007).
J0927+2001 has been detected in 250 GHz continuum emission at the IRAM 30m telescope, with a flux density of mJy (Wang et al. 2006), and at 350 GHz at the Caltech Submm Observatory, with a flux density of mJy (Wang et al. 2007b, in preparation). These data, in combination with lower and higher frequency data, reveal a clear FIR excess over a standard quasar IR SED. This FIR excess corresponds to thermal emission from warm dust with a temperature K. The dust mass is M⊙, and the FIR luminosity is L⊙. A weak (Jy) radio continuum counterpart has been detected at 1.4 GHz, and the rest-frame radio through FIR SED is within the range defined by star forming galaxies (Wang et al. 2007a). The observations of J0927+2001 are consistent with a massive (stars M⊙) star formation rate of M⊙ year-1 (Kennicutt 1998), or a total star formation rate (stars M⊙) a factor 5.6 higher, assuming a Salpeter initial mass function, and assuming the warm (47 K) dust is heated by star formation.
In this letter we present the discovery of CO 5-4 and 6-5 emission from J0927+2001. These observations reveal the necessary fuel for star formation, and enable a number of key observations in the study of the earliest generation of massive galaxies and SMBH.
2 Observations and results
Our observations have been made with the improved Plateau de Bure interferometer equipped with the new generation of receivers. With their increased sensitivity (detection of sub-mJy lines in a single track), and increased bandwidth (2 of the 4 GHz with the current correlator), these new receivers allow for deep searches for faint redshifted molecular emission lines over bandwidths adequate to cover the typical uncertainties of optical redshifts of high redshift quasars.
We searched for CO 5-4 emission from J0927+2001 with the Plateau de Bure Interferometer in April and May, 2007. The first track (8 hours) used two polarizations, and two frequency settings which covered a total bandwidth of 1.8 GHz (= 5700 km s-1 or = 0.13) centered at (or 84.87 GHz for redshifted CO 5-4). After a possible line was identified in the first observations at , a second 8 hour track was observed centered on the line at 85.12 GHz, covering a total bandwidth of 1 GHz using dual polarization. This second track confirmed the 5-4 line with high significance. A third 8 hour track was then observed centered on the frequency of the CO 6-5 line redshifted to 102.10 GHz, which was also clearly detected. The spectral resolution for all observations was 2.5 MHz channel-1. The phase stability, as measured on the phase calibrator (0851+202) was easily adequate for coherent integration in the D configuration, for which the interferometric synthesized beam had a FWHM . Absolute gain calibration was performed on the star MWC349.
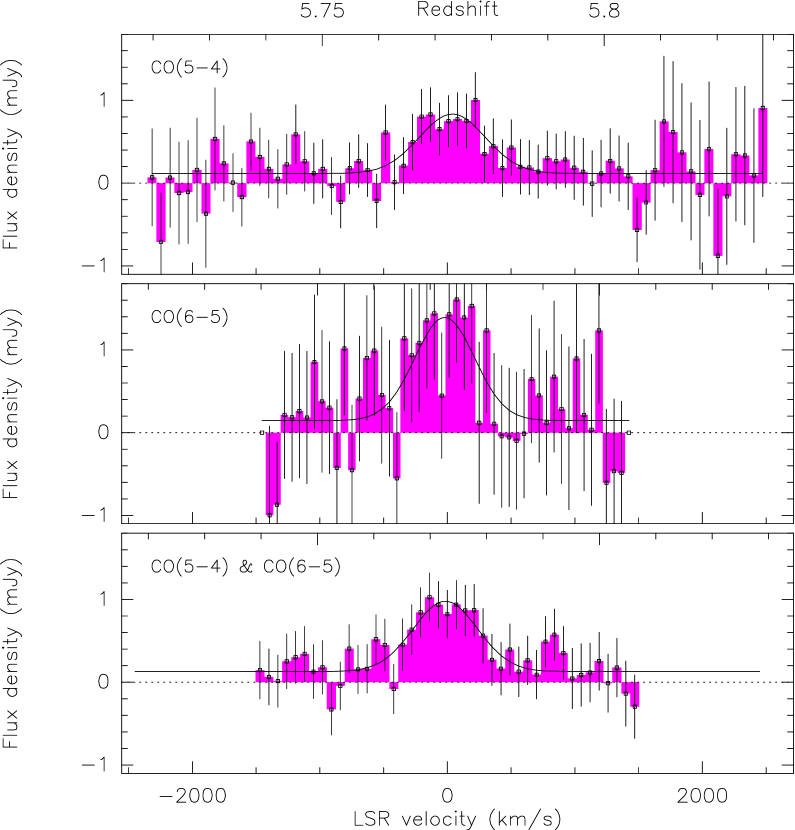
Figure 1 shows the spectra of the CO 5-4 and 6-5 emission lines from J0927+2001 at a spectral resolution of km s-1 channel-1. The rms per channel varies slightly across the spectra, but typical values for the 5-4 spectrum are 0.37 mJy beam-1 for 5-4, and 0.52 mJy beam-1 for 6-5.
Both CO emission lines are clearly detected, as well as the underlying continuum emission at both frequencies. Gaussian fitting to the lines yield the parameters listed in Table 1, including: the continuum level, the line peak flux density and FWHM, the velocity integrated line flux, and the line luminosity, K km s-1 pc2, where is the velocity integrated flux density in Jy km s-1, is the angular diameter distance in Gpc ( = 1.23 Gpc at ), and is the observing frequency in GHz (Solomon et al. 1997). A linewidth of km s-1, and an LSR line centroid of , are derived from the spectrum obtained by merging the CO 5-4 and 6-5 data.
The measured continuum level for the combined data is mJy. Combined with the continuum observations at 250 GHz and 350 GHz, this yields a dust temperature of 47 K, assuming a modified grey body of index (see analysis in Wang et al. 2007b).
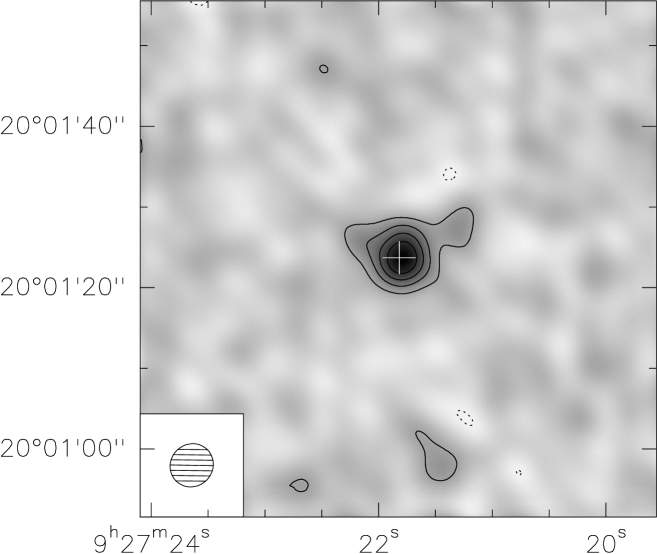
Figure 2 shows the image of the velocity integrated line emission from the weighted sum of the 5-4 and 6-5 lines. The peak of the CO emission is at: (J2000) , or within 0.2 of the optical position. The source appears unresolved at the present resolution of FWHM .
3 Analysis
The ratio of the strength of the two CO transitions is: . This ratio is consistent with constant brightness temperature (ie. ratio = 1) up to CO 6-5. The high CO excitation in J0927+2001 is comparable to that seen in the host galaxy of J1148+5251 (Bertoldi et al. 2003), and other high redshift quasars (Solomon & Vanden Bout 2005; Carilli et al. 2002; Weiss et al. 2007 in prep), as well as in the nuclei of nearby nuclear starburst galaxies, such as NGC 253 and Arp 220 (Greve et al. 2006; Bradford et al. 2003), implying warm (K), dense ( cm-3) gas. However, given the close spacing of the two transitions, observations of a lower order transition (1-0 or 2-1) are needed to better constrain the gas excitation conditions.
We derive the total molecular gas mass (dominated by H2) from the CO luminosity using the conversion factor for CO luminosity to total molecular gas mass appropriate for Ultra-luminous Infrared galaxies (ULIRGs, or galaxies with L⊙ year-1; Downes & Solomon 1998), or , and assuming constant brightness temperature from CO 5-4 down to CO 1-0 (ie. constant ). The implied gas mass is: M⊙. Note that the CO luminosity to gas mass conversion factor is a factor five smaller for ULIRGs than it is for normal galaxies, such as the Milky Way. For a detailed discussion of the conversion of CO luminosity to gas mass in high redshift, FIR luminous galaxies, see Solomon & Vanden Bout (2005).
The ratio of FIR luminosity to CO luminosity has been used as a metric for the relative star formation efficiency in galaxies (ie. proportional to the star formation rate per unit gas mass; Gao & Solomon 2004). For J0927+2001, we find: L⊙ (K km s-1 pc2)-1. In their review of molecular line emission from galaxies at , Solomon & Vanden Bout (2005) find that the values of range between roughly 100 and 1000, with a mean value of 350 L⊙ (K km s-1 pc2)-1, for galaxies with typical FIR luminosities between 1012 and 1013 L⊙. For comparison, lower luminosity star forming galaxies ( L⊙) have ratios an order of magnitude smaller (Kennicutt 1998). J0927+2001 follows this general trend for increasing star formation efficiency with increasing FIR luminosity. These results suggest a relatively short gas depletion timescale (gas mass)/(star formation rate) years, implying a brief, but very intense, starburst. This timescale is comparable to the typical lifetime of luminous, high redshift quasars derived from the clustering of quasars in the SDSS by Shen et al. (2007). Of course, these arguments assume the FIR excess is due to dust heated by star formation, and not the AGN.
Although the gas mass in J0927+2001 is comparable to that in J1148+5251, the line width of 600 km s-1 is almost a factor two broader than the CO emission from J1148+5251, and is at the high end of the CO line width distribution observed for high redshift quasar host galaxies (Carilli & Wang 2006; Greve et al. 2005). A simple explanation for a broader line would be that the gas disk is more inclined to the sky plane in J0927+2001. High resolution imaging of the CO distribution is required to determine the extent, and dynamics, of the molecular gas.
4 Discussion
J0927+2001 is the second example of an extreme molecular gas mass in a galaxy within 1 Gyr of the Big Bang. Like J1148+5251 at , J0927+2001 shows many characteristics of a co-eval massive starburst in the host galaxy of the quasar (Section 1; Wang et al. 2007b). The observations presented herein reveal the requisite molecular gas reservoir to fuel the star formation. As in the case of J1148+5251, Walter et al. (2004) point out that the formation of the heavy elements, and in particular, the ISM processing required to form cooler molecular gas and dust, implies that star formation must have commenced very early in the host galaxy, at least a few hundred million years prior, or .
These results lead to the question: how are such massive galaxies and SMBH formed within 1 Gyr of the Big Bang? Li et al. (2007a, b) have addressed this question through multi-scale cosmological simulations, including prescriptions for the complex processes of star formation and AGN feed-back. They find that early galaxy and SMBH formation is possible in rare (comoving density Gpc-3), high density peaks (halo mass M⊙ at ), in the cosmic density field, through a series of gas-rich, massive mergers starting at . SMBH formation occurs through a combination of Eddington-limited accretion in each progenitor galaxy, plus rapid black hole mergers during galaxy interactions. The stellar spheroids are formed in merger-driven, extreme starbursts, with star formation rates exceeding 103 M⊙ year-1 for short periods ( years). The ISM atomic abundances rapidly approach Solar in the inner few kpc. Li et al. (2007b) suggest that such systems evolve into massive galaxies at the centers of the densest cluster environments seen today ( M⊙).
Li et al. (2007a) hypothesize that systems such as J1148+5251 and J0927+2001 may be in a late starburst phase, where the AGN has recently emerged from its dusty shroud, and now potentially dominates the dust heating, even for the warm dust component. The question of the relative contribution of star formation and the AGN to the heating of the warm dust that produces the observed (rest frame) FIR excesses, will be discussed in detail in Wang et al. (2007b), and can be addressed through the observations suggested below.
One outstanding issue the Li et al. models do not address is the early formation of dust. Such early dust formation remains a puzzle, since the standard ISM dust formation mechanism, ie. in the cool winds from evolved low mass (AGB) stars, may require timescales longer than the age of the universe at . One possible solution is dust formation associated with massive star formation (Stratta et al. 2007; Maiolino et al. 2004; Venkatesan, Nath, & Shull 2006; Dwek et al. 2007).
Such early coeval formation of galaxies and SMBHs has interesting implications on the interpretation of the cosmic Stromgren spheres around high redshift quasars, as inferred from the Gunn-Peterson absorption spectra (Fan et al. 2006b). Masseli et al. (2007) and Lidz et al. (2007) point out that, over the lifetime of the system, the integrated star formation and AGN emission may contribute roughly equally to the reionization of the regions immediately surrounding the quasar host galaxy.
The detection of the gas reservoir required to fuel star formation in the J0927+2001 quasar host galaxy is a key step in studying the formation of massive galaxies at very high redshift, but clearly further detailed observations are required to probe the host galaxy and SMBH formation in this system. Critical diagnostic observations include: imaging of the CO dynamics to constrain the galaxy gravitational mass, and hence the black hole mass – bulge mass relation at high z (Shields et al. 2006; Walter et al. 2004), multiwavelength imaging of the dust to help constrain dust heating mechanisms, studies of lower order CO lines to determine gas excitation and total gas mass (Bertoldi et al. 2004), detection of higher density gas tracers, such as HCN, to determine the total mass of gas directly associated with star forming clouds (Gao et al. 2007; Krumholz & Thompson 2007), and detection of the interstellar gas cooling lines, such as [CII] (Maiolino et al. 2005; Iono et al. 2006). The CO detection presented herein provides an accurate redshift for the host galaxy as well as direct evidence for a highly developed ISM, and hence is the first crucial step for future studies. For extreme luminosity objects such as 0927+2001, many of these studies can be performed with long integration times on current instruments, such as the Plateau de Bure Interferometer and Very Large Array. It will take the Atacama Large Millimeter Array, with its more than an order of magnitude increase in sensitivity relative to current millimeter interferometers, to perform similar studies on less extreme systems, such as the Ly- galaxies at .
References
- (1) Beelen, A., Cox, P., Benford, D. et al. 2006, ApJ, 642, 694
- (2) Bertoldi, F., Carilli, C. L., Cox, P. et al. 2003a, A& A, 406, L55
- (3) Bertoldi, F., Cox, P., Neri, R. et al. 2003b, A& A, 409, L47
- (4) Bradford, C.M., Nikola, T., Stacey, G., Bolatto, A., Jackson, J.M. et al. 2003, ApJ, 586, 891
- (5) Carilli, C. L., Walter, F., Bertoldi, F. et al. 2004, AJ, 128, 997
- (6) Carilli, C.L., Kohno, K., Kawabe, R. et al. 2002, AJ, 123, 1838
- (7) Carilli, C.L. & Wang, R. 2006, AJ, 131, 2763
- (8) Downes, D. & Solomon, P. 1998, ApJ, 507, 615
- (9) Dwek, E., Galliano, F., Jones, A. 2007, ApJ, 662, 927
- (10) Fan, X., Strauss, M. A., Richards, G. T. et al. 2006a, AJ, 131, 1203
- (11) Fan, X., Strauss, M. A., Becker, R. H. et al. 2006b, AJ, 132, 117
- (12) Fan, X., Carilli, C.L., Keating, B. 2006, ARAA, 44, 415
- (13) Ferrarese, L., & Merritt, D. 2000, ApJ, 539, L9
- (14) Gao, Y., Carilli, C.L., Solomon, P., Vanden Bout, P. 2007, ApJ, 660, L93
- (15) Gao, Y. & Solomon, P. 2004, ApJ, 606, 271
- (16) Greve, T., Bertoldi, F., Smail, I. et al. 2005, MNRAS, 359, 1165
- (17) Greve, T., Papadopoulos, P., Gao, Y., Radford, S. 2006, ApJ, in press
- (18) Gebhardt, K., Bender, R., Bower, G. 2000, ApJ, 539, 13
- (19) Iono, D., Yun, M.S., Elvis, M. et al. 2006, ApJ, 645, L97
- (20) Jiang, Linhua et al. 2007, AJ, submitted
- (21) Kennicutt, R. 1998, ARAA, 36, 189
- (22) Krumholz, M.R. & Thompson, T.A. 2007, ApJ, submitted (astro-ph/0704.0792)
- (23) Li, Y., Hopkins, P., Herquist, L. et al. 2007a, ApJ, submitted (astrop/0706.3706)
- (24) Li, Y., Herquist, L., Robertson, B. et al. 2007b, ApJ, in press (astrop/0608.190)
- (25) Lidz, A., McQuinn, M., Zaldarriaga, M., Hernquist, L., Dutta, S. 2007, ApJ, submitted (astro-ph/0703667)
- (26) Magorrian, J., Tremaine, S., Richstone, D. et al. 1998, AJ, 115, 2285
- (27) Maiolino, R., Cox, P., Caselli, P. et al. 2005, A& A, 440, L51
- (28) Maiolimo, R., Schneider, R., Oliva, E., Bianchi, S., Ferrara, A. et al. 2004, Nature, 431, 533
- (29) Masseli, A., Gallerani, S., Ferrara, A., Choudhury, T. 2007, MNRAS, 376, L34
- (30) Omont, A., Beelen, A., Bertoldi, F. et al. 2003, A& A, 398, 657
- (31) Petric, A. O., Carilli, C. L., Bertoldi, F. et al. 2003, AJ, 126, 15
- (32) Shen, Yue, Strauss, Michael A., Oguri, M., Hennawi, J., Fan, X. et al. 2007, AJ, 133, 2222
- (33) Shields, G.A., Menezes, K., Massart, C., Vanden Bout, P. 2006, ApJ, 641, 683
- (34) Solomon, P. & Vanden Bout, P. 2005, ARAA, 43, 677
- (35) Solomon, P., Radford, S., Downes, D., Barrett, J. 1997, ApJ, 478, 144
- (36) Stratta, G, Maiolino, R., Fiore, F., D’Elia, V. 2007, ApJ, 661, L9
- (37) Venkatesan, Aparna, Nath, Biman B., Shull, J. Michael 2006, ApJ, 640, 31
- (38) Walter, F., Bertoldi, F., Carilli, C. L. et al. 2003, Nature, 424, 406
- (39) Walter, F., Carilli, C. L., Bertoldi, F. et al. 2004, ApJ, 615, L17
- (40) Wang, R., Carilli, C. L., Bertoldi, F. et al. 2007a, AJ, 134, 617
- (41) York, D. G., Adelman, J., Anderson, J. E. et al. 2000, AJ, 120, 1579
| Transition | Continuum | Line Peak | FWHM | I | |
|---|---|---|---|---|---|
| mJy | mJy | km s-1 | Jy km s-1 | K km s-1 pc2 | |
| 5-4 | |||||
| 6-5 |