Crystal structure, Fermi surface calculations and
Shubnikov-de Haas oscillations spectrum of the organic
metal -(BETS)4HgBr4(C6H5Cl) at low
temperature
Abstract
The organic metal -(BETS)4HgBr4(C6H5Cl) is known to undergo a phase transition as the temperature is lowered down to about 240 K. X-ray data obtained at 200 K indicate a corresponding modification of the crystal structure, the symmetry of which is lowered from quadratic to monoclinic. In addition, two different types of cation layers are observed in the unit cell. The Fermi surface (FS), which can be regarded as a network of compensated electron and hole orbits according to band structure calculations at room temperature, turns to a set of two alternating linear chains of orbits at low temperature. The field and temperature dependence of the Shubnikov-de Haas oscillations spectrum have been studied up to 54 T. Eight frequencies are observed which, in any case, points to a FS much more complex than predicted by band structure calculations at room temperature, even though some of the observed Fourier components might be ascribed to magnetic breakdown or frequency mixing. The obtained spectrum could result from either an interaction between the FS’s linked to each of the two cation layers or to an eventual additional phase transition in the temperature range below 200 K.
pacs:
71.18.+y Fermi surface: calculations and measurements; effective mass, g factor71.20.Rv Polymers and organic compounds
72.20.My Galvanomagnetic and other magnetotransport effects
Electronic address: audouard@lncmp.org
I Introduction
In high enough magnetic fields, the Fermi surface (FS) of many quasi-two-dimensional (q-2D) organic metals is liable to give rise to networks of orbits coupled by magnetic breakdown (MB) Ka04 (1). Magnetic oscillations spectra of such compounds often contain Fourier components of which the frequencies are linear combinations of few basic frequencies. Some of these components correspond to MB-induced closed orbits that are accounted for by the semi-classical model of Falicov and Stachowiak Fa66 (2). In the case of Shubnikov-de Haas (SdH) oscillations, quantum interference (QI) paths St71 (3) have also been invoked. However, the so called ”forbidden frequencies” observed in the de Haas-van Alphen spectra of organic metals that illustrate the linear chain of coupled orbits model by Pippard Pi62 (4) cannot be interpreted on these bases. Indeed, they are rather attributed to frequency mixing due to the oscillation of the chemical potential mu (5) and (or) to the MB-induced modulation of the density of states Pi62 (4, 6) even though the respective influence of these two contributions remains to be determined.
Another type of network is provided by the family of organic metals (BEDT-TTF)8Hg4Cl12(C6H5X)2 (X = Cl, Br) whose FS, which originates from two pairs of crossing q-1D sheets, is composed of one electron and one hole tube with the same area Ve94 (7). As it is the case of the above-mentioned linear chains of coupled orbits, SdH oscillations spectra in this type of network also reveal frequency mixing Pr02 (8, 9, 10). However, in striking contrast to the data relevant to linear chains of orbits, all the Fourier components observed in the de Haas-van Alphen oscillations spectra can be consistently interpreted on the basis of the model of Falicov and Stachowiak Au05 (10). It is thus of primary importance, from the viewpoint of the quantum oscillation physics, to check whether or not the above mentioned behaviour is observed in other organic metals whose FS can be regarded as networks of compensated orbits. Such networks can also be realized in organic metals of which the FS originates from the overlapping in two (or more) directions of hole tubes with an area equal to that of the First Brillouin zone (FBZ) and from the resulting gap openings Ro04 (11). According to band structure calculations, this is the case of organic metals such as (BEDO-TTF)4ReO4H2O Kh98 (12) and -(BEDT-TTF)4(NH4)[M(C2O4)3]DMF (M = Fe, Cr) Pr03 (13). However, SdH oscillations spectra of these compounds did not yield frequency combinations in a field range large enough in order to perform a reliable analysis of the relevant data Pr01 (14, 15, 16).
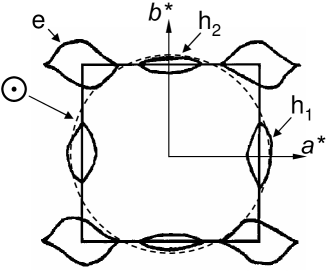
According to band structure calculations based on room temperature X-ray data Ly01 (17), the FS of the q-2D organic metal -(BETS)4HgBr4(C6H5Cl) is composed of two hole and one electron tubes (see Fig. 1). Since the electron- and hole-type tubes are compensated, the FS should yield the same kind of network as above discussed. However, a phase transition is observed around 240 K which is liable to modify the FS. As a matter of fact, the SdH oscillations spectra recorded in the field range below 15 T only exhibit two frequencies at 40 T and 210 T Ly01 (17) which is not in agreement with the FS calculations at room temperature. The aim of this article is therefore twofold. In a first step, crystal and electronic band structures based on X-ray data collected at a temperature below the phase transition, namely 200 K, are reported and, in a second step, the SdH oscillations spectrum is explored in the high field range in order to reveal other possible frequencies.
II Experimental
The crystals studied were synthesized by the electrocrystallization technique reported in Ref. Ly01 (17). Their approximate dimensions were 0.4 0.15 0.1 mm3 for X-ray diffraction experiments and 1.5 1.0 0.1 mm3 for magnetoresistance measurements.
Diffraction measurements were performed at a temperature of 200 K with a P4 Bruker AXS diffractometer ((Mo K) = 0.71073 , /2 scanning). The main crystallographic data are: (C10H8S4Se4)4HgBr4-C6H5Cl, monoclinic, space group Cc, a = 13.678(3) , b = 75.857(16) , c = 9.533(2) , V = 7128(3) , = 133.89∘, Z = 4, dcal = 2.723 g cm-3, F(000) = 5400. The unit cell parameters were determined and refined using 35 reflections in the range 5 20∘. Within a set of 6531 X-ray reflections taken in the interval 0 50∘, 4213 crystallographically independent ones had intensities I 2(I). The structure was solved by a direct method. The positions of non-carbon atoms were refined in the anisotropic approximation by the full-matrix least square method. The positions of carbon atoms were refined in the isotropic approximation only. The positions of the atoms belonging to the C6H5Cl solvent molecule were revealed from difference Fourier syntheses and refined within the isotropic approximation with restrictions imposed on the bond lengths. The positions of the hydrogen atoms cannot be revealed by the difference Fourier syntheses. The structure was refined from the independent reflections with I 2(I), using the SHELXL-97 program package to R1 = 0.1235. It should be noticed that as the temperature decreases the above mentioned phase transition yields, at a macroscopic level, lower quality single crystals. More specifically, the X-ray peaks broadened, some of them split, i.e. a single crystal become twinned, that prevents reliable X-ray experiments. For one of the slowly cooled single crystals studied, the contribution of one of the twin components was higher than that of the other one after the phase transition. It should be noted that this crystal was far from being an ideal one which justifies the poor R1 value above mentioned. The obtained experimental massif of reflections was somewhat distorted because of the low quality that was manifested in the structure refinement parameters and did not allow for a high resolution of the molecular structure because of significant uncertainties in the determination of interatomic distances and angles. Nevertheless, we were able to perform the X-ray experiments in corpore. In addition, as developed in Section III.2, clear quantum oscillations are observed.
The tight-binding band structure calculations were based upon the effective one-electron Hamiltonian of the extended Hückel method Wh78 (18). The off-diagonal matrix elements of the Hamiltonian were calculated according to the modified Wolfsberg-Helmholz formula Am78 (19). All valence electrons were explicitly taken into account in the calculations and the basis set consisted of double- Slater-type orbitals for C, S and Se and single- Slater-type orbitals for H. The exponents, contraction coefficients and atomic parameters for C, S, Se and H were taken from previous works Pe90 (20, 21).
Two crystals, labelled and in the following, were studied in pulsed magnetic fields in the temperature range from 1.6 K to 4.2 K. The maximum field and pulse decay duration were 54 T, 0.32 s and 36 T, 1 s for crystal and , respectively. Electrical contacts to the crystals were made using annealed platinum wires of 20 m in diameter glued with graphite paste. A one-axis rotating sample holder allowed to change the direction of the magnetic field with respect to the crystallographic axes for crystal . Alternating current (1A, 77 Hz and 5 A, 20-50 kHz for zero-field and magnetoresistance measurements, respectively) was injected parallel to the b direction (interlayer configuration). A lock-in amplifier with a time constant of 100 ms and 100 s for zero-field resistance and magnetoresistance measurements, respectively, was used to detect the signal across the potential contacts. In the following, the absolute value of the amplitude of the magnetoresistance oscillations is obtained through discrete Fourier transforms calculated with a Blackman window.
III Results and discussion
III.1 Crystal and electronic band structures
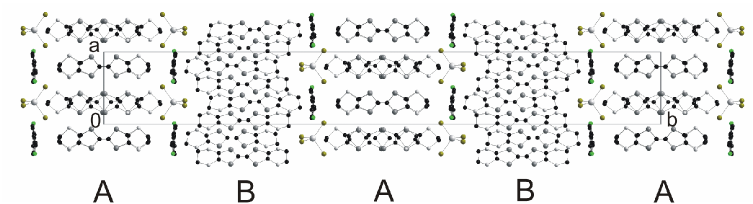
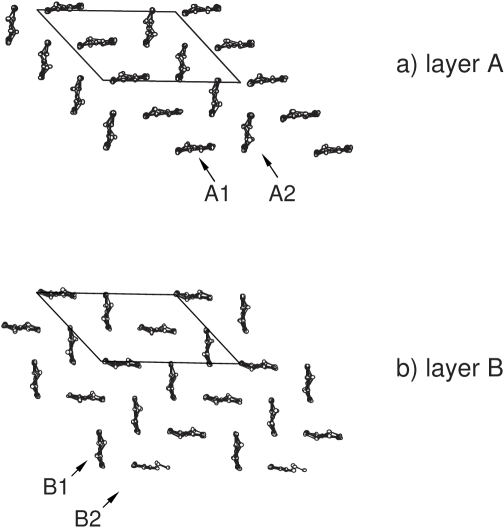
The independent part of the crystal structure involves four BETS molecules, one HgBr ion and one solvent molecule which can occupy two sites with a probability of 50 for each of them. Fig. 2 displays the projection of the crystal structure on the ab plane. As it is the case at room temperature, the unit cell contains four radical cation layers, between which are located the HgBr ions and the solvent (C6H5Cl) molecules. In contrast with the room temperature data Ly01 (17), two different kinds of cation layers, referred to as A and B in the following, are evidenced at 200 K (see Figs. 2 and 3). Each of the two cation layers, which are both of the -type, are composed of two different stacks labelled A1 (B1) and A2 (B2) in layer A (B). The angle between the average planes of cations A1 and A2 is 71.6∘ while the angle between B1 and B2 is 78.0∘. At room temperature, this angle gets an intermediate value of 73.9∘ Ly01 (17). The radical cation layers also differ in the number of S…S, S…Se and Se…Se contacts shorter than the sum of the van der Waals radii, which is larger in layer A than in layer B. In summary, the phase transition around 240 K corresponds to a degradation of the crystallographic order. In addition, the solvent molecules can occupy two different sites, as above mentioned. As a result, the degree of disorder increases as the temperature is lowered below the phase transition, as already reported in Ref. Ly01 (17).
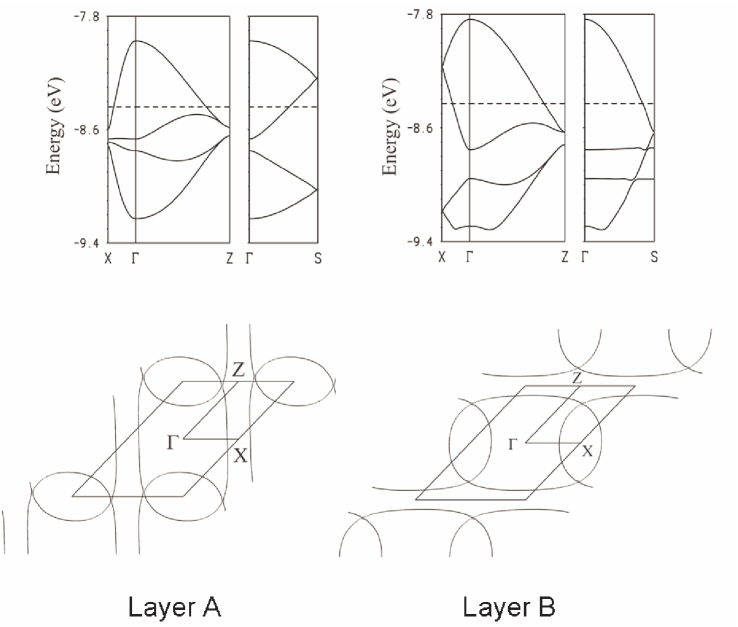
The calculated electronic band structures and FS’s corresponding to layers A and B are reported in Fig. 4. There are four donors per repeat unit of the layers so that the band structures contain four bands mainly built from the HOMO (highest occupied molecular orbital) of the donors. Since the average charge of the donors is these bands should house two holes. The two FS’s are almost identical but turned approximately by 90∘. These FS’s can be seen as resulting from the superposition (and hybridization) of a closed loop which, as for usual phases Mo99 (22), may be described either as a rounded rectangle or as an elongated ellipse. The result is a Fermi surface containing closed and open portions with very small hybridization gaps. From the viewpoint of the resulting orbits network, both of them can be regarded as a linear chain of coupled orbits, roughly turned around by 90∘ from each other. This picture is strongly different from the FS deduced from calculations at room temperature which yields a network of compensated electron and holes orbits, as displayed in Fig. 1. The area of the closed part of the FS at low temperature, which correspond to the so called orbit, is equal to 22.9 and 19.6 of the FBZ area for layers A and B, respectively. The area of the orbit which can be recovered by MB is equal to that of the FBZ for both layers.
III.2 SdH oscillations
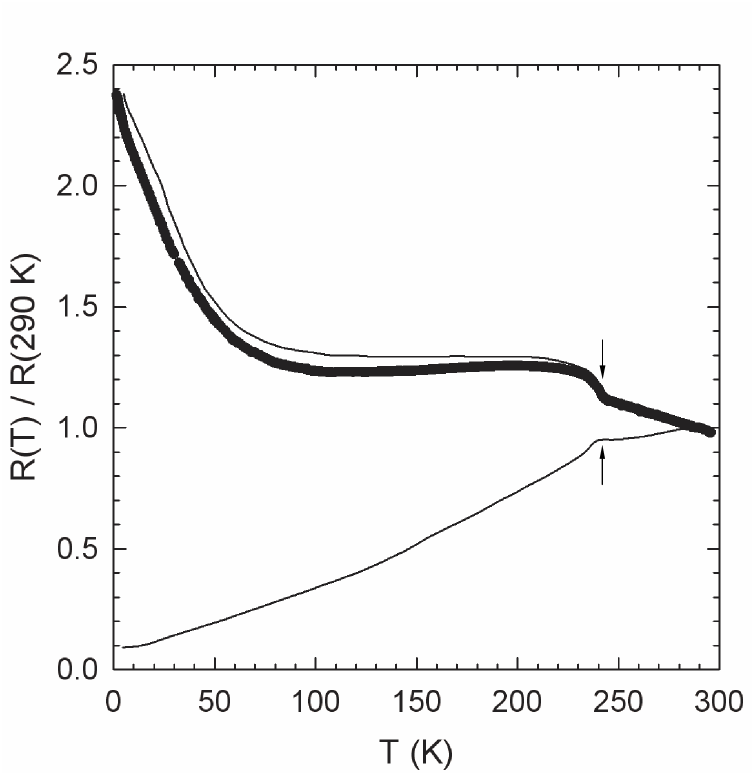
Interlayer zero-field resistance and magnetoresistance data of the two studied crystals yield consistent results. The temperature dependence of the zero-field resistance of crystal is displayed in Fig. 5. A good agreement with data of Ref. Ly01 (17) is observed. Remarkably, the interlayer resistance exhibits a behaviour strongly different from that of the in-plane one. This behaviour has not received any interpretation up to now. Another salient feature of these data is the kink (marked by arrows in Fig. 5) which is the signature of the above discussed phase transition occurring around 240 K.
| i | Fi (T) | m | T (K) |
|---|---|---|---|
| 1 | 37 1 | 0.30 0.05 | 3.0 1.2 |
| 2 | 81.5 1.0 | 0.45 0.05 | 11 3 |
| 3 | 198 4 | 0.85 0.10 | 1.9 0.8 |
| 4 | 545 2 | 0.45 0.10 | 11 4 |
| 5 | 745 10 | 1.15 0.15 | 4.5 1.5 |
| 6 | 1270 30 | 1.2 0.2 | 11 6 |
| 7 | 2900 100 | ||
| 8 | 4200 200 | 2 | 20 |
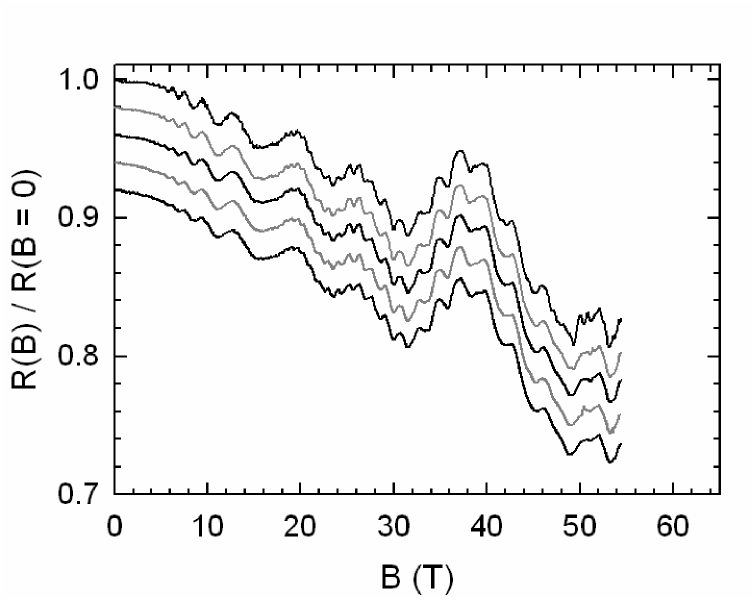
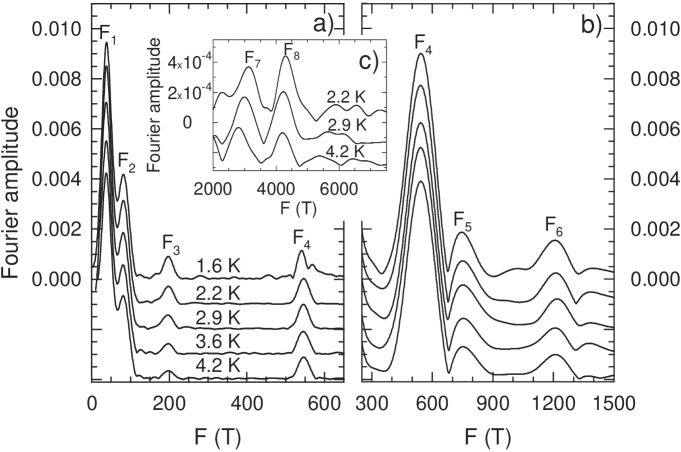
In magnetic field, the interlayer resistance decreases by about 20 (see the data of crystal in Fig. 6). This feature, which was not observed in Ref. Ly01 (17), could not be due to disorder as discussed below. Despite the increase of the disorder level as the temperature is lowered below the phase transition (see Section III.1), quantum oscillations are clearly resolved. The Fourier spectra of the oscillatory part of the magnetoresistance is displayed in Fig. 7. Numerous components can be identified, as it is observed in many networks of coupled orbits. More precisely, 8 frequencies are observed, of which the values are reported in Table 1. It can be noticed that, as already reported in Ref. Ly01 (17), only F1 and F3 can be observed below 15 T. Roughly speaking, the high frequency oscillations can only be detected at high field. In particular, the frequencies F7 and F8, which are in few cases poorly resolved, can only be observed above about 40 T. Data for crystal , which was obtained up to 36 T for various directions of the magnetic field, allow to check that the angle dependence of the frequencies F1 to F5 is consistent with a two-dimensional FS.
As discussed in Ref. Au04 (15), whatever the origin of the frequency combinations liable to be involved in an oscillatory spectrum (MB-induced closed orbits, QI paths or frequency mixing) they should be linear combinations of the frequencies linked to each of the closed orbits and of the orbit, namely F(e), F(h1) F(h2) and F(), in networks of compensated orbits such as that depicted in Fig. 1. In contrast, oscillatory spectra of linear chains of orbits only involves linear combinations of the frequencies linked to the closed and to the MB-induced orbit, the latter being the analogue of the above mentioned orbit. However, the topology of the FS displayed in Fig. 4 is more complex and the two FS linked to layer A and B should contribute to the observed oscillatory spectra.
The only observed frequency that can be attributed to the , or equivalently to the orbit, is F8 which corresponds to an orbit area of 96 5 of the FBZ area at 200 K. In the framework of the band structure calculations at room temperature, three basic frequencies F(e), F(h1) and F(h2) with areas of 6, 4 and 2 of the FBZ area, respectively, should be observed, the orbit’s compensation yielding F(e) = F(h1) + F(h2). Such a linear combination is observed in the present case since F3 + F4 = 743 6 T which is equal to F5 within the error bars. In the case where this picture is relevant, F6 which is equal to F4 + F5 (1290 12 T) could be regarded as a frequency combination. However, such analysis puts aside frequencies F1 and F2. In addition, F5 corresponds to 17 of the FBZ area. This value is much larger than predicted by the band structure calculations above mentioned. These features confirm that the FS of the compound cannot be interpreted on the basis of band structure calculations at room temperature.
In the framework of the FS calculations of Fig. 4, only F5 and (or) F6 which correspond to orbits areas of 17 and 29 , respectively, of the FBZ area could be attributed to the orbit. In such a case, F7, which is equal to F8 - F6 could correspond to one of the two QI path . However, the low frequencies F1 to F4 with areas in the range from 1 to 12 cannot be interpreted on the basis of this FS, unless additional orbits can be considered. For example, MB-like orbits induced by carriers jump from one layer to the other could account for frequencies lower than Fα. Obviously such an hypothesis requires both experimental and theoretical confirmation. The possibility of an additional phase transition at a temperature lower than 200 K, such as density wave or solvent molecules ordering, could also be considered. For instance, such a modulation could induce a folding of the FS’s resulting in additional small closed orbits accounting for the observed discrepancy between the SdH spectra and the present band structure calculations.
Let us consider now the temperature and field dependence of the Fourier components reported in Fig. 7. In the framework of the Lifshitz-Kosevich model Sh84 (23), the oscillatory part of the magnetoresistance of a 2D FS is given by:
| (1) |
where is a phase factor. The amplitude of the Fourier component with frequency Fi is given by Ai RTiRDiRMBiRSi. The thermal, Dingle, MB and spin damping factors are respectively given by:
| (2) | |||
| (3) | |||
| (4) | |||
| (5) |
where = 2mekB/e ( 14.69 T/K),
= g∗m/2, g∗ is the effective Landé
factor, m is the effective mass normalized to the free
electron mass me, TDi is the Dingle temperature and
B0 is the MB field which is assumed here to be the same for
all the MB junctions (this point is discussed in Ref.
Vi03 (9)). Integers and are respectively the number
of tunnelling and Bragg reflections encountered along
the path of the quasiparticle.
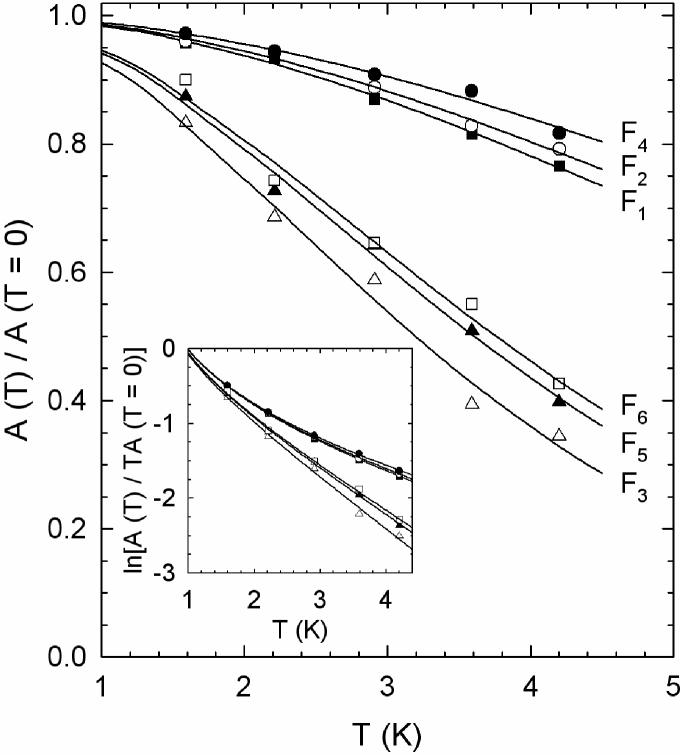
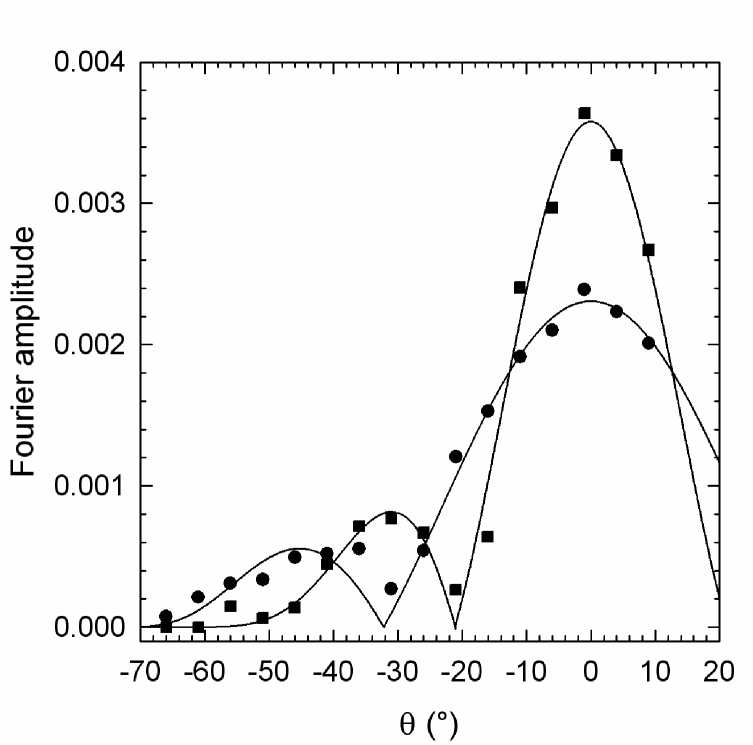
As displayed in Fig. 8, the temperature dependence of the various Fourier components observed in Fig. 7 is in agreement with the LK formalism. The deduced effective masses are reported in Table 1. It has been checked that they remain field-independent within the error bars in the range where the Fourier components are detectable. Effective masses can also be derived from the angle dependence of the oscillation amplitude which involves the spin damping factor (see Eq. 5). Examples are given in Fig. 9: a good agreement is obtained yielding values that are equal to m within the error bars. This result indicates that g∗ is close to 2 which is in line with a Fermi liquid picture. The values of the effective mass for F1 to F6 are in the range from 0.3 to about 1.2 me. Similar rather low values are also observed in various q-2D organic metals for which the frequencies involved in the SdH spectra are of the same order of magnitude. This is, in particular, the case of the family ”-(BEDT-TTF)4(NH4)[M(C2O4)3]DMF (M = Fe, Cr) of which the FS is rather complex Au04 (15, 24) as it is in the present case.
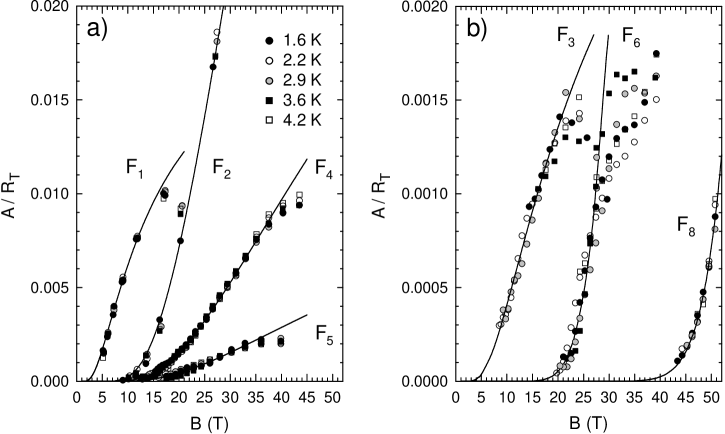
Additional information on the oscillatory spectrum can be obtained through the field dependence of the oscillations amplitude. For = 0, Eq. 1 can be rewritten as:
| (6) |
which yields the temperature-independent part of the amplitude,
provided the relevant effective mass has been determined. At low
magnetic field or in the case where bi = 0, Eq. III.2
simplifies as Ai / R
exp[-(TDim + tiB0/2)/B]. In the case
where ti = 0, i. e. for a basic orbit, the field dependence of
Ai / RTi yields the Dingle temperature, as usual. In
contrast, in the case where ti 0, only an apparent
Dingle temperature, higher than TDi, can be derived
(T = TDi + tiB0/2m). The field
dependence of Ai / RTi is displayed in Fig.
10 for various Fourier components. It can be
remarked first that, in agreement with the predictions of Eq.
III.2, this parameter is actually
temperature-independent, at least in the low field range. Solid
lines in this figure are best fits to the data assuming bi = 0
which actually holds in the low field range as above discussed.
The deduced values of T (see Table 1) are very
disparate. It should be noticed that the set of values obtained
for crystal is in good agreement with the data of Table
1. Furthermore, a re-analysis of the low field data of
Ref. Ly01 (17) yields T 4 K which is close to,
and in any case not lower than, the present data. This result
suggests that the negative magnetoresistance observed in Fig
6 could not be due to disorder. Downward deviations
of the data from the fittings of Fig. 10, that could
be due to Bragg reflections (in which case b 0) are
observed at high field for some of the Fourier components. The
very high values of T observed for F2, F4, F6
and F8 could indeed be the signature of MB. This should be in
particular the case of F8 in the case where it actually
corresponds to the large orbit from which the FS is built. In line
with this assumption, it is tempting to consider that F1, F3
and F5 correspond to basic orbits. However, the field
dependence of the amplitude of Fourier components corresponding to
MB orbits can be strongly influenced by the frequency mixing
phenomenon Pr02 (8, 9, 10) which hampers any definite
conclusion in the absence of reliable FS determination at low
temperature. Nevertheless, it is plausible that some of the
observed Fourier components correspond to MB and (or) frequency
mixing. In addition, the occurrence of a new type of MB-like
quantum oscillation linked to the considered non-trivial FS cannot
be excluded, although this latter hypothesis requires both
experimental and theoretical confirmation.
IV Summary and Conclusion
The crystal and electronic band structures of the organic metal -(BETS)4HgBr4(C6H5Cl) have been determined at a temperature of 200 K, i. e. below the phase transition which occurs at about 240 K. X-ray data indicate a modification of the crystal structure the symmetry of which is lowered from quadratic to monoclinic. Strikingly, two different types of cation layers which alternate in the direction perpendicular to the conducting plane are observed. The resulting non-trivial Fermi surface (FS), which can be regarded as a network of compensated electron and hole orbits according to band structure calculations at room temperature, turns to a set of two alternating linear chain of orbits at low temperature.
The SdH oscillations spectra measured up to 54 T reveal eight Fourier components. Their temperature and field (both magnitude and orientation) dependence are in good agreement with the LK formalism. Owing to their field dependence, it is likely that some of the observed Fourier components correspond to either MB orbits or frequency mixing. In any case, the oscillatory data suggest a complex FS that is not in agreement with band structure calculations at room temperature. Band structure calculations at 200 K cannot fully account for the data either, unless additional MB-like orbits induced by carriers jump from one layer to the other can be considered. An additional phase transition below 200 K might also be considered to be at the origin of the disagreement. More work at low temperature seems to be mandatory to fully understand the intriguing SdH oscillations spectra of the q-2D organic metal -(BETS)4HgBr4(C6H5Cl).
Acknowledgements.
This work was supported by Euromagnet under the European Union contract R113-CT-2004-506239, the CNRS-RAS cooperation agreement 16390, the CNRS-CSIC exchange program (2005FR0019), MEC-Spain (FIS2006- 12117-C04-01) and Generalitat de Catalunya (Project 2005 SGR 683). Part of the computations described in this work were carried out using the resources of CESCA and CEPBA. RBL thanks RFBR 07-02-00311 for support.References
- (1) For a review, see M. Kartsovnik, Chem. Rev. 104 5737 (2004) and references therein.
- (2) L. M. Falicov and H. Stachowiak, Phys. Rev. 147 505 (1966).
- (3) R. W. Stark and C. B. Friedberg, Phys. Rev. Lett. 26 556 (1971).
- (4) A. B. Pippard, Proc. Roy. Soc. (London) A270 1 (1962).
- (5) A. S. Alexandrov and A. M. Bratkovsky, Phys. Rev. Lett. 76 (1996) 1308; Phys. Lett. A 234 53 (1997) and Phys. Rev. B 63 033105 (2001); T. Champel, ibid. 65 153403 (2002); K. Kishigi and Y. Hasegawa, ibid. 65 205405 (2002); J. Y. Fortin, E. Perez and A. Audouard, ibid. 71 (2005) 155101.
- (6) P. S. Sandhu, J. H. Kim and J. S. Brooks, Phys. Rev. B 56 11566 (1997); J. Y. Fortin and T. Ziman, Phys. Rev. Lett. 80 3117 (1998); V. M. Gvozdikov, Yu V. Pershin, E. Steep, A. G. M. Jansen and P. Wyder, Phys. Rev. B 65 165102 (2002).
- (7) L. F. Veiros and E. Canadell, J. Phys. I France 4 939 (1994).
- (8) C. Proust, A. Audouard, L. Brossard, S. I. Pesotskii, R. B. Lyubovskii and R. N. Lyubovskaia, Phys. Rev. B 65 155106 (2002).
- (9) D. Vignolles, A. Audouard, L. Brossard, S. I. Pesotskii, R. B. Lyubovskii, M. Nardone, E.Haanappel and R. N. Lyubovskaya, Eur. Phys. J. B, 31 53 (2003).
- (10) A. Audouard, D. Vignolles, E. Haanappel, I. Sheikin, R. B. Lyubovskiĭ and R. N. Lyubovskaya, Europhys. Lett. 71 783 (2005).
- (11) R. Rousseau, M. Gener and E. Canadell, Adv. Func. Mater. 14, 201 (2004).
- (12) S. S. Khasanov, B. Zh. Narymbetov, L. V. Zorina, L. P. Rozenberg, R. P. Shibaeva, N. D. Kushch, E. B. Yagubskii, R. Rousseau and E. Canadell, Eur. Phys. J. B 1 419 (1998).
- (13) T. G. Prokhorova, S. S. Khasanov, L. V. Zorina, L. I. Buravov, V. A. Tkacheva, A. A. Baskakov, R. B. Morgunov, M. Gener, E. Canadell, R. P. Shibaeva and E. B. Yagubskii, Adv. Funct. Mater. 13 403 (2003).
- (14) C. Proust, A. Audouard, V. N. Laukhin, L. Brossard, M. Honold,M. S. Nam, E. Haanappel, J. Singleton and N. D.Kushch, Eur. Phys. J. B 21 31 (2001).
- (15) A. Audouard, V. N. Laukhin, L. Brossard, T. G. Prokhorova, E. B. Yagubskii and E. Canadell, Phys. Rev. B 69 144523 (2004).
- (16) A. Audouard, V. N. Laukhin, J. Béard, D. Vignolles, M. Nardone, E. Canadell, and T. G. Prokhorova and E. B. Yagubskii, Phys. Rev. B 74 233104 (2006).
- (17) R. B. Lyubovskii, S. I. Pesotskii, S. V. Konovalikhin, G. V. Shilov, A. Kobayashi, H. Kobayashi, V. I. Nizhankovskii, J. A. A. J. Perenboom, O. A. Bogdanova, E. I. Zhilyaeva and R. N. Lyubovskaya, Synth. Met. 123 149 (2001).
- (18) M.-H. Whangbo and R. Hoffmann, J. Am. Chem. Soc. 100 6093 (1978).
- (19) J. Ammeter, H.-B. Bürgi, J. Thibeault and R. Hoffmann, J. Am. Chem. Soc. 100 3686 (1978).
- (20) A. Pénicaud, P. Batail, P. Davidson, A. M. Levelut, E. Canadell, and C. Perrin, Chem. Mater. 2 123 (1990).
- (21) A. Pénicaud, K. Boubekeur, P. Batail, E. Canadell, P. Auban-Senzier and D. Jérome, J. Am. Chem. Soc. 115 4101 (1993).
- (22) T. Mori, H. Mori and S. Tanaka, Bull. Chem. Soc. Jap. 72 179 (1999).
- (23) D. Shoenberg, Magnetic Oscillations in Metals (Cambridge University Press, Cambridge, (1984).
- (24) D. Vignolles, V. N. Laukhin, A. Audouard, T. G. Prokhorova, E. B. Yagubskii and E. Canadell, Eur. Phys. J. B 51 53 (2006).