Vibrational energy relaxation (VER) of isotopically labeled amide I modes in cytochrome c: Theoretical investigation of VER rates and pathways
Abstract
Using a time-dependent perturbation theory, vibrational energy relaxation (VER) of isotopically labeled amide I modes in cytochrome c solvated with water is investigated. Contributions to the VER are decomposed into two contributions from the protein and water. The VER pathways are visualized using radial and angular excitation functions for resonant normal modes. Key differences of VER among different amide I modes are demonstrated, leading to a detailed picture of the spatial anisotropy of the VER. The results support the experimental observation that amide I modes in proteins relax with sub picosecond timescales, while the relaxation mechanism turns out to be sensitive to the environment of the amide I mode.
I Introduction
Amide I vibrational modes in proteins or peptides are localized around the peptide backbone and can be a sensitive probe of protein structure and dynamics. Mainly localized around the CO bond of the backbone with large oscillator strength, the amide I modes detected using infrared (IR) spectroscopy have been studied for a variety of proteins and peptides KB86 ; TT92 ; BZ02 ; SAD03 ; GHG04 . Recently 2D-IR spectroscopy TM93 ; ZH01 ; WH02 has been utilized to decipher (anharmonic) coupling between vibrational modes including the amide I mode WH06 ; Tokmakoff06 . The interpretation of the associated spectra is not necessarily simple, and will benefit from the development of increasingly accurate theoretical models IT06 ; NTM07 ; Torii07 .
Combining MD simulations with ab initio calculations, several theoretical groups have recently devised sophisticated methods to characterize the effect of inhomogeneity on the dephasing time, , of the amide I mode, using small peptides in water HHLKKC04 ; Skinnergroup ; ZAHM06 ; HJZM05 ; Stock06 . Anharmonic frequency calculations have been performed for a peptide-like molecule, N-methylacetamide (NMA), in vacuum GCG02 ; BS06 ; KB07 ; FYHS07 and in water HJZM05 . For the amide I mode of NMA in water, theoretical investigations of VER have been carried out using a quasi-classical method NS03 and a quantum mechanical perturbation method FZS06 . However, while there have been many experimental studies HLH98 ; ZAH01 ; XMHA00 of vibrational energy relaxation (VER) of amide I modes in proteins, related to , there are relatively few theoretical studies.
In this work, we study the VER properties of amide I modes in a protein, cytochrome c, in water, and clarify the VER pathways using quantum-mechanical time-dependent perturbation theory FZS06 . This is a continuation of our previous work on VER of a CD stretching mode in cytochrome c FBS05 ; Cremeens06 . The amide I modes studied were isotopically labeled according to IR experiment MKFKAZ04 ; Arkin06 . We decompose the VER rate into two components: one from the protein, and the other from water (solvent). We identify the resonant modes that contribute most significantly to the VER rate, and introduce distribution-like functions for those modes to visualize the spatial anisotropy of VER as pathways in 3-dimensional space.
This paper is organized as follows. In Sec. II, our time-dependent perturbation method is briefly described, and several methods to visualize the VER pathways in protein and water are proposed. In Sec. III, we examine the results of VER rates by comparing with the Maradudin-Fein formula, SASA, localization length, and experimental results. Furthermore, we mention the anisotropy of VER from excited amide I modes into protein as well as into water. In Sec. IV, we summarize and discuss the future extension of our work.
II Methods
II.1 VER rate formula
We briefly summarize the quantum mechanical perturbation theory employed in this work. We assume that normal mode coordinates provide a good description of the system dynamics for the observables studied. We further assume that the potential energy function can be Taylor expanded up to the 3rd and 4th order anharmonic terms with respect to normal mode coordinates including only the relaxing mode FZS06 .
| (1) | |||||
| (2) | |||||
| (3) | |||||
| (4) | |||||
| (5) |
where () is the system (bath) Hamiltonian, and () are the 3rd (4th) order coupling terms. (This is related to the three-mode representation of a quartic force field FYHS07 ; YHTSG04 .) From the von Neumann-Liouville equation, a reduced density matrix for the relaxing mode is derived using the time-dependent perturbation theory after tracing over the bath degrees of freedom. (A similar result has been derived from the path integral formulation of quantum mechanics by Okazaki and coworkers SO98 .) The Markov approximation is usually employed to derive a simplified Bloch-Redfield type equation after introducing the density of states for the bath. However, to describe the initial stage of the quantum dynamics, we do not invoke the Markov approximation. Using this approach, we are able to avoid assumptions related to the lifetimes of the vibrational modes of the bath — the so-called “linewidth problem” FBS05 used in the Markov approximation.
When the relaxing mode is excited to the state, the VER is described by the decay of the reduced density matrix element . We define the temporal VER rate as , which is approximately written as FZS06
| (6) | |||||
where , is the anharmonicity-corrected system frequency, is the bath mode (harmonic) frequency, and the coefficients are derived from the nonlinear coupling constants and FZS06 . is each component of the VER rate corresponding to modes and . We note that the first term in Eq. (6) dominates in the formula because of the resonance condition, i.e. becomes large when .
Because of non-Markovian properties, is not necessarily a constant. If the Markov assumption holds, becomes a rate constant. In the case of the amide I modes in cytochrome c, we have confirmed that a “VER rate” can be defined as a time average of after a certain transient time
| (7) |
using ps and ps. With this procedure, the averaged VER time is obtained as . The final rate formula is similar to the Maradudin-Fein (MF) formula FBS05 ; Leitner05 , and both formulas lead to a rate. An essential difference is that we avoid invoking the Markov approximation and introducing the phenomenological linewidth parameter. However, the MF formula has been widely employed in the literature FBS05 ; Leitner05 , and it would be interesting to examine the usefulness of the MF formula based on our formula. Hence we introduce the MF rate as
| (8) |
where is the linewidth parameter which will be discussed below.
II.2 Analysis of VER pathways
As shown in Eq. (7), the VER rate can be decomposed into components . This result allows us to examine which modes (combination) contribute significantly to the VER rate. To develop a detailed picture of VER in a complex molecular system, we utilize the normal mode eigenvectors which satisfy
| (9) |
where () represents the normal mode index (Cartesian coordinate index) and is the mass-weighted Hessian matrix.
We first introduce the localization length of the normal mode SS01 ; DK05
| (10) |
which measures how a normal mode extends in a system in terms of the number of atoms. This measure (also called inverse participation ratio) is used to quantify the localization of the amide I modes.
We are interested in evaluating contributions from protein and water to the value and mechanism of VER. We assign modes to water (protein) if the condition () is satisfied. Here means that the summation is taken only for water (protein) degrees of freedom. Hence can be decomposed into the (1) protein-protein contribution (if and ), (2) protein-water contribution (if and ), and (3) water-water contribution (if and ).
We next introduce radial and angular excitation distribution functions for each normal mode as
| (11) | |||||
| (12) |
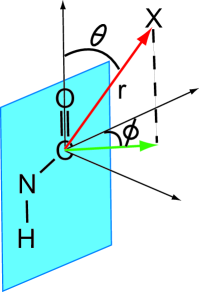
where and are the bins for the radial direction (whose median is ) and the bins for the cubic angle (whose median is ), respectively (see Fig. 1). The summation is only taken over these bins. We refer to and as excitation distribution functions because they represent coarse-grained spatial information about the excitation of a normal mode.
Note that these are different from the ordinary distribution functions (the absolute value does not have physical meaning), and are not directly related to experimental observables (such as neutron scattering functions). These functions are specifically introduced for visualizing the VER pathways. Other approaches are possible. For example, Dijkstra and Knoester visualized normal modes of -hairpin and -sheet peptides using a color map in their analysis of IR and 2D-IR spectra DK05 .
We define the average excitation distribution functions for resonant modes as
| (13) | |||||
| (14) |
where indicates that the summation is taken only for resonant modes, meaning those modes with . is the number of such resonant modes. We took ps-1 for purposes of illustration. As indicated in Eq. (6), when a system mode is excited, the excess energy mainly flows to resonant (bath) modes and via Fermi resonance (). We can explore the spatial content of such resonant modes using the excitation distribution functions.
Sagnella and Straub introduced another way to visualize anisotropy of energy flow in a protein SS01 , and the differences are (1) we consider quantum mechanical energy flow whereas their calculation is classical, and (2) we employ the resonant normal modes whereas they used excess kinetic energies as the definition of the energy flow pathway. Okamoto and Nagaoka utilized an approach derived from hydrodynamics to visualize the anisotropic energy flow from a diatomic molecule in water ON05 , though their work is also based on classical mechanics. Much similar to the present work is that by Mikami and Okazaki who devised a strategy for analyzing anisotropy of energy flow using quantum mechanics MO03 , but the method is tailored for VER problems of a diatomic molecule. In this work, we take the naive approach described above to visualize resonant normal modes.
II.3 Numerical procedure
We used CHARMM CHARMM to construct and simulate the system consisting of cytochrome c and solvent water. CHARMM facilities were utilized to calculate dynamics, normal modes, solvent accessible surface area (SASA) etc., and the computational details have been presented elsewhere BS03 . After equilibration, a 100 ps trajectory was generated and configurations were saved every 1 ps. From the 100 sample configurations, we calculated the VER rate using Eq. (7) and the results were averaged.
Application of our formula starts from the decomposition of the system Hamiltonian using normal modes as in Eq. (1). However, computation of normal modes for the full system is prohibitive. Hence we take a reduced system strategy: We deleted all atoms except those in a spherical region (see Fig. 1) where Å FZS06 . For the reduced system, we computed the anharmonic coefficients using a finite difference approximation FBS05 and the normal mode frequencies using instantaneous normal mode analysis NS03 ; Stratt95 (imaginary frequencies are neglected). The summation in Eq. (7) was taken only for the bath modes with , where we used cm-1 as the frequency cutoff. This is a reasonable approximation, as we have observed that the low frequency modes do not contribute significantly to the VER rate.
III Results and discussions
III.1 Protein and water contribution to VER rate
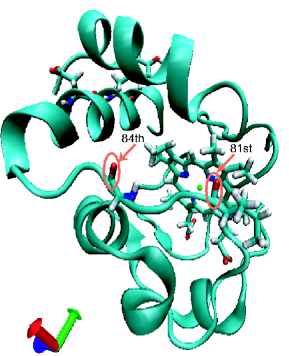
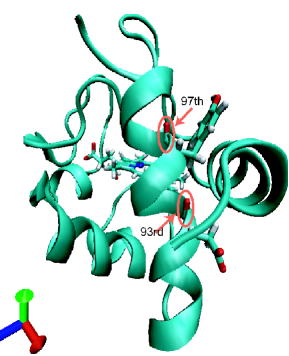
We isotopically labeled four residues: 81st, 84th, 93rd, and 97th (see Fig. 2). The first two belong to a loop region of cytochrome c whereas the latter two to a helical region. By examing SASA (Table 1), we see that the CO atoms of the 84th residue is most exposed to solvent whereas those of the 97th residue is most buried in the protein.
| Residue | IPR | SASA(CO) | |||||
|---|---|---|---|---|---|---|---|
| 81st | 2.29 (0.03) | 0.95 (0.02) | 1.21 (0.02) | 0.13 (0.00) | 2.24 (0.03) | 9.54 (1.03) | 80 |
| 84th | 2.36 (0.03) | 0.99 (0.02) | 1.31 (0.03) | 0.06 (0.00) | 2.29 (0.04) | 8.26 (0.95) | 100 |
| 93rd | 2.27 (0.03) | 1.18 (0.02) | 1.05 (0.02) | 0.04 (0.00) | 2.24 (0.03) | 3.92 (0.03) | 90 |
| 97th | 1.75 (0.03) | 1.46 (0.03) | 0.30 (0.01) | 0.00 (0.00) | 1.82 (0.03) | 4.71 (0.13) | 70 |
In Table 1, we observe that the VER rates are ps-1 ( ps) for all the cases. This is similar to the VER rate of the amide I mode of N-methylacetamide in heavy water ( ps-1) FZS06 though the 97th residue has a slightly slower rate. It is interesting to note that the MF formula Eq. (8) gives rather “accurate” values with an appropriate linewidth parameter cm-1. This result seems to validate the use of the MF formula and to indicate that the MF formula is sufficient to describe VER. However, note that an appropriate value of the linewidth parameter can not be determined in advance.
Looking into the contributions from protein and water, we observe that the protein-water contribution is significantly less for the 97th residue compared to other residues (81st, 84th, and 93rd). This is because the water less surrounds the CO bond in this case (see Fig. 2) as quantified by SASA for the CO bond (see Table 1). There seems to be a correlation between SASA and . However, as shown below, the water motion 8 Å away from the CO bond can be involved in the VER processes. Hence the interpretation is not so simple.
We also investigate this point in terms of the localization length Eq. (10) for the amide I modes. The amide I mode is expected to be localized on a CO bond only but this is necessarily the case as shown in Table 1. For the four residues we examined here, the amide I mode extends over from 4 to 10 atoms. For more delocalized modes, the protein-water or water-water contributions are expected to be large because there are more contact with water. However, this expectation is not validated in a strict sense as shown in Table 1. We know that the Fermi resonance parameter FYHS07 ; Cremeens06 can strictly describe the VER pathways in molecules, but for the present system it is difficult to interpret the result based on some chemical intuition.
Note that the protein-protein contributions for the 81st, 84th, and 93rd residues are smaller than that for the 97th residue. However, due to the protein-water contribution, the VER rates of the former three amide I modes are faster than the latter. We conclude that VER of the former amide I modes is protein-mediated, whereas that of the latter residue is water-mediated, which should have some experimental consequences as mentioned below.
How do our calculated VER rates obtained in this theoretical study compare with experimentally derived values? Hochstrasser and coworkers obtained sub-picosecond VER time scales for amide I modes in several proteins HLH98 ; ZAH01 . Zanni and coworkers also observed sub-picosecond VER time scales for isotopically labeled amide I modes in a membrane protein MKFKAZ04 . The experimentally derived VER times are comparable to our theoretical results (sub picosecond). However note that although the total VER rates are similar, the physical mechanism is sensitive to the specific structural environment of the amide I mode as discussed above (Table 1). Using multidimensional spectroscopy ZH01 ; WH02 ; HLH98 ; ZAH01 ; MKFKAZ04 , it should be possible to discriminate the protein and water contributions to VER separately in experiment.
We have recently studied the solvent effects on heme cooling in myoglobin ZFS07 . We found that the mechanism for VER is dependent on resonance as well as structural anisotropy that modulates mode coupling. It will be interesting to investigate the solvent effects on VER of amide I modes by changing the nature of the solvent within the quantum mechanical perturbation theory (while the previous work ZFS07 is based on classical mechanics).
III.2 Visualization of VER pathways
We have used the previously defined excitation functions Eqs. (13) and (14) to scrutinize the spatial anisotropy of the VER pathways. The radial excitation function in Fig. 3 shows each (protein or water) contribution to VER pathways along the radial direction. The peaks around Å correspond to the nearest neighbor intramolecular pathways involving the motion of the NH bond (see Fig. 1). Since the density of the protein has a peak around Å , the radial excitation function also has a peak or shoulder around at the same location.
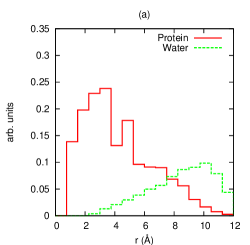
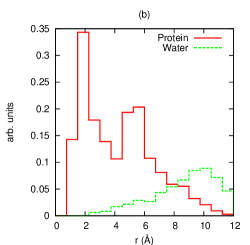
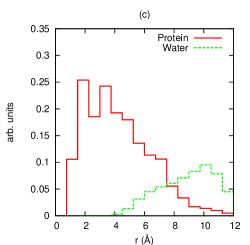
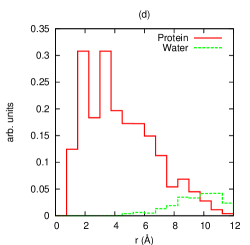
Looking at the water contributions, we found that the excitation functions have significant values at large distances ( Å), indicating that VER is mediated by distant water molecules. On the other hand, Mikami and Okazaki found that only the water molecules of the first solvation shell contribute to VER in the case of a solvated diatomic molecule MO03 . We note that there are significant differences between the relaxation of an amide I mode in a protein and of a solvated diatomic molecule. For VER (or energy transfer) to occur, the overlap of resonant normal modes is needed MMK00 . In the case of a diatomic molecule, the stretching mode is, by definition, localized around the bond, and mainly couples to the neighboring water molecules. However, in the case of amide I modes in solvated proteins, the amide I modes are delocalized as shown in Table 1. Many resonant modes couple to such amide I modes, which can contain delocalized (collective) water motions. Further theoretical and experimental studies are needed to clarify the role of such delocalized modes on VER in proteins.
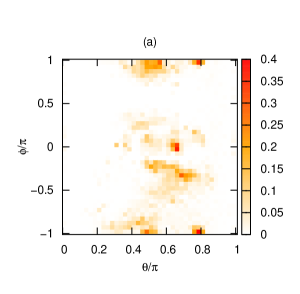
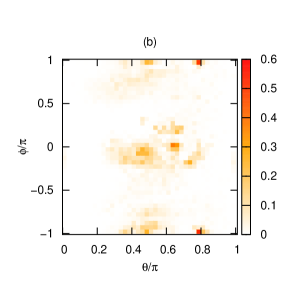
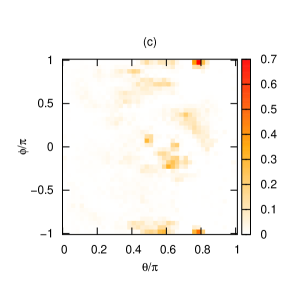
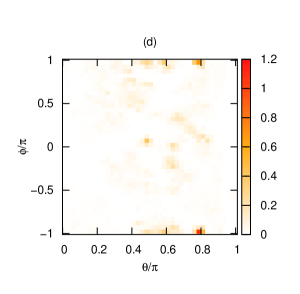
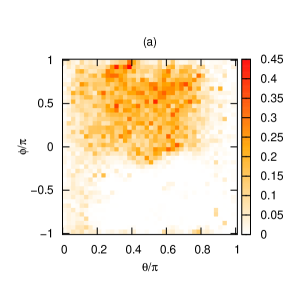
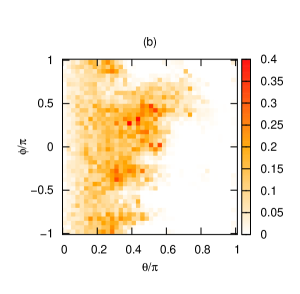
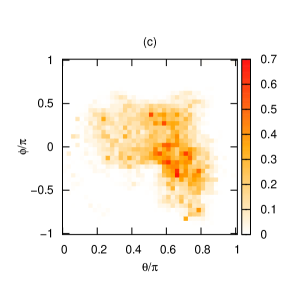
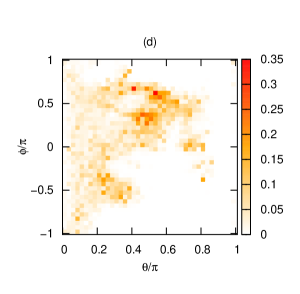
Finally we examine the angular excitation functions in Figs. 4 and 5 to understand the VER pathways along the angular directions. We observe that the VER of the amide I modes is spatially anisotropic. For the protein (Fig. 4), the resonant modes are mainly localized around or , which indicates that VER occurs in the peptide backbone plane (see Fig. 1). For the 81st and 84th residues, belonging to a loop structure, the value around enhances because the amide plane is planer and the intramolecular contribution comes from such a direction. For the 93rd and 97th residues, belonging to an helical structure, the value around diminishes because the amide I plane is bended.
On the other hand, for the water (Fig. 5), the angular excitation function is rather broad, and these distributions are similar to the conventional distribution function of water around the CO bond (not shown here). However, the excitation functions are less uniform compared to the conventional distribution function of water, implying the anisotropy of VER into water. While these excitation functions can not be directly measured, it is of significant interest to examine the anisotropy of energy flow in proteins using experimental methods such as the multidimensional spectroscopy ZH01 ; WH02 ; HLH98 ; ZAH01 ; MKFKAZ04 .
Recently Dlott and coworkers Dlott02 and Hamm and coworkers Hamm07 devised a new experimental technique to clarify energy transfer pathways in molecular systems. This method may be also combined with our analysis to clarify the water contribution of VER in a protein.
IV Concluding remarks
Using the time-dependent perturbation formula we developed in our previous paper, we have investigated the vibrational energy relaxation (VER) of amide I modes in cytochrome c solvated with water. We observed that the VER rates are sub-picosecond for the four residues we examined here, which are in accord with previous experiment for other proteins. We have decomposed VER into separate contributions from protein and water, and further projected the resonant modes onto radial and angular excitation functions. Although the total VER rate is similar, the detailed mechanism of VER is different; there are protein-mediated pathways and water-mediated pathways depending on which residue is excited. There is anisotropy of VER for the water-mediated pathways as well as for the protein-mediated pathways, implying experimental consequences by multidimensional spectroscopy or other means.
Anharmonicity is a key issue in VER calculations. We note that our simulated dynamics are based on the CHARMM force field, in which vibrational anharmonicity has been underestimated. There is some evidence that the anharmonic coupling calculated using the force field can be comparable to that derived from ab initio calculations (Fujisaki, H.; Yagi, K.; Hirao, K.; Straub, J.E. unpublished). However, without such a direct comparison, it is unclear how accurate the results of our force field calculations are. Nevertheless, the use of empirical energy functions is currently the only feasible way to characterize VER in large molecules. To expand on these studies, we must develop a new methodology to investigate the quantum dynamics of the amide I mode with ab initio potential surfaces. As first steps, we investigated N-methylacetamide in vacuum using the VCI method FYHS07 and in water cluster using the perturbation method (Zhang, Y.; Fujisaki, H.; Straub, J.E. unpublished) on ab initio potentials. How to extend these studies to larger systems using multiresolution methods rauhut ; YHH06 or QM/MM methods LSCLS06 ; Hirata05 ; ST07 would be our focus in the near future.
Another important and related topic which should be pursued by such ab initio methods is the effect of polarization HHLKKC04 ; Skinnergroup ; ZAHM06 ; HJZM05 ; Stock06 . Morita and Kato clarified that polarization is important for VER of a stretching mode in azide ion in water MK98 , and this might be also the case for VER of amide I modes in a protein. In particular, it is important to investigate some portion of a protein where the internal electric field is large and the polarization effect is expected to be enhanced.
Acknowledgements.
We thank Y. Zhang for a useful suggestion on the relation between the VER rate and SASA and anonymous referees for useful suggestions. We are also grateful to Prof. G. Stock, Prof. D.M. Leitner, Prof. K. Hirao, Prof. B. Brutschy, Prof. J. Wachtveitl, Dr. K. Yagi, Dr. A. Furuhama for useful discussions. We thank the National Science Foundation (CHE-0316551), Boston University’s Center for Computer Science for generous support to our research, and the Department of Chemistry and Biochemistry at Montana State University for generous support and hospitality.References
- (1) Krimm, S.; Bandekar, J. Adv. Prot. Chem. 1986, 38, 181.
- (2) (a) Torii, H.; Tasumi, M. J. Chem. Phys. 1992, 96, 3379. (b) Torii, H.; Tasumi, M. J. Chem. Phys. 1992, 97, 92.
- (3) Barth, A.; Zscherp, C. Q. Rev. Biophys. 2002, 35, 369.
- (4) Silva, R.A.G.D.; Barber-Armstrong, W.; Decatur, S.M. J. Am. Chem. Soc. 2003, 125, 13674.
- (5) Gnanakaran, S.; Hochstrasser, R.M.; Garcia, A.E. Proc. Natl. Acad. Sci. U.S.A. 2004, 101, 9229.
- (6) (a) Tanimura, Y.; Mukamel, S. J. Chem. Phys. 1993, 99, 9496. (b) Mukamel, S. Principles of Nonlinear Optical Spectroscopy (Oxford Univ. Press, New York, 1995).
- (7) Zanni, M.T.; Hochstrasser, R.M. Curr. Opin. Struc. Biol. 2001, 11, 516.
- (8) Woutersen, S.; Hamm, P. J. Phys. Cond. Matt. 2002, 14, 1035.
- (9) Wang, J.P.; Hochstrasser, R.M. J. Phys. Chem. B 2006, 110, 3798.
- (10) DeFlores, L.P.; Ganim, Z.; Ackley, S.F.; Chung, H.S.; Tokmakoff, A. J. Phys. Chem. B 2006, 110 18973.
- (11) Ishizaki, A.; Tanimura, Y. J. Chem. Phys. 2006, 125, 084501.
- (12) Nagata, Y.; Tanimura, Y.; Mukamel, S. J. Chem. Phys. 2007, 126, 204703.
- (13) Torii, H. J. Phys. Chem. B 2007, 111, 5434.
- (14) (a) Ham, S.; Hahn, S.; Lee, C.; Kim, T.K.; Kwak, K.; Cho, M. J. Phys. Chem. B 2004, 108, 9333; (b) Ham, S.; Hahn, S.; Lee, C.; Cho, M. J. Phys. Chem. B 2005, 109, 11789.
- (15) (a) Schmidt, J.R.; Corcelli, S.A.; Skinner, J.L. J. Chem. Phys. 2004, 121, 8887. (b) Li, S.; Schmidt, J.R.; Corcelli, S.A.; Lawrence, C.P.; Skinner, J.L. J. Chem. Phys. 2006, 124, 204110.
- (16) Zhuang, W.; Abramavicius, D.; Hayashi, T.; Mukamel, S. J. Phys. Chem. B 2006, 110, 3362.
- (17) Hayashi, T.; la Cour Jansen, T.; Zhuang, W.; Mukamel, S. J. Phys. Chem. A 2005, 109, 64.
- (18) Gorbunov, R.D.; Nguyen, P.H.; Kobus, M.; Stock, G. J. Chem. Phys. 2007, 126, 054509.
- (19) Gregurick, S.K.; Chaban, G.M.; Gerber, R.B. J. Phys. Chem. A 2002, 106, 8696.
- (20) Bounouar, M.; Scheurer, Ch. Chem. Phys. 2006, 323, 87.
- (21) Kaledin, A. L.; Bowman, J. M. J. Phys. Chem. A. 2007, 111, 5593-5598, doi:10.1021/jp0723822.
- (22) Fujisaki, H.; Yagi, K.; Hirao, K.; Straub, J.E. Chem. Phys. Lett. 2007, 443, 6-11, doi:10.1016/j.cplett.2007.06.067, e-print arXiv:0706.1905.
- (23) Hamm, P.; Lim, M.H.; Hochstrasser, R.M.; J. Phys. Chem. B 1998, 102, 6123.
- (24) Zanni, M.T.; Asplund, M.C.; Hochstrasser, R.M. J. Chem. Phys. 2001, 114, 4579.
- (25) (a) Xie, A.; van der Meer, L.; Hoff, W.; Austin, R.H. Phys. Rev. Lett. 2000, 84, 5435. (b) Austin, R.H.; Xie, A.; van der Meer, L.; Redlich, B.; Lindgard, P.A.; Frauenfelder, H. Phys. Rev. Lett. 2005, 94, 128101.
- (26) Nguyen, P.H.; Stock, G. J. Chem. Phys. 2003, 119, 11350.
- (27) Fujisaki, H.; Zhang, Y.; Straub, J.E. J. Chem. Phys. 2006, 124, 144910.
- (28) (a) Fujisaki, H.; Bu, L.; Straub, J.E. Adv. Chem. Phys. 2005, 130B, 179. (b) Fujisaki, H.; Bu, L.; Straub, J.E. in Normal Mode Analysis: Theory and Applications to Biological and Chemical Systems, edited by Q. Cui and I. Bahar, Chapman and Hall/CRC Press, Boca Raton, Florida (2005). (c) Fujisaki, H.; Straub, J.E. Proc. Natl. Acad. Sci. U.S.A. 2005, 102, 6726.
- (29) Cremeens, M.; Fujisaki, H.; Zhang, Y.; Zimmermann, J.; Sagle, L.B.; Matsuda, S.; Dawson, P.E.; Straub, J.E.; Romesberg, F.E.; J. Am. Chem. Soc. 2006, 128, 6028.
- (30) (a) Mukherjee, P.; Krummel, A.T.; Fulmer, E.C.; Kass, I.; Arkin, I.T.; Zanni, M.T. J. Chem. Phys. 2004, 120, 10215. (b) Mukherjee, P.; Kass, I.; Arkin, I.T.; Zanni, M.T. J. Phys. Chem. B 2006, 110, 24740.
- (31) Arkin, I.T. Curr. Opin. Chem. Biol. 2006, 10, 394.
- (32) Yagi, K.; Hirao, K.; Taketsugu, T.; Schmidt, M.W.; Gordon, M.S. J. Chem. Phys. 2004, 121, 1383.
- (33) (a) Shiga, M.; Okazaki, S. J. Chem. Phys. 1998, 109, 3542. (b) Shiga, M.; Okazaki, S. J. Chem. Phys. 1999, 111, 5390. (c) Mikami, T.; Shiga, M.; Okazaki, S. J. Chem. Phys. 2001, 115, 9797. (d) Mikami, T.; Okazaki, S. J. Chem. Phys. 2004, 121, 10052.
- (34) (a) Yu, X.; Leitner, D.M. J. Phys. Chem. B 2003, 107, 1698. (b) Leitner, D.M. Adv. Chem. Phys. 2005, 130B, 205. (c) Leitner, D.M.; Havenith, M.; Gruebele, M. Int. Rev. Phys. Chem. 2006, 25, 553.
- (35) Dijkstra, A.G.; Knoester, J. J. Phys. Chem. B 2005, 109, 9787.
- (36) Sagnella, D.E.; Straub, J.E. J. Phys. Chem. B 2001, 105, 7057.
- (37) Okamoto, T.; Nagaoka, M. Chem. Phys. Lett. 2005, 407, 444.
- (38) Mikami, T.; Okazaki, S. J. Chem. Phys. 2003, 119, 4790.
- (39) (a) Brooks, B.R.; Bruccoleri, R.E.; Olafson, B.D.; States, D.J.; Swaminathan, S.; Karplus, M. J. Comp. Chem. 1983, 4, 187. (b) MacKerell, Jr. A.D.; Brooks, B.; Brooks III, C.L.; Nilsson, L.; Roux, B.; Won, Y.; Karplus, M. in The Encyclopedia of Computational Chemistry, 1, 271, edited by P.v.R. Schleyer et al., John Wiley & Sons: Chichester (1998).
- (40) Bu, L.; Straub, J.E. Biophys. J. 2003, 85, 1429.
- (41) (a) Stratt, R.M. Acc. Chem. Res. 1995, 28, 201. (b) Keyes, T. J. Phys. Chem. A 1997, 101, 2921.
- (42) Zhang, Y.; Fujisaki, H.; Straub, J.E. J. Phys. Chem. B 2007, 111, 3243.
- (43) (a) Moritsugu, K.; Miyashita, O.; Kidera, A. Phys. Rev. Lett. 2000, 85, 3970. (b) Moritsugu, K.; Miyashita, O.; Kidera, A. J. Phys. Chem. B 2003, 107, 3309.
- (44) Wang, Z.; Pakoulev, A.; Dlott, D.D. Science 2002, 296, 2201.
- (45) Botan, V; Backus, E.H.G.; Pfister, R.; Moretto, A.; Toniolo, C.; Nguyen, P.H.; Stock, G.; Hamm, P. Proc. Natl. Acad. Sci. U.S.A. 2007, (in press).
- (46) Rauhut, G. J. Chem. Phys. 2004, 121 9313.
- (47) Yagi, K.; Hirata, S.; Hirao, K. Theo. Chem. Acc. 2007, (in press), doi 10.1007/s00214-007-0363-x.
- (48) Lin, S.Z.; Schmidt, J.R.; Corcelli, S.; Lawrence, C.P.; Skinner, J.L.; J. Chem. Phys. 2006, 124, 204110.
- (49) Hirata, S.; Valiev, M.; Dupuis, M.; Xantheas, S.S.; Sugiki, S.; Sekino, H. Mol. Phys. 2005, 103 2255.
- (50) Shiga, M.; Tachikawa, M. Mol. Sim. 2007, 33, 171.
- (51) (a) Morita, A.; Kato, S. J. Chem. Phys. 1998, 109, 5511. (b) Li, S.; Schmidt, J.R.; Skinner, J.L. J. Chem. Phys. 2006, 125, 244507.
- (52) Humphrey, W.; Dalke, A.; Schulten, K. J. Mol. Graph. 1996, 14, 33.