Zener double exchange from local valence fluctuations in magnetite
Abstract
Magnetite (Fe3O4) is a mixed valent system where electronic conductivity occurs on the B-site (octahedral) iron sublattice of the spinel structure. Below K, a metal-insulator transition occurs which is argued to arise from the charge ordering of 2+ and 3+ iron valences on the B-sites (Verwey transition). Inelastic neutron scattering measurements show that optical spin waves propagating on the B-site sublattice (80 meV) are shifted upwards in energy above due to the occurrence of B-B ferromagnetic double exchange in the mixed valent metallic phase. The double exchange interaction affects only spin waves of symmetry, not all modes, indicating that valence fluctuations are slow and the double exchange is constrained by electron correlations above .
pacs:
71.30.+h, 75.30.Ds, 75.30.Et, 78.70.NxMagnetite (Fe3O4) is the prototypical example of a metal-insulator transition with a charge-ordered (CO) insulating ground state (Verwey transition). Since its discovery nearly 70 years ago,Verwey (1939) the driving forces behind the Verwey transition are still not completely understood.Walz (2002); García and Subías (2004) Magnetite has a cubic inverse spinel crystal structure containing two different symmetry iron sites; the A-site resides in tetrahedrally coordinated oxygen interstices and has stable valence (3d5, Fe3+), the two B-sites have octahedral coordination and a fractional average valence of 2.5+. The ferrimagnetic structure consists of ferromagnetic A- and B-sublattices aligned antiparallel to each other ( = 858 K). Below = 122 K, magnetite undergoes a metal-insulator transition resulting in a decrease of the conductivity by two orders-of-magnitude. The model that has persisted over time is that extra electrons forming Fe2+ ions (3d6) hop to neighboring Fe3+ sites on the tetrahedral B-sublattice network and give rise to electrical conductivity. Anderson argued that short-range ordering of Fe2+ and Fe3+ exists above due to significant intersite Coulomb repulsion and frustration on the B-site sublattice.Anderson (1956) The short-ranged electron correlations maintain local charge ”neutrality” (2.5+ average valence on each tetrahedron), thereby restricting charge hopping and conductivity.Ihle and Lorenz (1986) Eventually, Coulomb repulsions win out at low temperatures, resulting in long-range CO of Fe2+ and Fe3+ Verwey et al. (1947) in a process reminiscent of Wigner crystallization.Mott (1967) Weak elastic and orbital interactions I. Leonov et al. (2004) induce monoclinic lattice distortions whose complexity obscures the details of the CO state.Zuo et al. (1990) Even the validity of the CO model has been questioned.J. García et al. (2000) However, recent neutron Wright et al. (2002) and resonant x-ray scattering measurements E. Nazarenko et al. (2006) appear to converge on fractional CO.

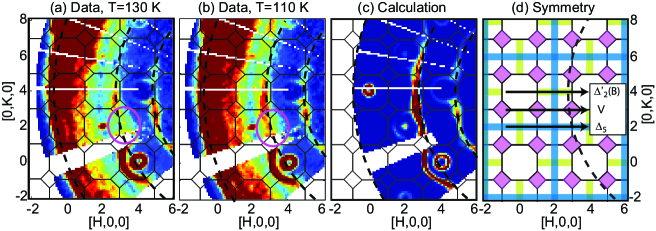
In this Letter, we provide strong evidence for Anderson’s original picture of the Verwey transition in magnetite as arising out of short-range electron correlations in the mixed valent (MV) phase. Valence fluctuations occurring on the B-sublattice modify the magnetic exchange and affect spin waves propagating on Fe B-sites. Inelastic neutron scattering measurements of spin waves reveal that B-site optical spin waves are shifted up in energy and broadened above due to ferromagnetic double exchange (DE). Ferromagnetic DE arises from real charge transfer processes in MV materials, a good example being the ferromagnetic metallic state in the manganites.Tokura (2006) For fast electron hopping in the band limit, the average DE should uniformly affect all B-B pairs. However, our results show that only spin waves of a particular symmetry are affected by DE, implying the presence of Zener DE Rosencwaig (1969) arising from slow ( meV) electron hopping and restricted by short-ranged charge correlations. The local valence fluctuation symmetry can be inferred from the data and mirrors the eventual long-range symmetry of the CO state.Piekarz et al. (2006) Inelastic neutron scattering measurements were performed on the MAPS instrument at the ISIS facility at Rutherford-Appleton Laboratory on a single-crystal of Fe3O4 weighing 10 grams. Details of sample preparation and characterization are given elsewhere.R. J. McQueeney et al. (2006) The sample was mounted with cubic as the primary scattering plane and data were collected with an incident neutron energy of 160 meV and the incident beam at an angle of 25o from the [110] axis. Time-of-flight neutron spectra were collected at 110 K ( ) and 130 K ( ) and scattered intensities were histogrammed into energy transfer () and momentum transfer (Q) bins. Data were subsequently analyzed using MSLICE Coldea (2004) and TOBYFIT Perring (2004) computer programs.The measured neutron scattering spectra from MAPS (and also the HB–3 spectrometer at the High Flux Isotope Reactor at Oak Ridge National Laboratory) were used to determine the spin wave dispersion in magnetite. In the cubic spinel phase above TV, the primitive rhombohedral unit cell contains six iron atoms (2A and 4B), leading to six spin wave branches. Figure 1 shows the spin wave dispersion along [100] as determined from Gaussian fits to spin wave modes. The dispersion is well represented by a Heisenberg model where antiferromagnetic AB superexchange, via oxygen, is dominant ( meV) and is responsible for ferrimagnetism. Ferromagnetic BB exchange arises from a combination of superexchange, DE, and direct exchange and is an order-of-magnitude weaker ( 0.69 meV). Weak antiferromagnetic nearest- and next-nearest-neighbor AA exchange is also present ( -0.35 meV, -0.2 meV). The dispersion calculated from a Heisenberg model with exchange parameters above and spins and is also shown in fig. 1. Branch symmetries were identified from the model spin wave eigenvectors and are given the following labels and descriptions; (acoustic and steeply dispersing optic), (optic spin wave on A-sublattice), (optic spin wave on B-sublattice), and (doubly-degenerate optic spin waves on B-sublattice). Modes of and symmetry at 80 meV (in the hatched region of fig. 1) propagate solely on the B-sublattice and were observed to be very broad and weak, as discussed below. Figures 2(a) and (b) show images of scattering intensity in the plane at 130 K and 110 K, respectively. The arcs and rings in the images correspond to the intersection of the neutron measurement surface and the dispersion surfaces. Figure 2(c) shows a calculation of the MAPS data using the Heisenberg model described above. Calculations simulate the sampling of spin waves in (Q, space performed by MAPS. Features of the calculated and measured spectra are in good agreement (as anticipated from fig. 1) with one notable exception. As indicated in Fig. 2(a), the measured B-site optical spin wave branch at 80 meV is poorly defined in the region between [220] and [420] at 130 K. Comparison with the 110 K spectrum illustrates two features; (1) the B-site modes sharpen up below in better agreement with the cubic model (despite the lowering of crystallographic symmetry), (2) other spin wave branches are essentially unaffected, indicating that and are insensitive to the Verwey transition.
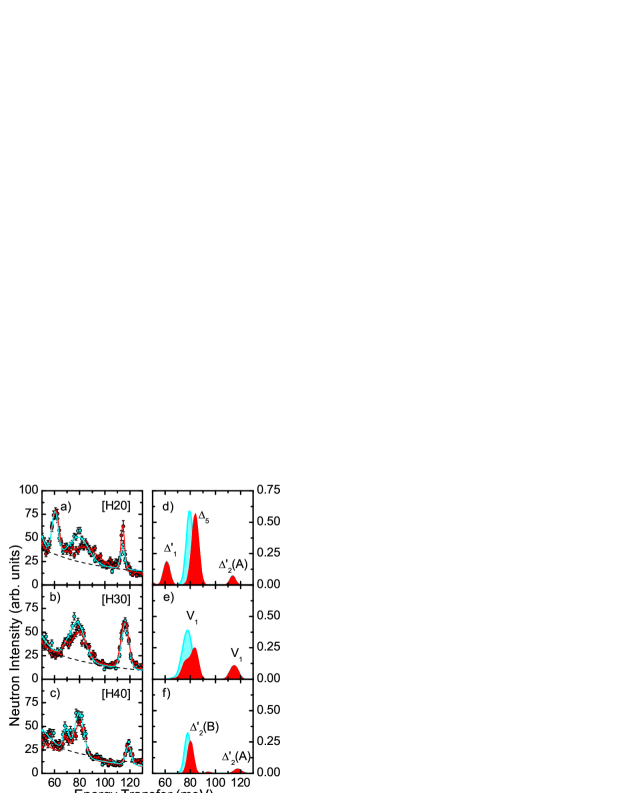
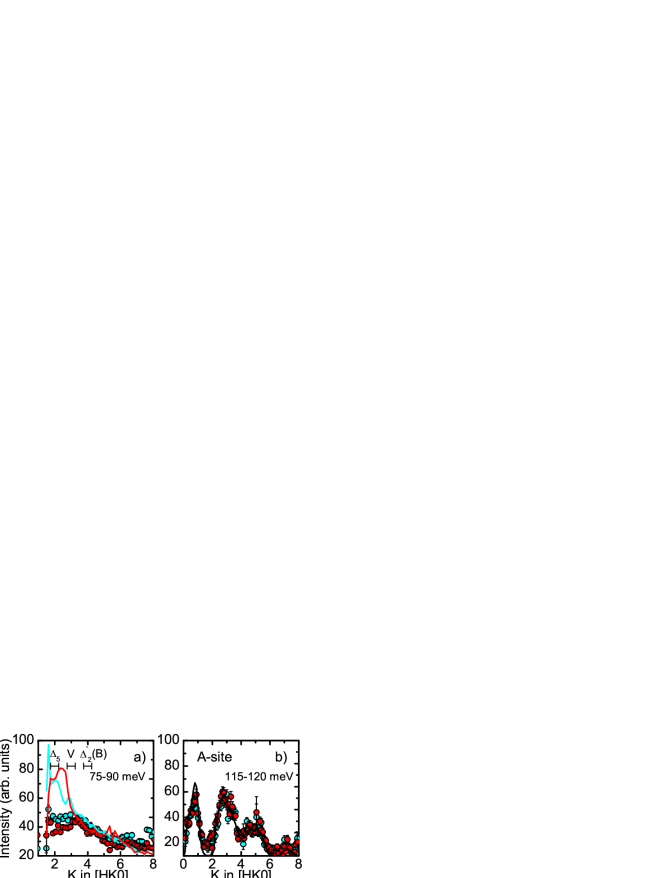
These observations are supported by energy cuts through the MAPS data at different values of and different temperatures, as shown in fig. 3. To improve statistics, cuts are obtained by averaging neutron intensity over a range of reciprocal space. Fig. 3 shows the following cuts made in the range ; , and . These reciprocal space cuts allow for specific symmetry selection of the B-site optical spin waves, as shown in fig. 2(d). In the constrained measurement surface of MAPS, is a function of , as can be ascertained from the comparison of figs. 2 and 3. The energy resolution full-width-at-half-maximum (FWHM) is calculated to be 3-4 meV for dispersionless modes in the energy range shown (using the TOBYFIT program). In all cuts, spin wave modes at 60 and 117 meV are independent of temperature and resolution limited, while 80 meV modes are broader than the resolution. The energy cut along the direction in fig. 3(a) shows that the symmetry branch at 80 meV shifts up in energy and becomes severely broadened above , as also apparent in fig 2. Gaussian fits to the data indicate that the mode energy shifts from meV to meV and the FWHM broadens by from 17 to 28 meV above . The B-site spin waves along in fig. 3(b) ( symmetry) and in fig. 3(c) ( symmetryvsy ) also have broad lineshapes with FWHM of 14 meV and 10 meV, respectively, but relatively little temperature dependence. We also note the weak peak near 70 meV in figs. 3(b) and 3(c) is likely to be a phonon, based on examination of higher-Q data. The anomalous B-site spin waves can be explained by consideration of ferromagnetic DE. The conduction electron associated with the Fe2+ ion is forced to remain oppositely aligned to the Fe3+ 3d5 core spin by the Pauli exclusion principle (effectively . Since the B-sublattice is already ferromagnetically aligned due to strong , spin polarized conduction results in DELoos and Novák (2002) and leads to an increase in . In turn, the energy of B-site optical spin waves increases. The enhancement of DE above can be estimated from the energy of the dispersionless mode, . Since does not change,R. J. McQueeney et al. (2006) the shift of 4.4 meV implies that increases from 0.44 meV to 0.69 meV. The energy cuts are compared to the Heisenberg model structure factor calculation in figs. 3(d)-(f) with meV and meV. Comparison to calculation shows that; (1) all B-site spin wave peaks are much weaker and broader than Heisenberg model predictions, (2) changing in the model shifts the energy of all mode symmetries, in disagreement with the observation that only the mode has a large temperature dependence. Structure factors in the energy range meV and meV and -range are shown in fig. 4 as a function of . Fig. 4(a) further illustrates the anomalous mode, which shows a minimum in the measured structure factor whereas the calculation predicts a maximum. Fig. 4(b) indicates that A-site optical spin waves have little temperature dependence and agree quite well with Heisenberg calculations.
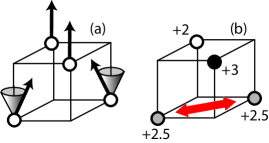
It is clear that stiffening and extreme broadening of modes above cannot be explained by uniformly enhanced BB coupling as might be expected from a band approach. The failure of a band model is reiterated by estimating the DE arising from metallic conductivity, Millis et al. (1995); Furukawa (1996) where is the concentration of charge carriers in the conduction band and the electron hopping integral. The effective one-band hopping integral from LSDA calculation is meVZhang and Satpathy (1991), leading to an estimate of meV that is significantly larger than the observed value ( meV). This disagreement emphasizes the importance of charge correlation and/or polaronic effects above that lead to activated conduction and a reduction of the effective hopping integral. This picture is supported by optical conductivity measurements showing that the 100 meV electronic energy gap below (which suppresses DE) is replaced by a pseudogap above .Degiorgi et al. (1987); Park et al. (1998) In this limit, the Zener DE picture of slow and local charge hopping between distinct valence states above is appropriate and the closing of the electronic gap allows the coupling of spin waves to valence fluctuations leading to broadened spinwave lineshapes. The predominant spin wave symmetry would then imply that valence fluctuations have the same symmetry and occur along the quasi-one-dimensional [110] B-site chains, as illustrated in fig. 5. The spin wave changes the alignment of neighboring spins, thereby impeding valence fluctuations which favor parallel spins. The presence of slow valence fluctuations coupling to the lattice has also been observed with neutron diffuse scattering and occur well above Shapiro et al. (1976). In the MV phase, these local symmetry-breaking charge correlations are short-ranged. While we interpret our data based on the symmetry assignments for modes along the [100] direction, broadening everywhere in the Brillouin zone indicates that the coupled B-site charge and spin fluctuations are local. The resulting picture of valence fluctuations constrained by short-range ordering of Fe valences is similar to that proposed originally by Anderson.Anderson (1956) In addition, the implication of slow electron hopping (80 meV) supports more detailed theories of magnetite that invoke polaronic behavior for the Fe2+ charge carriers.Ihle and Lorenz (1986) Spin-charge coupling is large and may contribute to the polaronic binding energy. Finally, the symmetry of charge correlations are similar to the eventual frozen pattern of the CO state, which has been argued to be a combination of cubic representations.Piekarz et al. (2006)
ACKNOWLEDGMENTS
RJM would like to thank S. Satpathy for useful discussions. Work is supported by the U. S. Department of Energy Office of Science under the following contracts; Ames Laboratory under Contract No. DE-AC02-07CH11358, Oak Ridge National Laboratory, which is managed by UT-Batelle LLC, under Contract No. DE-AC00OR22725.
References
- Verwey (1939) E. J. W. Verwey, Nature (London) 144, 327 (1939).
- Walz (2002) F. Walz, J. Phys. Condens. Matter 14, R285 (2002).
- García and Subías (2004) J. García and G. Subías, J. Phys. Condens. Matter 16, R145 (2004).
- Anderson (1956) P. W. Anderson, Phys. Rev. 102, 1008 (1956).
- Ihle and Lorenz (1986) D. Ihle and B. Lorenz, J. Phys. C: Solid St. Phys. 19, 5239 (1986).
- Verwey et al. (1947) E. J. Verwey, P. W. Haayman, and F. C. Romeijn, J. Chem. Phys. 15, 181 (1947).
- Mott (1967) N. F. Mott, Adv. Phys. 16, 49 (1967).
- I. Leonov et al. (2004) I. Leonov et al., Phys. Rev. Lett. 93, 146404 (2004).
- Zuo et al. (1990) J. M. Zuo, J. C. H. Spence, and W. Petuskey, Phys. Rev. B 42, 8451 (1990).
- J. García et al. (2000) J. García et al., Phys. Rev. Lett. 85, 578 (2000).
- Wright et al. (2002) J. P. Wright, J. P. Attfield, and P. G. Radaelli, Phys. Rev. B 66, 214422 (2002).
- E. Nazarenko et al. (2006) E. Nazarenko et al., Phys. Rev. Lett. 97, 056403 (2006).
- Tokura (2006) Y. Tokura, Rep. Prog. Phys. 69, 797 (2006).
- Rosencwaig (1969) A. Rosencwaig, Phys. Rev. 181 (1969).
- Piekarz et al. (2006) P. Piekarz, K. Parlinski, and A. M. Oles, Phys. Rev. Lett. 97, 156402 (2006).
- R. J. McQueeney et al. (2006) R. J. McQueeney et al., Phys. Rev. B 73, 174409 (2006).
- Coldea (2004) R. Coldea, MSLICE: A data analysis programme for time-of-flight neutron spectrometers (2004).
- Perring (2004) T. G. Perring, TOBYFIT-least-squares fitting to single crystal data on het, mari and maps (2004).
- (19) V symmetry direction is , on the Brillouin zone face.
- Loos and Novák (2002) J. Loos and P. Novák, Phys. Rev. B 66, 132403 (2002).
- Millis et al. (1995) A. J. Millis, P. B. Littlewood, and B. I. Shraiman, Phys. Rev. Lett. 74, 5144 (1995).
- Furukawa (1996) N. Furukawa, J. Phys. Soc. Jpn. 65, 1174 (1996).
- Zhang and Satpathy (1991) Z. Zhang and S. Satpathy, Phys. Rev. B 44, 13319 (1991).
- Degiorgi et al. (1987) L. Degiorgi, P. Wachter, and D. Ihle, Phys. Rev. B 35, 9259 (1987).
- Park et al. (1998) S. K. Park, T. Ishikawa, and Y. Tokura, Phys. Rev. B 58, 3717 (1998).
- Shapiro et al. (1976) S. M. Shapiro, M. Iizumi, and G. Shirane, Phys. Rev. B 14, 200 (1976).