Saddle-point van Hove singularity and the phase diagram of high- cuprates
Abstract
We examine the generic phase behavior of high- cuprate superconductors in terms a universal van Hove singularity in the strongly overdoped region. Using a rigid ARPES-derived dispersion we solve the BCS gap equation and show that the pairing interaction or pairing energy cutoff must be a rapidly declining function of doping. This result is prejudicial to a phonon-based pairing interaction and more consistent with a magnetic or magnetically enhanced interaction.
pacs:
74.25.Dw, 74.25.Jb, 74.62.Dh, 74.72.-hThe high- cuprates are remarkable in that, despite their varied atomic structures and consequent variation in bare electronic band structurePavarini et al. (2001), they exhibit universal phase behaviour. For example, with the exception of La2-xSrxCuO4 which seems more prone to stripe instabilities, the thermoelectric power (TEP) is a universal function of hole concentration, Obertelli et al. (1992). Moreover, the evolution with doping of both the thermodynamic properties and the spin susceptibility is likewise universalLoram et al. (2001). Most importantly, the overall temperature-doping phase diagram seems to be universalTallon et al. (1995). The common features include: the onset of superconductivity at , the location of so-called “1/8th anomalies” at , optimal doping at , critical doping where the pseudogap closes at , the pseudogap line , and possibly the superconductor/metal transition at . To these we now wish to add another apparently common feature, namely the presence of a van Hove singularity (vHs) in the heavily overdoped regionKaminski et al. (2006).
The dispersion for the hole-doped cuprates exhibits a saddle-point singularity, the so called van Hove singularity, sited at (,0) on the Brillouin zone boundary. Increased hole doping moves the Fermi energy, , down towards the vHs which it eventually crossesKaminski et al. (2006) and where the density of states (DOS) diverges. Within a BCS picture the transition temperature is given byBardeen et al. (1957)
| (1) |
so that if the vHs crossing occurs within the superconducting domain the exponential dependence upon the DOS should result in a local peak in , precisely at the vHs. Of course the cuprates do exhibit a SC phase curve that passes through a peak at optimal dopingTallon et al. (1995) and there have been many attempts to explain this phase behavior in terms of a vHs crossing thereBouvier and Bok (1995); Newns et al. (1995); Szotek et al. (1998). Further, the rise in isotope effect exponent with underdoping was also explored as a consequence of a proximate vHsTsuei et al. (1990). Finally, underdoped cuprates exhibit a pseudogap in the normal-state DOS that, amongst other things, causes a strong suppression of the spin susceptibility, , at low temperatureAlloul et al. (1989); Loram et al. (2001). Some groups sought to explain this suppression in terms of a nearby vHsBouvier and Bok (1997) where the Fermi window, for , extends to the far side of the vHs thereby reducing .
These ideas all failed for various reasons. The value of near a vHs never falls more than 10% at low temperature and so the model could never account for the nearly full suppression of as Alloul et al. (1989); Loram et al. (2001). Further, ARPES revealed that the vHs at lay at least 60meV below at optimal doping and thus could not account directly for the location of the maximum in .
However, we now need to revisit these ideas in view of recent findings. In the case of La2-xSrxCuO4 the vHs is known to be crossed in the deeply overdoped region at Ino et al. (2002); Yoshida et al. (2006). A similar situation occurs with Bi2Sr2CuO6Kondo et al. (2004) and deeply overdoped Tl2Ba2CuO6 also lies close to the saddle-point vHsPlate et al. (2005). We will return to these systems later. They are all single CuO2 layer compounds. Where there are two CuO2 layers per unit cell the weak electronic coupling between the layers lifts the degeneracy of the electronic states in the layers causing split antibonding and bonding bands. The splitting is maximal near and is about 100 meV there. Surprisingly it has recently been shown by ARPES measurements that for Bi2Sr2CaCu2O8 the antibonding vHs is crossed in the deeply overdoped region around Kaminski et al. (2006). One has therefore to consider the hypothesis that the location of a vHs around is general and possibly plays a central role in defining the generic phase curve (along with the pseudogap at ). This is given all the more weight by the fact that both single- and double-layer cuprates cross the singularity at about the same point in the phase diagram in spite of the split band in the latter case.
We have explored this hypothesis using a rigid ARPES-derived dispersion for Bi2Sr2CaCu2O8 expressed in terms of a six-parameter tight-binding fit to the dispersionKaminski et al. (2006). The doping dependence of the resultant density of states at the Fermi level, , is shown in Fig. 1(a). Elsewhere we showed that the entropy and superfluid density calculated from this dispersion agrees with the observed magnitude, temperature and doping dependence of these parametersStorey et al. (submitted). Here we ignore the pseudogap in underdoped samples and this is a feature that would need to be added in a fuller treatment (though the general conclusions would remain unchanged).
In the superconducting state we employ a -wave gap of the form where . The dispersion in the presence of the superconducting gap is given by and is determined from the self-consistent weak-coupling BCS gap equationZhou and Schulz (1992)
| (2) |
For a justification of this approach see Ref. Storey et al. (submitted). We adopt a pairing potential of the form . The summation in Eqn. 2 extends over all states up to a constant energy cut-off =125meV. We consider two cases: (i) the pairing amplitude, , is constant, chosen such that takes the observed value; and (ii) for each -value is selected such that follows the experimentally-observed, approximately parabolic, phase curve. Fig. 1(a) shows plotted as a function of hole concentration for the two cases.
Turning first to the curve for a constant (up-triangles), it is evident that if the pairing interaction or cut-off energy is fixed then the phase curve (a) is more narrow than that which is observed, (b) maximises at the location of the vHs in the heavily overdoped region (not at optimal doping) and (c) exhibits a second peak at the bonding-band vHs. All three difficulties are averted, and the peak broadened and shifted back to the observed optimal doping, only if either the pairing interaction or the cut-off decreases rapidly with doping. This is a robust result independent of the particular details that follow. We illustrate this by the second case explored, as follows.
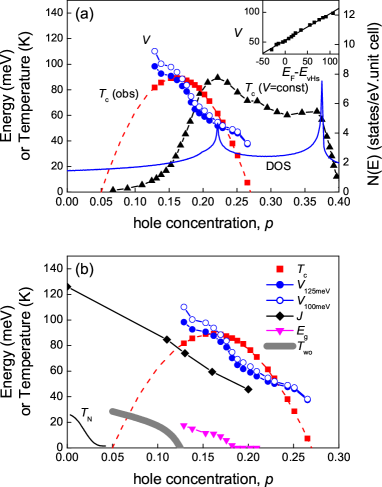
The second phase curve (squares) follows the empirical, approximately parabolic, phase curveTallon et al. (1995)
| (3) |
Using the gap equation, we have calculated values of that reproduce these values. The resultant values of are shown by the circles plotted as a function of in Fig. 1(b). They descend rapidly towards zero with increasing doping. If, alternatively, is held constant and the energy cut-off, , is varied, essentially the same result is obtained - a rapidly descending value that vanishes near . Such a strongly dependent interaction would not usually be associated with the electron-phonon interaction where the phonon energy scale is only a weak function of doping. Moreover, for a phonon mechanism involving motion of atoms lying outside of the CuO2 plane, this function is likely to be non-universal due to the different bond lengths and substitutionary doping mechanisms in each high- superconductor. These results are, rather, indicative of a magnetic, or magnetically enhanced, mechanism.
Further, the pairing pairing potential, , is clearly large and grows with underdoping towards the magnitude of the exchange interaction. For comparison, we plot in Fig. 1(b) the magnitude of determined from two-magnon Raman scatteringSugai and Hosokawa (2000), (where is taken, as usual, as 1/3 the frequency of two-magnon scattering peak). The magnitude and doping dependence of is very similar to that of , suggesting a close relationship between these. Also plotted (open circles) is when =100meV. A similar rapid rall is found showing that the choice of is not too critical.
This rapid fall in energy scales with doping is also reflected in serveral other energy scales also shown in Fig. 1(b). These are the pseudogap energy scale, and line where is the temperature where NMR intensity wipeout effects are observed, indicating the onset of inhomogeneous spin and charge distributionHunt et al. (1999); Singer and Imai (2002). is for (Y,Ca)Ba2Cu3O7-δSinger and Imai (2002). It is also in this region that the 44 checkerboard structure is observed in scanning tunneling spectroscopyKohsaka et al. (2007). These lines all expand out from the antiferromagnetic phase curve, Nishida et al. (1990), like ripples of remanent magnetic effects suggesting a common magnetic origin for these.
Here the doping is estimated from the parabolic phase curve which we know to be approximate only. In fact is very linear in , as shown in the inset to Fig. 1(a). This suggests that the overall phase curve is indeed governed by the proximate vHs combined with a rapidly declining bosonic energy scale. The value of or need not vanish at . Eventually the superconducting energy gap will fall below the pairbreaking scattering rate and will be reduced to zeroTallon et al. (1994) even if or are not quite zero.
If the overall phase diagram in the above-noted single-layer cuprates and in Bi-2212, is controlled by the proximate vHs then one might expect a similar vHs crossing in strongly overdoped Y0.8Ca0.2Ba2Cu3O7-δ. Here we now present evidence for this from the -dependent 89Y Knight shift measurements reported previously by Williams et al.Williams et al. (1998) and shown in Fig. 2. The Knight shift is linearly related to the spin susceptibility, , as follows
| (4) |
where is the - and -independent chemical shift. For a Fermi liquid the spin susceptibility is
| (5) |
Here is the Bohr magneton and is the Fermi function. We adopt our previous model which we used to model the entropy and superfluid densityStorey et al. (submitted). Using a tight-binding two-band fit (provided by the authors of Ref. Borisenko et al. (2006)) to the electronic dispersion for YBa2Cu3O7-δ and assuming a rigid band structure with doping we have calculated and fitted to the Knight shift data shown in Fig. 2. As beforeStorey et al. (submitted), we adopt a Fermi-arc model of the pseudogap and ignore all states in the integral with energy below the -dependent gap value . The fits are shown by the solid curves in the figure and the deduced values of (= and are plotted in the inset as a function of doping.

Just like , where is the electronic entropy, the Knight shift is observed to exhibit a fanning out behavior as is decreased, with underdoped samples decreasing (due to the pseudogap) and overdoped samples increasing (due to the proximate vHs)Storey et al. (submitted); Loram et al. (2001). In fact it has previously been shown that over a broad range of and for a number of cuprates, with being equal to the Wilson ratio for nearly-free electronsLoram et al. (2001). With increasing doping both and should rise steadily to a peak at the vHs then fall, as has been observed in La2-xSrxCuO4Loram et al. (2001). The apparently classical increase in of 1 per added holeLoram et al. (2001) would appear simply to arise from the increased DOS on approaching the vHs. The inset to Fig. 2 shows that for Y0.8Ca0.2Ba2Cu3O7-δ the Fermi level will reach the vHs in the deeply overdoped region, just like the other cuprates.
We therefore believe this situation to be universal in the cuprates. It raises the issue as to whether the phase diagram is truly a universal function of hole concentration, , or whether it is possibly merely a universal function of the distance away from the vHs i.e. . From our point of view this would be a significant concession as we have long argued for a universal - phase diagramTallon et al. (1995, 1994). But, it is not straightforward to determine doping levels except in the case of La2-xSrxCuO4 and La2-xSrxCaCu2O6 which both follow the universal phase curveTallon et al. (1995). To these we can add the fully deoxygenated material Y1-xCaxBa2Cu3O6 where , exactly. Here the universality of the phase diagram seems to be preservedTallon et al. (1995) and the careful use of bond valence sums also seems to confirm this for Y1-xCaxBa2Cu3O7-δ when Tallon et al. (1995).
Turning to other cuprates, very precise measurements of the cation content of oxygen-stoichiometric Tl0.5Pb0.5Sr2Ca1-xYxCu2O7, Tl0.5Pb0.5Sr2Ca2Cu3O9 and Tl2Ba2Ca2Cu3O10 also confirm the basic phase diagram with optimal doping at Tallon et al. (1995). For other cuprates we have usually estimated the doping state either from the room-temperature thermopowerObertelli et al. (1992) or from the parabolic phase behavior given by Eqn. 3. HgBa2CuO4+δ is also found to be consistent with both of these correlationsYamamoto et al. (2000). But we have recently found that the overall doping dependence of the thermopower, , is governed by the approach to the vHsStorey et al. (2006), with the change in sign of at low temperature occurring precisely at the vHs, . Thus is primarily governed by . The thermopower is therefore only a universal function of if is a universal function of . This can be tested by determining the absolute doping state from the area of the Fermi surface. We will call this .
Consider a few examples. (i) Firstly, it has already been shown that La2-xSrxCuO4 appears to follow the Luttinger theorem and across the phase diagramYoshida et al. (2006); (ii) ARPES measurements on fully-oxygenated YBa2Cu3O6.993, which we have previously identified as having a doping state of =0.19Tallon et al. (1994), has a Fermi surface area of 60% of the Brillouin zone corresponding to =0.20; and (iii) the Fermi surface of Tl-2201 has been measured by angular magneto resistance oscillationsHussey et al. (2003) and for a sample with =30K was found to be 0.24 0.02 holes/Cu. Using Eqn. 3 its value implies =0.25. These successes looks very promising. However, in the case of Bi-2212 the doping state is a little higher than estimated from thermopower or Eqn. 3 and for Bi-2201 it is seriously higherMarkiewicz et al. (2005). We thus conclude that it is likely that the phase diagram is probably a universal function of rather than of (though it is often also a universal function of ).
Finally, we note that close to a vHs there should be a tendency to structural change or local symmetry reduction so as, for example, to split the vHs and thus to lower the electronic energy. In this regard it is interesting that most, perhaps all, of the above mentioned HTS systems tend to be unstable in the heavily overdoped region. Firstly, the vHs is evidently close to the limits of overdoping of Bi-2212 and Y,Ca-123. Our experience is that these systems tend to decompose near these limits. Thus we typically have to oxygenate at high oxygen pressures using rather low temperatures (C) to avoid decomposition. For a long time La-214 has been known to phase separate in this overdoped regionJorgensen et al. (1991) and only by quenching from high temperature synthesis and reoxygenating (to stoichiometric O=4) at substantially lower temperatures can this phase separation be avoidedRadaelli et al. (1994). These effects are most noticeable in polycrystalline samples where there is a large surface to volume ratio. Single crystals enjoy a metastable state much longer or to higher temperatures. Oxygenation of Tl-2201 into the heavily overdoped region results in precipitation of Tl2O3 on the surface of single crystals or in grain boundaries of polycrystalline samples. Our attempts to overdope Tl-2201 or Tl0.5Pb0.5Sr2CaCu2O7 into this region by Cd substitution for Tl (generally successful in other circumstances) failed. And then Bi-2201 undergoes a change in electronic state in this same region. These various instabilities have always been a puzzle as has the fact that so many cuprates, as prepared, reside close to optimal doping. The proximate vHs could be the common cause.
In summary, we have used a rigid dispersion for Bi2Sr2CaCu2O8+δ and computed the phase curve showing that the only way in which the observed phase curve may be recovered is if the pairing interaction is a rapidly falling function of doping. We find that this closely follows the doping dependence of the exchange interaction, . We also argue that all HTS cuprates exhibit a van Hove singularity in the deeply overdoped region and this probably underlies the universal phase diagram observed in these systems.
We acknowledge funding from the New Zealand Marsden Fund and wish to thank A. Kaminski for the tight binding fits to the electronic dispersion for Bi-2212.
References
- Pavarini et al. (2001) E. Pavarini, I. Dasgupta, T. Saha-Dasgupta, O. Jepsen, and O. K. Andersen, Phys. Rev. Lett. 87, 047003 (2001).
- Obertelli et al. (1992) S. D. Obertelli, J. R. Cooper, and J. L. Tallon, Phys. Rev. B 46, 14928 (1992).
- Loram et al. (2001) J. W. Loram, J. Luo, J. R. Cooper, W. Y. Liang, and J. L. Tallon, J. Phys. Chem. Solids. 62, 59 (2001).
- Tallon et al. (1995) J. L. Tallon, C. Bernhard, H. Shaked, R. L. Hitterman, and J. D. Jorgensen, Phys. Rev. B 51, 12911 (1995).
- Kaminski et al. (2006) A. Kaminski, S. Rosenkranz, H. M. Fretwell, M. R. Norman, M. Randeria, J. C. Campuzano, J. M. Park, Z. Z. Li, and H. Raffy, Phys. Rev. B 73, 174511 (2006).
- Bardeen et al. (1957) J. Bardeen, L. N. Cooper, and J. R. Schrieffer, Physical Review 108, 1175 (1957).
- Bouvier and Bok (1995) J. Bouvier and J. Bok, Physica C 249, 117 (1995).
- Newns et al. (1995) D. M. Newns, C. C. Tsuei, and P. C. Pattnaik, Phys. Rev. B 52, 13611 (1995).
- Szotek et al. (1998) Z. Szotek, B. L. Gyorffy, W. M. Temmerman, and O. K. Andersen, Phys. Rev. B 58, 522 (1998).
- Tsuei et al. (1990) C. C. Tsuei, D. M. Newns, C. C. Chi, and P. C. Pattnaik, Phys. Rev. Lett. 65, 2724 (1990).
- Alloul et al. (1989) H. Alloul, T. Ohno, and P. Mendels, Phys. Rev. Lett. 63, 1700 (1989).
- Bouvier and Bok (1997) J. Bouvier and J. Bok, J. Supercon. 10, 673 (1997).
- Yoshida et al. (2006) T. Yoshida, X. J. Zhou, K. Tananka, W. L. Yang, Z. Hussain, Z. X. Shen, A. Fujimori, S. Sahrakorpi, M. Lindroos, R. S. Markiewicz, et al., Phys. Rev. B 74, 224510 (2006).
- Ino et al. (2002) A. Ino, C. Kim, M. Nakamura, T. Yoshida, T. Mizokawa, A. Fujimori, Z. X. Shen, T. Kakeshita, H. Eisaki, and S. Uchida, Phys. Rev. B 65, 094504 (2002).
- Kondo et al. (2004) T. Kondo, T. Takeuchi, T. Yokoya, S. Tsuda, S. Shin, and U. Mizutani, J. Electron. Spectrosc. Relat. Phenom. 137–140, 663 (2004).
- Plate et al. (2005) M. Plate, J. D. F. Mottershead, I. S. Elfimov, D. C. Peets, R. Liang, D. A. Bonn, W. N. Hardy, S. Chiuzbaian, M. Falub, M. Shi, et al., Phys. Rev. Lett. 95, 077001 (2005).
- Storey et al. (submitted) J. G. Storey, J. L. Tallon, and G. V. M. Williams, Phys. Rev. Lett. (submitted).
- Zhou and Schulz (1992) C. Zhou and H. J. Schulz, Phys. Rev. B 45, 7397 (1992).
- Sugai and Hosokawa (2000) S. Sugai and T. Hosokawa, Phys. Rev. Lett. 85, 1112 (2000).
- Hunt et al. (1999) A. W. Hunt, P. M. Singer, K. R. Thurber, and T. Imai, Phys. Rev. Lett. 82, 4300 (1999).
- Singer and Imai (2002) P. M. Singer and T. Imai, Phys. Rev. Lett. 88, 187601 (2002).
- Kohsaka et al. (2007) Y. Kohsaka, C. Taylor, K. Fujita, A. Schmidt, C. Lupien, T. Hanaguri, M. Azuma, M. Takano, H. Eisaki, H. Takagi, et al., Nature 315, 1380 (2007).
- Nishida et al. (1990) N. Nishida, S. Okuma, H. Miyatake, T. Tamegai, Y. Iye, R. Yoshizaki, K. Nishiyama, K. Nagamine, R. Kadono, and J. H. Brewer, Physica C 168, 23 (1990).
- Tallon et al. (1994) J. L. Tallon, G. V. M. Willams, M. P. Staines, and C. Bernhard, Physica C 235–240, 1821 (1994).
- Williams et al. (1998) G. V. M. Williams, J. L. Tallon, R. Michalak, and R. Dupree, Phys, Rev. B 57, 8696 (1998).
- Borisenko et al. (2006) S. V. Borisenko, A. A. Kordyuk, V. Zabolotnyy, J. Geck, D. Inosov, A. Koitzsch, J. Fink, M. Knupfer, B. Buchner, V. Hinkov, et al., Phys. Rev. Lett. 96, 117004 (2006).
- Yamamoto et al. (2000) A. Yamamoto, W. Z. Hu, and S. Tajima, Phys. Rev. B 63, 024504 (2000).
- Storey et al. (2006) J. G. Storey, J. L. Tallon, G. V. M. Williams, and S. Narayanaswamy, in Bulletin of the American Physical Society (2006), Z39.00006.
- Hussey et al. (2003) N. E. Hussey, M. Abdel-Jawad, A. Carrington, A. P. Mackenzie, and L. Balicas, Nature 425, 814 (2003).
- Markiewicz et al. (2005) R. S. Markiewicz, S. Sahrakorpi, M. Lindroos, H. Lin, and A. Bansil, Phys. Rev. B 72, 054519 (2005).
- Jorgensen et al. (1991) J. D. Jorgensen, P. Lightfoot, S. Pei, B. Dabrowski, D. R. Richards, and D. G. Hinks, in Advances in Superconductivity III, edited by K. Kajimura and H. Hayakawa (Springer-Verlag, Tokyo, 1991), p. 337.
- Radaelli et al. (1994) P. G. Radaelli, D. G. Hinks, A. W. Mitchell, B. A. Hunter, J. L. Wagner, B. Dabrowski, K. G. Vandervoort, H. K. Viswanathan, and J. D. Jorgensen, Phys. Rev. B 49, 4163 (1994).