Hypernovae and their Gamma-Ray Bursts Connection
Abstract
The connection between long Gamma Ray Bursts (GRBs) and Supernovae (SNe), have been established through the well observed cases of GRB980425/SN 1998bw, GRB030329/SN 2003dh and GRB031203/SN 2003lw. These events can be explained as the prompt collapse to a black hole (BH) of the core of a massive star () that had lost its outer hydrogen and helium envelopes. All these SNe exhibited strong oxygen lines, and their energies were much larger than those of typical SNe, thus these SNe are called Hypernovae (HNe). The case of SN 2006aj/GRB060218 appears different: the GRB was weak and soft (an X-Ray Flash, XRF); the SN is dimmer and has very weak oxygen lines. The explosion energy of SN 2006aj was smaller, as was the ejected mass. In our model, the progenitor star had a smaller mass than other GRB/SNe (), suggesting that a neutron star (NS) rather than a black hole was formed. If the nascent neutron star was strongly magnetized (a so-called magnetar) and rapidly spinning, it may launch a weak GRB or an XRF. The final fate of 20-30 stars show interesting variety, as seen in the very peculiar Type Ib/c SN 2005bf. This mass range corresponds to the NS to BH transition. We also compare the nucleosynthesis feature of HNe with the metal-poor stars and suggest the Hypernova-First Star connection.
keywords:
supernovae; hypernovae; gamma-ray bursts; first stars; nucleosynthesisTo appear in New Astronomy Reviews
“A LIFE WITH STARS”
Amsterdam, 22-26 August 2005
1 Supernovae, Hypernovae, and Gamma-Ray Bursts
Massive stars in the range of 8 to 130 undergo core-collapse at the end of their evolution and become Type II and Ib/c supernovae unless the entire star collapses into a black hole with no mass ejection. These Type II and Ib/c supernovae (as well as Type Ia supernovae) release large explosion energies and eject explosive nucleosynthesis materials, thus having strong dynamical, thermal, and chemical influences on the evolution of interstellar matter and galaxies. Therefore, the explosion energies of core-collapse supernovae are fundamentally important quantities, and an estimate of ergs has often been used in calculating nucleosynthesis and the impact on the interstellar medium. (In the present paper, we use the explosion energy for the final isotropic kinetic energy of explosion.) A good example is SN1987A in the Large Magellanic Cloud, whose energy is estimated to be - 1.5) ergs from its early light curve (nomoto1994b, ).
One of the most interesting recent developments in the study of supernovae (SNe) is the discovery of the connection between long-duration Gamma Ray Bursts (GRBs) and a particular subtype of core-collapse SNe (Type Ic) as has been clearly established from GRB 980425/SN 1998bw gal98 , GRB 030329/SN 2003dh sta03 ; hjo03 , and GRB 031203/SN 2003lw mal04 . These GRB-SNe have similar properties; they are all Hypernovae, i.e., very energetic supernovae, whose isotropic kinetic energy (KE) exceeds erg, about 10 times the KE of normal core-collapse SNe (hereafter erg).
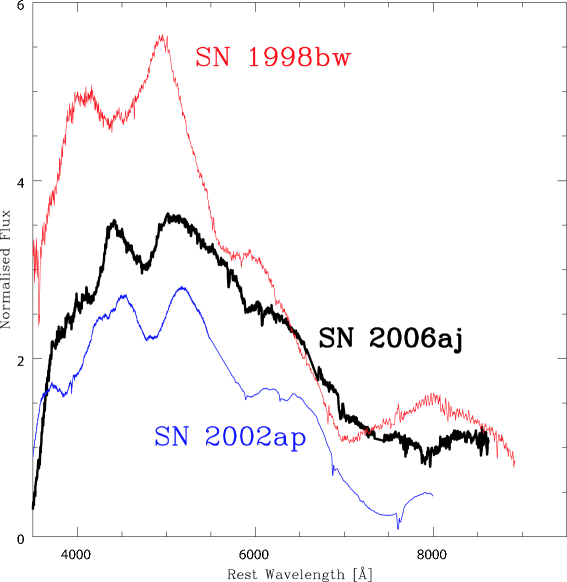
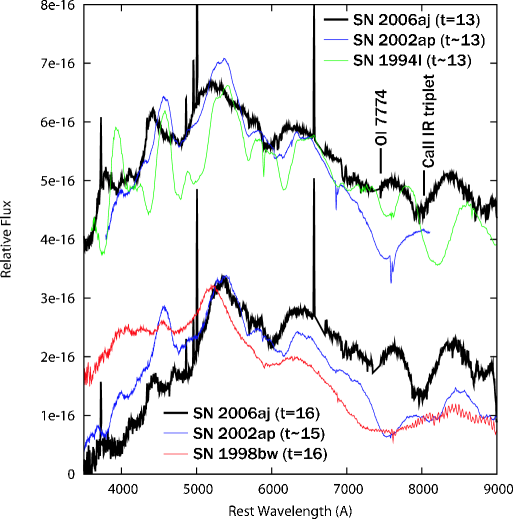
Figure 1 shows the spectrum of SN 1998bw/GRB 980425 a few days before maximum. The spectrum of SN 1998bw has very broad lines, indicative of the large . The strongest absorptions are Ti ii-Fe ii (shortwards of Å, Fe ii-Fe iii (near 4500Å), Si ii (near 5700Å), O i-Ca ii (between 7000 and 8000 Å). From the synthetic spectra and light curves, it was interpreted as the explosion of a massive star, with erg and .iwa98 Also the very high luminosity of SN 1998bw indicates that a large amount of 56Ni () was synthesized in the explosion.
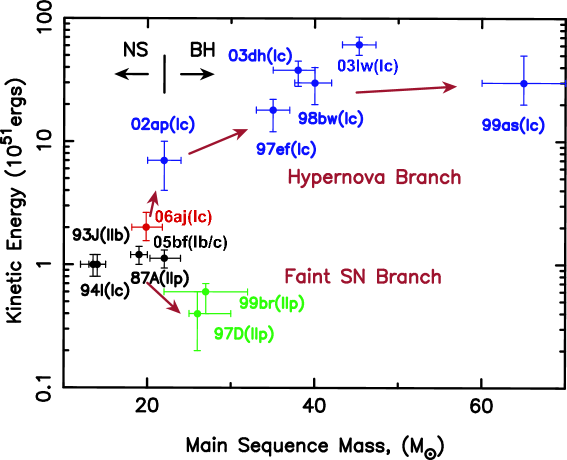
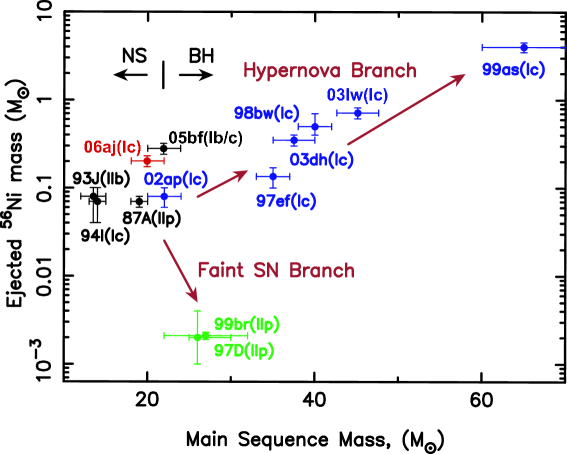
The other two GRB-SNe, 2003dh and 2003lw, are also characterized by the very broad line features and the very high luminosity. and are estimated from synthetic spectra and light curves and summarized in Figure 2nak01a ; mazzali2003 ; deng05 ; maz06a . It is clearly seen that GRB-SNe are the explosions of massive progenitor stars (), have large explosion kinetic energies ( erg), synthesized large amounts of 56Ni (), thus forming the “Hypernova Branch” in Figure 2.
Other “non-GRB Hypernovae”, such as SN 1997ef iwa00 ; maz00 , SN 2002ap maz02 , and SN 2003jd maz05 , have been observed. These HNe show spectral features similar to those of the GRB-SNe but are not known to have been accompanied by a GRB. The estimated and , obtained from synthetic light curves and spectra, show that there is a tendency for non-GRB HNe to have smaller , , and lower luminosities as summarized in Figure 2. For example, SN 2002ap has similar spectral features, but narrower and redder (Fig. 1), which was modeled as a smaller energy explosion, with erg and maz02 .
Recently X-Ray Flash (XRF) 060218 has been found to be connected to SN Ic 2006aj campana2006 ; pian2006 . SN 2006aj is very similar to SN 2002ap, being a less energetic (). However, it differs in the lack of the O i-Ca ii absorption near 7500Å. The progenitor is estimated to be , thus being suggested to be a “neutron star-making SN” mazzali2006b (see §2 for details).
Hypernovae are also characterized by asphericity from the observations of polarization and emission line features (e.g., wang2003, ; kaw02, ; mae02, ). The explosion energy of the aspherical models for hypernovae tends to be smaller than the spherical models by a factor of 2 - 3, but still being as high as mae06LC .
In contrast to HNe, SNe II 1997D and 1999br were very faint SNe with very low KE turatto1998 ; hamuy2003 ; zampieri2003 . In the diagram that shows and the mass of 56Ni ejected Ni) as a function of the main-sequence mass of the progenitor star (Figure 2), therefore, we propose that SNe from stars with have different and Ni), with a bright, energetic “hypernova branch” at one extreme and a faint, low-energy SN branch at the other nomoto2003 . For the faint SNe, the explosion energy was so small that most 56Ni fell back onto the compact remnant (e.g., sollerman1998, ). Thus the faint SN branch may become a “failed” SN branch at larger . Between the two branches, there may be a variety of SNe hamuy2003 ; tominaga2005 .
This trend might be interpreted as follows. Stars more massive than 25 form a black hole at the end of their evolution. Stars with non-rotating black holes are likely to collapse “quietly” ejecting a small amount of heavy elements (Faint supernovae). In contrast, stars with rotating black holes are likely to give rise to Hypernovae. The hypernova progenitors might form the rapidly rotating cores by spiraling-in of a companion star in a binary system.
Here we focus on our findings that SN Ic 2006aj (§2) and SN Ib 2005bf (§3) are very different SNe from previously known SNe/HNe. These properties might be due to their progenitor masses, which indicate that these SNe correspond to the border from the NS and BH formation.
As a related topic, it is of vital importance to identify the first generation stars in the Universe, i.e., totally metal-free, Pop III stars. We examine possible GRB/Hypernova - First Star connection through nucleosnthesis approach nomoto2006 . We summarize nucleosynthesis features in hypernovae, which must show some important differences from normal supernova explosions (§4). This might be related to the unpredicted abundance patterns observed in the extremely metal-poor halo stars. This is one of the important challenges of the current astronomy weiss2000 ; abel2002 .
2 SN 2006aj
GRB060218 is located in a galaxy only Mpc away and it is the second closest event as ever. The GRB was weak campana2006 , as is often the case for nearby ones sod04 , and was classified as X-Ray Flash (XRF) because of its soft spectrum. As the GRB was not followed by a bright afterglow, the presence of a SN 2006aj was soon confirmed pian2006 ; mod06 . Here we summarize the properties of SN 2006aj by comparing with other SNe Ic.
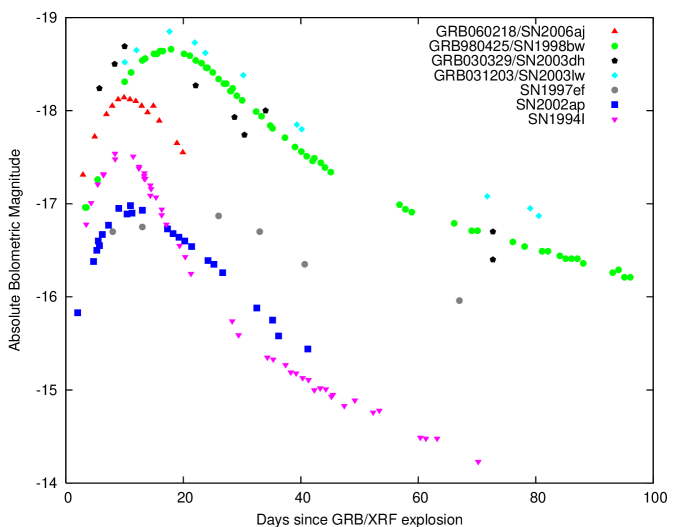
SN 2006aj has several features that make it unique. It is less bright than the other GRB/SNe (Figure 3). Its rapid photometric evolution is very similar to that of a dimmer, non-GRB SN 2002ap maz02 , but it is somewhat faster. Although its spectrum is characterized by broader absorption lines as in SN 1998bw and other GRB/SN, they are not as broad as those of SN 1998bw, and again it is much more similar to that of SN 2002ap (Figure 4). The most interesting property of SN 2006aj is surprisingly weak oxygen lines, much weaker than in Type Ic SNe.
2.1 Spectroscopic Models
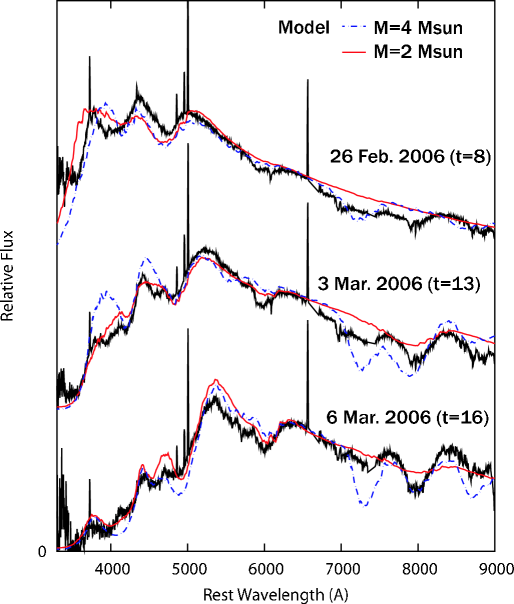
In order to quantify its properties, we modeled the spectra of SN 2006aj with a radiation transfer code as in mazzali2000 . We first employed the same explosion model applied for SN 2002ap maz02 . The model has an ejected mass and a kinetic energy erg. This explosion model gives reasonable fits to the spectra.
However, in order to improve the match, we had to reduce the masses of both oxygen and calcium substantially and reduce accordingly (Figure 5). As a result, we derive for SN 2006aj and erg. Lack of oxygen in the spectra does not necessarily mean absence of oxygen in the ejecta. Our model contains of O, and oxygen is still the dominant element.
The strength of the OI7774 line, which is the strongest oxygen line in optical wavelength, is sensitive to the temperature in the ejecta. Since the fraction of OI is larger in the lower temperature ejecta (although OII is still the dominant ionization state), the normal SNe Ib/c always show the strong OI absorption (see SN 1994I in Fig 4) irrespective of the ejecta mass.
In more luminous SNe like GRB-SNe and SN 2006aj, the OI fraction tends to be smaller. However, if the ejecta are very massive, e.g., , the mass of OI is large enough to make the strong absorption (see SN 1998bw in Fig 4). In the case of SN 2006aj, the temperature is larger than in normal SNe Ib/c. Therefore, the weak OI line indicates that the ejecta mass is not as massive as SN 1998bw, which supports our conclusion.
2.2 Light Curve Models
The spectroscopic results are confirmed through the light curve modeling. The timescale of the LC around maximum brightness reflects the timescale for optical photons to diffuse arn82 . For the more massive ejecta and the smaller kinetic energy, the LC peaks later and the LC width becomes broader becaause it is more difficult for photons to escape.
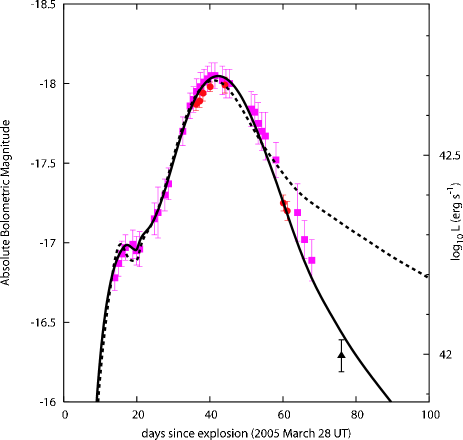
We synthesize the theoretical light curve with the 1-dimensional density and chemical abundance structure that we find in the above spectroscopic analysis. We then compare it with the optical-infrared bolometric light curve of SN 2006aj. The best match to the rapidly rising light curve is achieved with a total 56Ni mass of in which is located above 20,000km s-1(Figure 6). The high-velocity 56Ni is responsible for the fast rise of the light curve, because photons created can escape more easily.
2.3 The Progenitor and Implications for XRF
The properties of the SN 2006aj (smaller energy, smaller ejected mass) suggest that SN 2006aj is not the same type of event as the other GRB-SNe known thus far. One possibility is that the initial mass of the progenitor star is much smaller than the other GRB-SNe, so that the collapse/explosion generated less energy. If the zero-age main sequence mass is , for example, the star would be at the boundary between collapse to a black hole or to a neutron star. In this mass range, there are indications of a spread in both and the mass of 56Ni synthesized hamuy2003 . The fact that a relatively large amount of 56Ni is required in SN 2006aj possibly suggests that the star collapsed only to a neutron star because more core material would be available to synthesize 56Ni in the case.

Although the kinetic energy of erg is larger than the canonical value ( erg, nom94 ) in the mass range of , such an energy may be easily attainable. Additionally, magnetar-type activity may have been present, increasing the explosion energytho04 . It is conceivable that in this weaker explosion than typical GRB-SNe, the fraction of energy channeled to relativistic ejecta is smaller, giving rise to an XRF rather than a classical GRB.
Another case of a SN associated with an XRF has been reported (XRF030723)fyn04 . The putative SN, although its spectrum was not observed, was best consistent with the properties of SN 2002ap tom05 . This may suggest that XRFs are associated with less massive progenitor stars than those of canonical GRBs, and that the two groups may be differentiated by the formation of a neutron star nak98 or a BH. Still, the progenitor star must have been thoroughly stripped of its H and He envelopes, which is a general property of all GRB-SNe and probably a requirement for the emission of a high energy transient. These facts may indicate that the progenitor is in a binary system.
If magnetars are related to the explosion mechanism, some short -ray repeaters energized by a magnetar tho95 ; tho04 may be remnants of GRB060218-like events. Magnetars could generate a GRB at two distinct times. As they are born, when they have a very large spin rate ( ms), an XRF (or a soft GRB) is produced as in SN 2006aj/GRB060218. Later (more than 1,000 yrs), when their spin rate is much slower, they could produce short-hard GRBs hur05 .
Stars of mass are much more common than stars of , and so it is highly likely that events such as GRB060218 are much more common in nature than the highly energetic GRBs. They are, however, much more difficult to detect because they have a low -ray flux. The discovery of GRB060218/SN 2006aj suggests that there may be a wide range of properties of both the SN and the GRB in particular in this mass range. The continuing study of these intriguing events will be exciting and rewarding.
3 SN 2005bf
Peculiar and inhomogeneous natures of supernovae originating from , i.e., boundary between a neutron star formation and a black hole formation, are further highlighted by SN 2005bf. Unlike SN 2006aj/GRB060218, it did not show a high energy transient counter part. However, it did show very unique photometric and spectroscopic behavior. Based on the calculated light curve and the spectra, we believe that SN2005bf fits into the scheme suggested by nom95 which places core-collapse SN in a sequence (IIP-IIL-IIb-Ib-Ic) of increasing mass loss from the progenitor star, and that it originated in collapse of a star with .
SN 2005bf was discovered by mon05 ; moo05 on April 6, 2005 (UT) in the spiral arms of the SBb galaxy MCG +00-27-5. It was initially classified as a Type Ic SN (SN Ic) mor05 ; mod05a . As time went by, He lines were increasingly developed. Then it was classified as Type Ib wan05 ; mod05b . Even stranger, the light curve is very different from any known SN ham05 : a fairly rapid rise to a first peak was followed by a period of stalling or slow decline and by a new rise to a later, brighter peak at days after explosion (Fig. 7). The brightness ( mag) at the relatively slow peak date suggests that a large amount of 56Ni is ejected. SN 2005bf does not show the broad lines seen in hypernovae. These properties make SN 2005bf a very interesting SN.
3.1 Early Phases
To derive physical quantities from observed properties, we first try fitting the light curve covering the first 80 days tom05b . The radioactive decay (56Ni 56Co 56Fe) is responsible for powering the light curve. The theoretical LC width near peak depends on ejected mass and explosion kinetic energy as arn82 ; nom04 . The mass and distribution of 56Ni are constrained by the LC brightness and shape. In general, various combinations of (, ) can fit the LC. The degeneracy can be solved by performing spectral modeling, since the line width is scaled as .
We compute a set of synthetic light curves for a He star model, by varying (, ) and abundance distribution (including distribution of the heating source 56Ni). Parameters are constrained by the observed bolometric light curve (LC) constructed as in yos03 (see Fig. 7). We assumed a Galactic reddening , a distance modulus , and an explosion date of March 28 UT as inferred from the marginal detection on 2005 March 30 UT (moo05, ). The light curve for a model with and is shown as a dashed line in Figure 7.
The model curve yields a nice fit until the second, main peak is reached. However, the observed LC declines rapidly thereafter, unlike other well-observed SNe Ib/c. A possible solution for this is to consider a situation in which the ejecta are more transparent to gamma-rays than in other SNe Ib/c (usually mae06 ). Using at km s-1 the light curve shown in Figure 7 is obtained. The model parameters are the following: , , . The parameters are not so different from those derived without accelerated gamma-ray escape, since the set of (, ) is constrained by the diffusion time scale and expansion time scale, and (56Ni) is determined from the peak brightness. These are basically independent from the LC behavior after the peak date.
To break the degeneracy in (, ) and select the most likely model, synthetic spectra are computed and compared to the observed ones in Figure 8. The model with (, ) = (7, 1.3) provides satisfactory fits for all spectra.
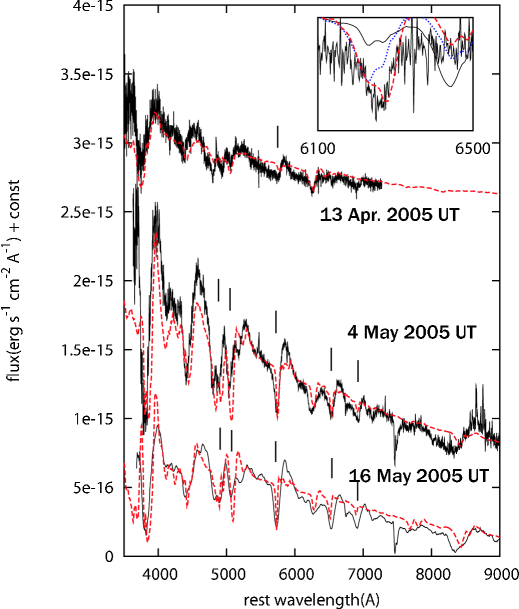
At the time of the first peak (UT April 13, 16 days after explosion; mod05c ) SN 2005bf exhibited SN Ic features, but actually both He and H can be seen as weak features. The feature near 5700Å is probably He I 5876Å. A photospheric velocity of km s-1is obtained by the spectroscopic model. The model with fits better than that with . The feature at 6300Å is partly attributed to H (Fig. 8, inset), indicating presence of of hydrogen above km s-1. The spectra near maximum brightness (UT May 4, 37 days after explosion) and on UT May 16th (49 days) are reasonably reproduced by the same ejecta model, with the photospheric velocity km s-1 and km s-1, respectively.
According to the model, the ejecta properties are derived as follows: and . The ejecta consist of 56Ni () mostly near the center, He (), intermediate mass elements (mainly O, Si, S), and a small amount of H (). Thus the progenitor had lost almost all its H envelope, but retained most of the He-rich layer (a WN star).
The He core mass at the explosion was . The progenitor was probably a WN star of main-sequence mass (nom88, ; ume05, ). The formation of a WN star from a star of only suggests that rotation may have been important (hir05, ), although not sufficient to make SN 2005bf a hypernova. In order to produce 56Ni, the mass cut that separates the ejecta and the compact remnant should be as deep as . This suggests that the remnant was a neutron star rather than a black-hole. The mass range is near the transition from neutron star (SN 2005bf) to black hole formation (SN 2002ap; maz02 ), the exact boundary depending on rotation and mass loss.
The ejecta we derived have small relative to . In this way, relatively delayed peak at days is explined. The rapid rise to the first peak at days requires a small amount of 56Ni () at high velocity ( km s-1), while most of 56Ni is neat the center below km s-1. The high velocity component of 56Ni is at the bottom of the He layer. It may express 56Ni-rich jets or blobs that did not reach the He layer. Such inhomogeneous structure might result in the enhanced -ray escape as is assumed to obtain a better fit to the LC after the second peak.
3.2 Late Phases
At late epochs ( year since the explosion), a SN enters into nebular phases. Then a SN shows optically thin spectra dominated by emission lines arising even from the deepest regions. Thus the nebular phase observations can prove the inner regions of the ejecta, which are not seen at early phases. Spectroscopy and photometry of SN 2005bf have been performed on 2005 December 26 (UT) and on 2006 February 6 with the 8.2 m Subaru telescope equipped with the Faint Object Camera and Spectrograph (FOCAS; kas02 ). Detailed analysis for the late time observation is presented elsewhere mae06b .
Figure 9 shows the reduced spectra of SN 2005bf on 2005 December 26 (days since the putative explosion date). There is a feature at Å with FWHM km s-1. This is most likely Hα emission. This supports the existence of the thin H envelope described in §3.1

The spectrum shows strong forbidden emission lines, in which [OI] 6300, 6363 and [CaII] 7300 are the strongest. Other weak emission features are visible at Å ([FeII]) and Å(CaII IR and [CI] 8727). The [OI] 6300/[CaII] 7300 ratio in SN 2005bf is relatively small, indicating the progenitor star with . A forbidden carbon line [CI] 8727 looks strong, indicating high C/O ratio () in the ejecta. This suggests the progenitor star with . From these analyses, the nebular spectra supports the progenitor mass , as derived in the earlier phases (§3.1).
Profiles of these line profiles are shown in Figure 9. Interestingly, all these lines show blueshift relative to the rest wavelength ( km s-1). A simple and straightforward interpretation is that we see a unipolar explosion, on average moving toward us, as is expected from the fast-moving 56Ni seen in the early phase (§3.1). Another interpretation is self-absorption of the light within the ejecta which reduces the light from the far (therefore red) side. These are thoroughly discussed in Maeda et al. (2007) mae06b .
3.3 Peculiarities
The major features of SN 2005bf can be understood in the context of the explosion of a WN star with the progenitor . However, there are still some questions to be answered, which are probably related to unique natures of the progenitor, the central remnant, and the explosion physics of stars with .
First, in early phases, He lines evolved in their strengths and velocities in a unique way. They become stronger (therefore look like SN Ic first, then like SN Ib afterward) as time goes by. Their velocities are also increased as a function of time. At the first peak, these lines are well explained in LTE level populations. Near maximum brightness (UT May 4, 37 days after explosion) and on UT May 16th (49 days), however, level populations of He ion should be more abundant than in LTE populations by a factor of (at km s-1) and (at km s-1), respectively.
Non-thermal effects resulting from radioactive decay gamma-rays are believed to be essential to populate HeI levels (luc91, ). Why SN 2005bf showed the peculiar evolution of He lines is probably related to its unique 56Ni distribution. This is still an open question, which will probably provide further clue to understand the natures of SN 2005bf.
Another question was brought by the nebular phase observation. The R-band magnitude at 2006 December 26 ( days since the explosion) is , corresponding the absolute magnitude after correcting the distance and the reddening. It is very faint as compared to other SNe Ib/c, at least by 2 magnitudes (e.g., by 3 magnitudes fainter than SN 1998bw at a similar epoch). If the R magnitude is close the bolometric magnitude (which is usually a good approximation for SN Ib/c nebulae if most of the light is emitted in optical ranges), 56Ni required to fit the luminosity is only . Why this is much smaller than that reproducing the early phase peak luminosity (at days) is still to be answered. Several possibilities, including late time fallback of materials onto a central remnant and a magnetar-like activity are worth studying mae06b .
4 Nucleosynthesis in Hypernovae and The First Star Connection
In core-collapse supernovae/hypernovae, stellar material undergoes shock heating and subsequent explosive nucleosynthesis. Iron-peak elements are produced in two distinct regions, which are characterized by the peak temperature, , of the shocked material. For K, material undergoes complete Si burning whose products include Co, Zn, V, and some Cr after radioactive decays. For K K, incomplete Si burning takes place and its decayed products include Cr and Mn (e.g., nakamura1999 ).


4.1 Supernovae vs. Hypernovae
The right panel of Figure 10 shows the composition in the ejecta of a 25 hypernova model (). The nucleosynthesis in a normal 25 SN model () is also shown for comparison in the left panel of Figure 10 umeda2002a .
We note the following characteristics of nucleosynthesis with very large explosion energies nakamura2001b ; nomoto2001 ; ume05 :
(1) Both complete and incomplete Si-burning regions shift outward in mass compared with normal supernovae, so that the mass ratio between the complete and incomplete Si-burning regions becomes larger. As a result, higher energy explosions tend to produce larger [(Zn, Co, V)/Fe] and smaller [(Mn, Cr)/Fe], which can explain the trend observed in extremely metal-poor stars ume05 ; tominaga2005 . (Here [A/B] , where the subscript refers to the solar value and and are the abundances of elements A and B, respectively.)
(2) In the complete Si-burning region of hypernovae, elements produced by -rich freezeout are enhanced. Hence, isotopes synthesized through capturing of -particles, such as 44Ti, 48Cr, and 64Ge (decaying into 44Ca, 48Ti, and 64Zn, respectively) are more abundant.
(3) Oxygen burning takes place in more extended regions for the larger KE. Then more O, C, Al are burned to produce a larger amount of burning products such as Si, S, and Ar. Therefore, hypernova nucleosynthesis is characterized by large abundance ratios of [Si,S/O], which can explain the abundance feature of M82 umeda2002b .
Hypernova nucleosynthesis may have made an important contribution to Galactic chemical evolution. In the early galactic epoch when the galaxy was not yet chemically well-mixed, [Fe/H] may well be determined by mostly a single SN event audouze1995 . The formation of metal-poor stars is supposed to be driven by a supernova shock, so that [Fe/H] is determined by the ejected Fe mass and the amount of circumstellar hydrogen swept-up by the shock wave ryan1996 . Then, hypernovae with larger are likely to induce the formation of stars with smaller [Fe/H], because the mass of interstellar hydrogen swept up by a hypernova is roughly proportional to ryan1996 ; shigeyama1998 and the ratio of the ejected iron mass to is smaller for hypernovae than for normal supernovae.
4.2 EMP Stars from VLT Observations
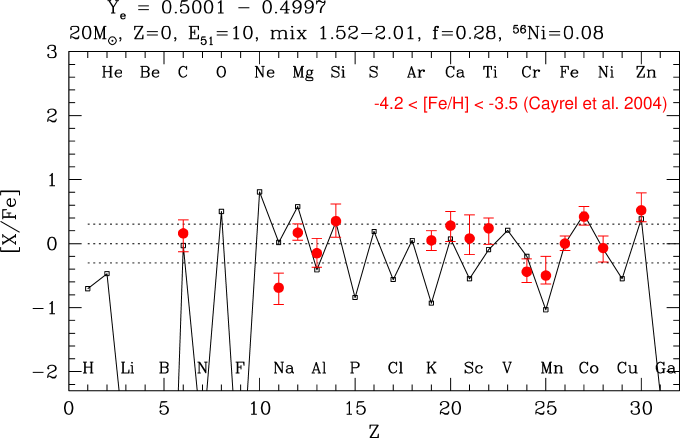
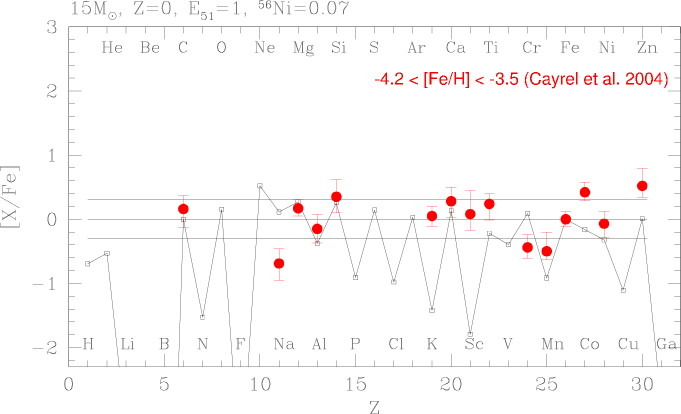
The “mixing and fall back” process can reproduce the abundance pattern of the typical EMP stars without a disagreement between [(light element)/Fe] and [(Fe-peak element)/Fe]. Figure 11 shows that the averaged abundances of [Fe/H] stars in cayrel2004 can be fitted well with the hypernova model of 20 and 10 (upper) but not with the normal SN model of 15 and 1 (lower) tominaga2005 .
4.3 Hypernovae and Zn, Co, Mn, Cr
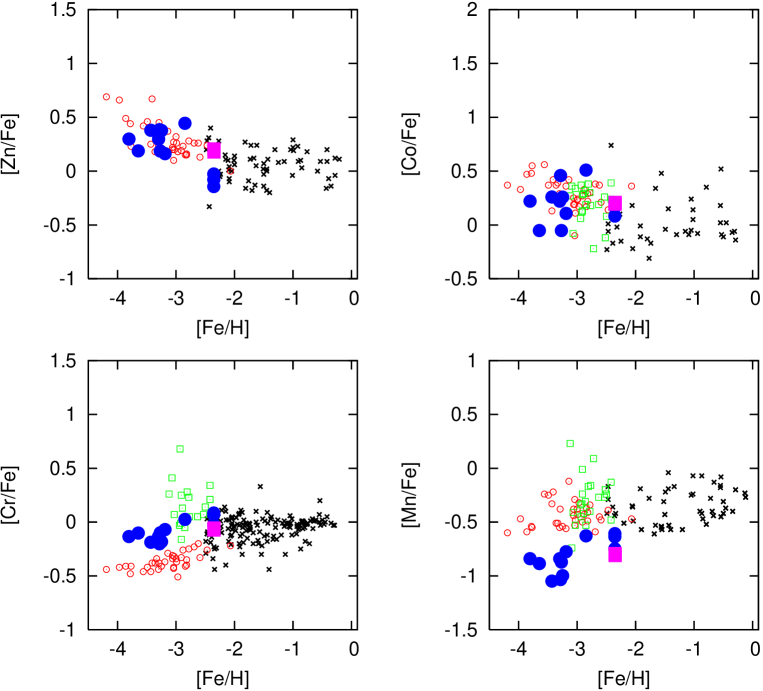
In the observed abundances of halo stars, there are significant differences between the abundance patterns in the iron-peak elements below and above [Fe/H] - (Figure 12).
(1) For [Fe/H], the mean values of [Cr/Fe] and [Mn/Fe] decrease toward smaller metallicity, while [Co/Fe] increases mcwilliam1995 ; ryan1996 .
(2) [Zn/Fe] for [Fe/H] to sneden1991 , while at [Fe/H] , [Zn/Fe] increases toward smaller metallicity cayrel2004 .
The larger [(Zn, Co)/Fe] and smaller [(Mn, Cr)/Fe] in the supernova ejecta can be realized if the mass ratio between the complete Si burning region and the incomplete Si burning region is larger, or equivalently if deep material from the complete Si-burning region is ejected by mixing or aspherical effects. This can be realized if (1) the mass cut between the ejecta and the compact remnant is located at smaller nakamura1999 , (2) is larger to move the outer edge of the complete Si burning region to larger nakamura2001b , or (3) asphericity in the explosion is larger mae03 .
Among these possibilities, a large explosion energy enhances -rich freezeout, which results in an increase of the local mass fractions of Zn and Co, while Cr and Mn are not enhanced umeda2002a . Models with do not produce sufficiently large [Zn/Fe]. To be compatible with the observations of [Zn/Fe] , the explosion energy must be much larger, i.e., for , i.e., hypernova-like explosions of massive stars () with are responsible for the production of Zn.
Figure 12 exhibits that the higher-energy models tend to be located at lower [Fe/H] = log10 (Fe/ (if distribute around a certain peak value), and thus can explain the observed trend.
In the hypernova models, the overproduction of Fe, as found in the simple “deep” mass-cut model, can be avoided with the mixing-fallback model ume05 . Therefore, if hypernovae made significant contributions to the early Galactic chemical evolution, it could explain the large Zn and Co abundances and the small Mn and Cr abundances observed in very metal-poor stars (Fig. 11: tominaga2005 ).
4.4 Pair Instability SNe vs. Core Collapse SNe
In contrast to the core-collapse supernovae of 20-130 stars, the observed abundance patterns cannot be explained by the explosions of more massive, 130 - 300 stars. These stars undergo pair-instability supernovae (PISNe) and are disrupted completely (e.g., umeda2002a ; heger2002 ), which cannot be consistent with the large C/Fe observed in C-rich EMP stars. The abundance ratios of iron-peak elements ([Zn/Fe] and [Co/Fe] ) in the PISN ejecta umeda2002a ; heger2002 , cannot explain the large Zn/Fe and Co/Fe in the typical EMP stars mcwilliam1995 ; norris2001 ; cayrel2004 and CS22949-037 dep02 either. Therefore the supernova progenitors that are responsible for the formation of EMP stars are most likely in the range of , but not more massive than 130 . This upper limit depends on the stability of massive stars.
5 Summary and Discussion
We summarize the properties of core-collapse SNe as a function of the progenitor mass. As seen in Figure 2, three GRB-SNe are all similar Hypernovae (HNe) for their and . For non-GRB HNe, whether the non-dection of GRBs is the effect of different orientations or of an intrinsic property is still a matter of debate, but there is a tendency for them to have smaller and .
5.1 XRFs and GRBs from 20 - 25 Progenitors
The discovery of XRF 060218/SN 2006aj and their properties extend the GRB-HN connection to XRFs and to the HN progenitor mass as low as . The XRF 060218 may be driven by a neutron star rather than a black hole.
The progenitor mass range of 20 - 25 is particularly interesting, because it corresponds to the transition from the NS formation to the BH formation. The NSs from this mass range could be much more active than those from lower mass range because of possibly much larger NS masses (near the maximum mass) or possibly large magnetic field (i.e., Magnetar). Possible XRFs and GRBs from this mass range of 20 - 25 might form a different population.
5.2 The Rate of GRBs
An estimate and a comparison for the rates of hypernovae and GRBs was performed pod04 . Within the substantial uncertainties, the estimates are shown to be quite comparable and give a galactic rate of to for both events. These rates are several orders of magnitude lower than the rate of core-collapse supernovae, suggesting that the evolution leading to an HN/GRB requires special circumstances, very likely due to binary interactions.
The discovery of SN 2006aj/XRF 060218 affects the estimate of the GRB rates. The observations of various bands suggest XRF 060218 is an intrinsically weak and soft event, rather than a classical GRB observed off-axis. The existence of a population of less luminous GRB/XRFs than “classical” GRBs is suggested. Such events may be the most abundant form of X- or gamma-ray explosive transient in the Universe, but instrumental limits allow us to detect them only locally, so that several intrinsically sub-luminous bursts may remain undetected.
If the low-redshift GRBs are really typical of the global GRB population, then their discovery within the current time and sky coverage must be consistent with the local GRB explosion rate as deduced from the very large BATSE GRB sample. Pian et al.pian2006 include this underluminous population, assume no correction for possible collimation, which may vary from object to object, and obtain a local GRB rate of , compared to estimated from the cosmological events only. The local rate of events that give rise to GRBs is therefore at least one hundred times the rate estimated from the cosmological events only (i.e., those observed by BATSE). The fraction of supernovae that are associated with GRBs or XRFs may be higher than currently thought.
Such an estimate is only sketchy and should be taken as an order of magnitude estimate at present. It should, however, improve as more bursts with known redshifts are detected.
5.3 Hypernova-First Star Connection
Based on the results in the earlier section, we suggest that the first generation supernovae were the explosion of 20-130 stars and some of them produced C-rich, Fe-poor ejecta.
This work has been supported in part by the Grant-in-Aid for Scientific Research (17030005, 17033002, 18540231) and the 21st Century COE Program (QUEST) from the JSPS and MEXT of Japan.
References
- (1) Abel, T., Bryan, G.L., & Norman, M.L., Science 295 (2002) 93
- (2) Anupama, G. C., Sahu, D. K., Deng, J., Nomoto, K., Tominaga, N., Tanaka, M., Mazzali, P. A., & Prabhu, T. P. ApJ 631 (2005) L125
- (3) Arnett, W. D. ApJ 253 (1982) 785
- (4) Audouze, J., & Silk, J., ApJ 451 (1995) L49
- (5) Campana, S., et al., Nature 442 (2006) 1008
- (6) Cayrel, R., et al., A&A 416 (2004) 1117
- (7) Deng, J., et al. Astrophys. J. 624, 898 (2005).
- (8) Depagne, E., et al., A&A , 390 (2002) 187
- (9) Fynbo, J.P.U. et al., Astrophys. J. 609 (2004) 962
- (10) Galama, T., et al., Nature 395 (1998) 670
- (11) Hamuy, M., ApJ 582 (2003) 905
- (12) Hamuy, M., Contreras, C., Gonzalez, S., Krzeminski, W. 2005, IAUCirc., 8520
- (13) Heger, A., & Woosley, S.E., ApJ 567 (2002) 532
- (14) Hirschi, R., Meynet, G., & Maeder, A. A&A 433 (2005) 1013
- (15) Hjorth, J., et al., Nature 423 (2003) 847
- (16) Honda, S. et al., ApJ 607 (2004) 474
- (17) Hurley, K., et al. Nature 434 (2005) 1098-1103
- (18) Iwamoto, K., Mazzali, P.A., Nomoto, K., et al., Nature 395 (1998) 672
- (19) Iwamoto, K., Nakamura, T., Nomoto, K., et al., ApJ 534 (2000) 660
- (20) Kashikawa, N. et al. PASJ 54 (2002) 819
- (21) Kawabata, K., et al. ApJ 580 (2002) L39
- (22) Lucy, L. B. ApJ 383 (1991) 308
- (23) Maeda, K., Nakamura, T., Nomoto, K., Mazzali, P.A., Patat, F., & Hachisu, I. ApJ 565 (2002) 405
- (24) Maeda, K. & Nomoto, K., ApJ 598 (2003) 1163
- (25) Maeda, K. ApJ 644 (2006) 385
- (26) Maeda, K., Mazzali, P.A., & Nomoto, K. ApJ 645 (2006) 1331
- (27) Maeda, K. et al. ApJ in press (astroph/07052713)
- (28) Malesani, J., et al., ApJ 609 (2006) L5
- (29) Mazzali, P. A. A&A 363 (2000) 705
- (30) Mazzali, P.A., Iwamoto, K., Nomoto, K., ApJ 545 (2000) 407
- (31) Mazzali, P.A., Deng, J., Maeda, K., Nomoto, K., et al., ApJ 572 (2002) L61
- (32) Mazzali, P.A., et al., ApJ 599 (2003) L95
- (33) Mazzali, P. A., et al. Science 308 (2005) 1284
- (34) Mazzali, P. A., et al. ApJ , 645 (2006a) 1323
- (35) Mazzali, P.A., Deng, J., Nomoto, K., et al., Nature 442 (2006) 1018
- (36) McWilliam, A., Preston, G.W., Sneden, C., Searle, L., AJ 109 (1995) 2757
- (37) Modjaz, M., Kirshner, R., Challis, P., Matheson, T., & Landt, H., 2005a, IAUCirc., 8509
- (38) Modjaz, M., Kirshner, R., & Challis, P. 2005b, IAUCirc., 8522
- (39) Modjaz, M., et al., in preparation
- (40) Monard, L. A. G. 2005, IAUCirc., 8507
- (41) Moore, M. & Li, W. 2005, IAUCirc., 8507
- (42) Morrell, N., Hamuy, M., Folatelli, G., Contreras, C. 2005 IAUCirc., 8509
- (43) Modjaz, M., et al. ApJ 645 (2006) L21
- (44) Nakamura, T., Prog. Theor. Phys. 100 (1998) 921
- (45) Nakamura, T., Umeda, H., Nomoto, K., Thielemann, F.-K., & Burrows, A., ApJ 517 (1999) 193
- (46) Nakamura, T., Mazzali, P.A., Nomoto, K., Iwamoto, K., ApJ 550 (2001a) 991
- (47) Nakamura, T., Umeda, H., Iwamoto, K., Nomoto, K., et al., ApJ 555 (2001b) 880
- (48) Nomoto, K., & Hashimoto, M. Phys. Rep. 163 (1988) 13
- (49) Nomoto, K., et al. Nature 371 (1994) 227
- (50) Nomoto, K., Shigeyama, T., Kumagai, S., Yamaoka, H., & Suzuki, T., in Supernovae, Les Houche Session LIV (1994) ed. S. Bludmann et al. (North-Holland) 489
- (51) Nomoto, K., Iwamoto, K., & Suzuki, T. Phys. Rep. 256 (1995) 173
- (52) Nomoto, K., Mazzali, P.A., Nakamura, T., et al., in Supernovae and Gamma Ray Bursts, eds. M. Livio et al. (Cambridge Univ. Press) (2001) 144 (astro-ph/0003077)
- (53) Nomoto, K., et al., in IAU Symp 212, A massive Star Odyssey, from Main Sequence to Supernova, eds. V.D. Hucht, et al. (San Francisco: ASP) (2003) 395 (astro-ph/0209064)
- (54) Nomoto, K., et al., in Stellar Collapse, ed. C.L. Fryer (Astrophysics and Space Science: Kluwer) (2004) 277 (astro-ph/0308136)
- (55) Nomoto, K., Tominaga, N., Umeda, H., Kobayashi, C., & Maeda, K., Nuclear Phys A 777 (2006) 424 (astro-ph/0605725)
- (56) Norris, J.E., Ryan, S.G., & Beers, T.C., ApJ 561 (2001) 1034
- (57) Pian, E., et al., Nature 442 (2006) 1011
- (58) Podsiadlowski, Ph. et al. ApJ 607 (2004) L17
- (59) Ryan, S.G., Norris, J.E., & Beers, T.C., ApJ 471 (1996) 254
- (60) Shigeyama, T., & Tsujimoto, T., ApJ 507 (1998) L135
- (61) Sneden, C., Gratton, R.G., & Crocker, D.A., A&A 246 (1991) 354
- (62) Soderberg, A. M., et al. Nature 430 (2004) 648
- (63) Sollerman, J., Cumming, R., & Lundqvist, P., ApJ 493 (1998) 933
- (64) Stanek, K.Z., et al., ApJ 591 (2003) L17
- (65) Thompson, T.A., & Duncan, R.C. Mon. Not. Royal Astron. Soc. 275 (1995) 255
- (66) Thompson, T.A., Chang, P., & Quataert, E. ApJ 611 (2004) 380
- (67) Tominaga, N. et al. ApJ 612 (2005) L105
- (68) Tominaga, N. et al. ApJ 633 (2005) L97
- (69) Tominaga, N., Umeda, H., Nomoto, K. ApJ 660 (2007) 516
- (70) Turatto, M., Mazzali, P.A., Young, T., Nomoto, K., et al., ApJ 498 (1998) L129
- (71) Umeda, H., & Nomoto, K., ApJ 565 (2002) 385
- (72) Umeda, H., Nomoto, K., Tsuru, T., & Matsumoto, H., ApJ 578 (2002) 855
- (73) Umeda, H., & Nomoto, K., ApJ 619 (2005) 427
- (74) Wang, L., Baade, D., Höflich, P., & Wheeler, J.C., ApJ 592 (2003) 457
- (75) Wang, L., & Baade, D. 2005, IAUCirc., 8521
- (76) Weiss, A., Cassisi, S., Schlattl, H., & Salaris, M., ApJ 533 (2000) 413
- (77) Yoshii, Y. et al. ApJ 592 (2003) 467
- (78) Zampieri, L., et al., MNRAS 338 (2003) 711