E. V. Malogolovets,
GJ 900: A new hierarchical system with low-mass components
Abstract
Speckle interferometric observations made with the 6 m telescope of the Special Astrophysical Observatory of the Russian Academy of Sciences in 2000 revealed the triple nature of the nearby ( mas) low-mass young ( Myr) star GJ 900. The configuration of the triple system allowed it to be dynamically unstable. Differential photometry performed from 2000 through 2004 yielded - and -band absolute magnitudes and spectral types for the components to be =6.660.08, =9.150.11, =10.080.26, =4.840.08, =6.760.20, =7.390.31, K5–K7, M3–M4, M5–M6. The “mass–luminosity” relation is used to estimate the individual masses of the components: 0.64, 0.21, 0.13. From the observations of the components relative motion in the period 2000–2006, we conclude that GJ 900 is a hierarchical triple star with the possible orbital periods PA-BC80 yrs and PBC20 yrs. An analysis of the 2MASS images of the region around GJ 900 leads us to suggest that the system can include other very-low-mass components.
1 INTRODUCTION
In the solar neighborhood M-type dwarfs make up about 70% and no less than 40% of all population in terms of the number of stars and mass, respectively. The lifetime of the lowest-luminosity main-sequence stars exceeds the age of the Universe, making them good candidate objects for the study of the properties of the Galactic disk including the history of star formation in the local volume.
The study of young M-type field dwarfs may lead to the discovery of systems with brown dwarfs. The interest toward the discovery and study of multiple systems with substellar components has been growing progressively since the discovery of the first brown dwarf GJ 229 B ([Nakajima et al., 1995]). It is evident that such objects can be found only at small distances from the Sun. An example of such objects is the group of brown dwarfs GJ 569 B, which had its first orbit and dynamical masses estimated from the results of observations made with three major telescopes: the 6 m Bolshoi Azimuthal Telescope (BTA) of the Special Astrophysical Observatory of the Russian Academy of Sciences, Keck II, and MMT ([Kenworthy et al., 2001]).
Until recently, the review by Henry and McCarthy ([Henry & McCarthy, 1993]) remained the most representative summary of empirical data on the masses and luminosities of cool dwarfs obtained using various observational techniques. In recent years, new data on the principal parameters of low-mass stars in binary and multiple systems have been published. These data were obtained by combining different observational methods: adaptive optics imaging combined with accurate radial-velocity measurements ([Segransan et al., 2000]), speckle and long-baseline interferometry with radial velocities measurements ([Balega et al., 2007]; [Boden et al., 2006]), and space astrometry performed with fine guidance sensors of the Hubble Space Telescope ([Torres et al., 1999]; [Benedict et al., 2000]). These studies allowed the main empirical relations to be substantially refined ([Delfosse et al., 2000]). This concerns, in particular, the “mass–luminosity” relation, which is of great importance for the investigation of parameters of individual stars and of the entire population of our Galaxy.
In 1998, a speckle interferometric survey of low-mass binaries and suspected binaries discovered by Hipparcos ([Perryman et al., 1997]) astrometric satellite was started at the BTA 6 m telescope ([Balega et al., 2002]). Observations were performed at visual and infrared wavelengths with the aim to identify pairs with fast relative motion of components, which allow model-independent masses to be determined over a short time interval. In addition to measuring relative component positions with an accuracy of about 1–2 milliarcseconds (mas), we also measured the magnitude differences in the , , , , , and bands for most of the binaries. Objects of this program include the red star GJ 900=Hip 116384 with the Hipparcos ([Perryman et al., 1997]) parallax of =51.801.74 mas. The results of astrometric measurements of this star allowed it to be suspected as a binary based on a number of indicators (the object has flag ‘S’ in the Hipparcos catalog; see ([Lindegren, 1997])) and that is why we included it into our program list.
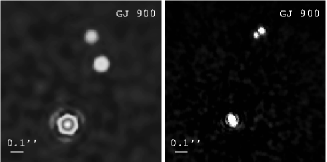
The very first interferometric observations performed in November 2000 with BTA showed GJ 900 to be a triple system ([Balega et al., 2006]). On the reconstructed image two fainter components are located and from the main star. The compact configuration of the GJ 900 system may indicate that it belongs to the class of dynamically unstable multiple stars. One must, however, bear in mind that the components of this system may appear to be located at a comparable distances from the main star only in the sky-plane projection. To verify these assumptions, we included this system into the program of monitoring of the relative motion of components.
In 2002–2003, Martin ([Martin, 2003]) observed GJ 900 with the CIAO adaptive optics system of the 8.2 m Subaru Telescope and confirmed the two faint companions of the central object. The results of two observations in the infrared bands and separated only by a five-month interval led him to conclude that the system is dynamically bound.
In this paper we report the results of the interferometric measurements of positional parameters and magnitude differences of the components of GJ 900 made during the period from November, 2000 through December, 2006, determine the absolute magnitudes and estimate the masses of the stars. We analyze the possible dynamical stability of the system based on the observations performed.
2 OBSERVATIONS AND DATA ANALYSIS
Speckle interferometric observations of GJ 900 were made with the BTA 6 m telescope in the (=550/30 nm), (=800/100 nm), and (=2115/214 nm) bands, where is the central wavelenght, is the half-width of the band. A fast 512512 Sony ICX085 CCD combined with a three-stage image intensifier was used as a detector from 2000 through 2004. During our 2006 observations we employed a new EMCCD (Electron Multiplying Charge Coupled Device) system with higher quantum efficiency and linearity. The image scale was equal to 4.1 and 6.7 mas/pixel for the first and second facilities, respectively. The exposure time of speckle interferograms varied from 5 to 20 msec depending on brightness of an object and seeing conditions. Infrared observations were made with HAWAII infrared detector of the Max-Planck-Institute for Radio Astronomy. Table1 gives a log of observations. This table gives the following data for each measurement: date as a fraction of Besselian year, seeing in arcseconds, the number of speckle interferograms in each series, and the name of the filter.
| Date | N | Filter | |
| arcsec | |||
| 2000.8754 | 1.5 | 900 | I |
| 2003.7880 | 1 | 1000 | K |
| 2003.9248 | 1.5 | 2000 | I |
| 2004.8208 | 1 | 2000 | I |
| 2006.9465 | 1 | 2000 | V |
| 2006.9465 | 1 | 2000 | I |
The angular distances , position angles , and magnitude differences between the components m from speckle interferometric observation with the BTA telescope are given in Table 2. Due to low signal-to-noise ratio in the 2006.9465 measurements in -band, the relative positions for this data are not presented in the table. A description of the technique of the determination of relative positions and component magnitude differences inferred from the averaged over the series power spectra of speckle interferograms can be found in the paper by Balega et al. ([Balega et al., 2002]). The resolution diffraction limit was equal to , , and in the , , and bands, respectively. The accuracy of the measurement of position parameters is equal to 0.3–1.0∘ and 3–8 mas in position angle and angular separation , respectively. The errors of measured and depend on a number of parameters: component separation, magnitude differences, and seeing . The accuracy of the determination of component magnitude differences from the reconstructed power spectra is also a function of the same parameters. This accuracy varies from 0.05 to 0.2 for objects with =8–10. The modulus of the Fourier transform of the object (visibility) was obtained from the series of speckle interferograms with the classical speckle interferometry method. For image reconstruction we used the bispectrum speckle interferometry method ([Weigelt, 1977]; [Lohmann et al., 1983]). Fig. 1 shows the reconstructed infrared and visual images of GJ 900 based on observations made in 2003 and 2006.
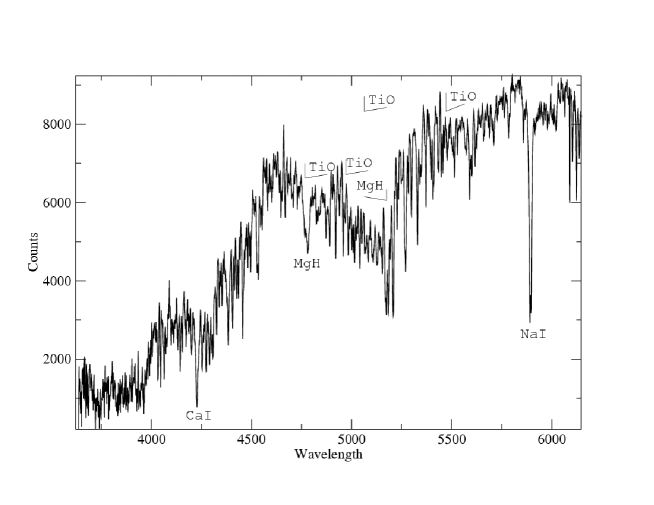
To specify the spectral type of the object, the 3600 – 6200 Å spectrum of the object was taken in October 2006 with the UAGS spectrograph of the Zeiss-1000 telescope with a dispersion of 1.35 Å/pixel 2.
3 ABSOLUTE MAGNITUDES, MASSES AND SPECTRAL TYPES OF THE COMPONENTS
To compute the - and -band absolute magnitudes of the components of GJ 900, we used the results of differential speckle photometry performed with the BTA telescope (Table 2) and published integrated magnitudes of the system in these bands. For the sake of completeness, this table also includes the photometric data from ([Martin, 2003]). The component magnitude differences determined using the results of speckle interferometry performed with BTA agree, on the whole, with those inferred from observations performed with the Subaru Telescope adaptive optics. At the same time, the results of differential photometry do not rule out the variability of one or several components of the system. The integrated -band magnitude determined from the color index of the system, ([Bessel, 1990]), and the visual magnitude adopted from ([Salim & Gould, 2003]) is equal to =7.94. The integrated -band magnitude is equal to =6.010.01 ([Alonso et al., 1994]). We combine these data with the Hipparcos parallax and magnitude differences from Table 2 to infer the following estimates for the absolute magnitudes of the components of GJ 900:
=6.660.08, =4.840.08,
=9.150.11, =6.760.20,
=10.080.26, =7.390.31,
where for the band we used the mean result averaged over two observations made with the BTA 6 m telescope: =2.490.07, and . The -band component magnitude differences measured using adaptive optics ([Martin, 2003]) yield the following absolute magnitudes for the components:
=5.110.08,
=6.850.09,
=7.540.15.
| Date, | Component | Filter | Reference | ||||||
|---|---|---|---|---|---|---|---|---|---|
| BY | vector | mas | mas | ||||||
| 2000.8754 | AB | 417 | 3 | 316.4 | 0.4 | 2.42 | 0.15 | ([Balega et al., 2006]) | |
| AC | 716 | 5 | 344.3 | 0.4 | 3.65 | 0.22 | |||
| BC | 399 | 6 | 13.6 | 0.6 | |||||
| 2002.5990 | AB | 510 | 10 | 324.5 | 0.1 | 1.78 | 0.02 | ([Martin, 2003]) | |
| AC | 760 | 10 | 344.0 | 0.1 | 2.55 | 0.03 | |||
| 2002.5990 | AB | 510 | 10 | 324.5 | 0.1 | 1.61 | 0.03 | ([Martin, 2003]) | |
| AC | 760 | 10 | 344.0 | 0.1 | 2.38 | 0.04 | |||
| 2003.0480 | AB | 520 | 20 | 327.4 | 0.1 | 1.70 | 0.04 | ([Martin, 2003]) | |
| AC | 740 | 20 | 343.9 | 0.1 | 2.31 | 0.06 | |||
| 2003.7880 | AB | 557 | 5 | 331.3 | 0.6 | 1.92 | 0.18 | This paper | |
| AC | 733 | 6 | 345.1 | 0.6 | 2.55 | 0.30 | |||
| BC | 234 | 4 | 19.9 | 1.0 | 0.63 | 0.35 | |||
| 2003.9248 | AB | 559 | 4 | 331.7 | 0.4 | This paper | |||
| AC | 726 | 5 | 345.1 | 0.4 | |||||
| BC | 224 | 6 | 20.4 | 0.6 | |||||
| 2004.8208 | AB | 606 | 3 | 335.8 | 0.3 | 2.56 | 0.06 | This paper | |
| AC | 714 | 4 | 345.5 | 0.4 | 3.18 | 0.22 | |||
| BC | 155 | 5 | 26.7 | 0.5 | |||||
| 2006.9465 | AB | 751 | 3 | 342.5 | 0.3 | This paper | |||
| AC | 708 | 8 | 344.7 | 0.7 | |||||
| BC | 51 | 9 | 130.3 | 0.8 |
The luminosities of the components allow their masses to be estimated from the “mass–luminosity” relation, however, to do this, we must know the age and metallicity of the system.
Gizis et al. ([Gizis et al., 2002]) compared the activity of a large sample of nearby M-type field dwarfs with the activity of M-type dwarfs in open clusters and calibrated the “age–activity” relation. We use the relation to infer an age of 108 Myr for the adopted distance modulus of –=1.43. X-ray luminosity of late-type stars is yet another indicator of their activity. According to observations, the X-ray luminosity of GJ 900 is equal to erg/s ([Huensch et al., 1999]). This value corresponds to the M-dwarf age of 100–200 Myr.
The fluxes in the CaII H and K and MgII h and k lines are good indicators of stellar activity and hence of stellar age ([Soderblom et al., 1991]; [Wilson, 1963]). However, no relations for age as a function of these indicators have been derived for stars of spectral types later than K. The only solution is to compare GJ 900 with stars having similar spectra with the age determined using other methods. For GJ 900 Giampapa et al. ([Giampapa et al., 1989]) report CaII H and K line flux measurements: erg/scm2. We adopted the MgII-line flux erg/scm2 from ([Panagi & Mathioudakis, 1993]). For comparison, we selected two stars of similar spectral types: GJ 212 and GJ 879. The CaII H and K line fluxes of these stars are equal to erg/scm2 ([Stauffer & Hartmann, 1986]; [Rutten et al., 1989]) and erg/scm2 ([Robinson et al., 1990]; [Rutten et al., 1991]), respectively. The MgII h and k line fluxes are equal to erg/scm2 ([Panagi & Mathioudakis, 1993]) and erg/scm2, respectively ([Panagi & Mathioudakis, 1993]). The ages of these stars were inferred from kinematics, isochrones, and lithium abundance and vary from 100 to 200 Myr.
Zuckerman et al. ([Zuckerman et al., 2006]) believe GJ 900 to be a possible member of the Carina-Near moving group with an estimated age of 200 50 Myr. However, the star’s membership in this group is doubtable. The radial velocity of GJ 900 is equal to –10 km/s and differs strongly from that of the core of the group (+20 km/s ([Zuckerman et al., 2006])). The center of the moving group is at a distance of 30–50 pc from us, whereas GJ 900 is located within mere 19 pc from the Sun. The equivalent width of the LiI 6708 line ([Zboril & Byrne, 1998]) in the spectrum of GJ 900 is several factors of ten smaller than in that of the corresponding lines in the spectra of the main members of the group.
Martin ([Martin, 2003]) used the results of the kinematical survey of Montes et al. ([Montes et al., 2001]) to estimate the age of the star at 50–100 Myr.
Thus all the available observational data indicate that GJ 900 is a young system with the age of about 200100 Myr.
Since GJ 900 is located in the immediate proximity to the Sun (d=19.3 pc) and belongs to the galactic disk population, we can suppose that its metal abundance is close to the Sun’s value. This assumption is supported by the results of spectroscopic study of the system performed by Zboril and Byrne ([Zboril & Byrne, 1998]). They give the metallicity of the star [M/H]=-0.10.2.
Zboril and Byrne ([Zboril & Byrne, 1998]) determined the effective temperature of GJ 900 from sensitive photospheric lines and molecular bands with the allowance for surface gravity and microturbulence. Their estimate, Teff=4000 K, is lower by 200 K than the temperature inferred from the – and – color indices ([Gliese & Jahreiss, 1991]). It is evident that this temperature and the corresponding spectral type K7 refer to the main component of the system.
Speckle interferometric measurements of the -band component magnitude differences and adaptive optics measurements in the and bands allow the effective temperature and hence the spectral type of the primary component to be estimated using the calibrated relation between temperature and – and – color indices ([Alonso et al., 1996]). To estimate the -band luminosity of the primary component, we used the , , and -band absolute magnitudes and theoretical isochrones for the age of 200 Myr ([Baraffe et al., 1998]). The mean inferred from three isochrones is equal to 8.350.07. In this case, given the distance modulus of , the color indices of the primary should be equal to (–)A=1.700.08 and (–)A=3.520.09. The calibration of temperature in terms of color index derived by Alonso et al. ([Alonso et al., 1996]) depends only slightly on the metallicity of the star. We assume that iron abundance is equal to the solar value to infer from the estimated (–)A and (–)A indices the temperature of component GJ 900 A, T=4079180 K, which corresponds to a late K-type dwarf.
An analysis of the GJ 900 spectrum obtained with the UAGS spectrograph on the Zeiss-1000 telescope showed that the energy distribution and relative intensities of single strong lines correspond to those of a K5–K7-type star (Fig. 2). The characteristic features of the spectrum include strong TiO and MgH absorption bands.
For the age of 100–200 Myr and solar chemical composition the and evolutionary tracks for low-mass stars computed by Baraffe et al. ([Baraffe et al., 1998]) imply a primary-component mass in the interval from 0.64 to 0.67 . This mass agrees best with the primary spectral type of K5 – K7. The masses of lower-mass components B and C inferred from the same tracks show a much greater scatter. The mass of GJ 900 B is estimated to range from 0.28 to 0.34 , and that of GJ 900 C, from 0.16 to 0.24 . Note the scatter of possible masses is even greater when estimated from the -band photometry of the stars studied. The resulting mass estimates correspond to the spectral types of M3 – M4 and M5 – M6 for the second and third components, respectively.
4 RELATIVE MOTION OF COMPONENTS, LIKELY ORBITAL PERIODS, AND THE DYNAMICAL STABILITY OF THE SYSTEM
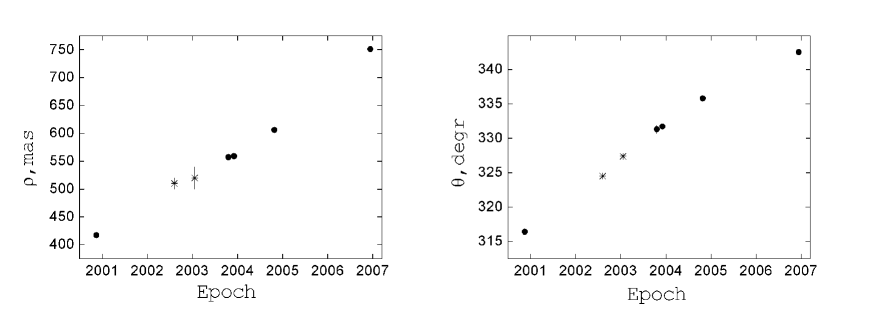
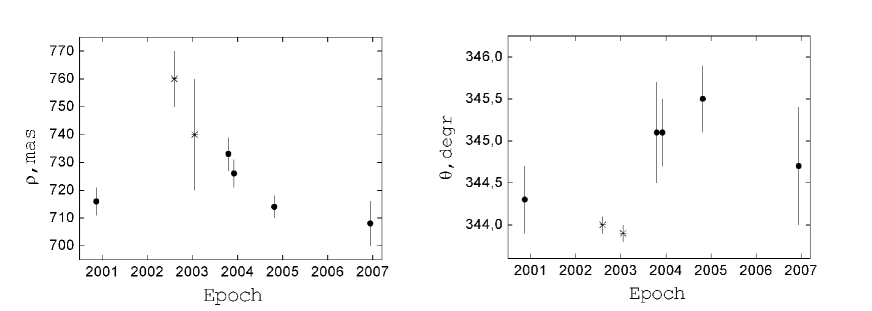
The proper motion of GJ 900 is equal to 344 mas/yr. If we were dealing with accidental projection, components B and C would have shifted by almost 2 relative to component A during the observing period from 2000 to 2006. However, the mutual positions of these components changed insignificantly during our monitoring program (Fig. 3 and 4). The average annual variation in the positional parameters of component B relative to component A was equal to 4.3∘ and 55 mas in position angle and angular separation, respectively. The variation of the position of component C relative to component B is equal to 19.2∘/yr and 57 mas/yr for and , respectively. It follows from the relative position changes that the components B and C form the inner short-period subsystem, which moves with the component A around the GJ 900 mass center. The average annual variations of the positional parameters imply an orbital period of about 80 and 20 years for the subsystems A-BC and BC, respectively. Thus GJ 900 is a gravitationally bound hierarchical multiple system. The planes of the orbital motion of components in the subsystem BC and of component A are tilted most probably at a large angle to each other, resulting in the observed configuration.
5 THE PRESENCE OF EXTRA COMPONENTS IN THE SYSTEM
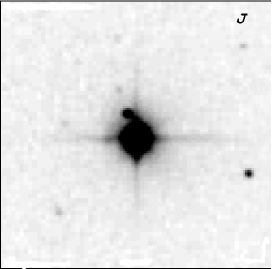
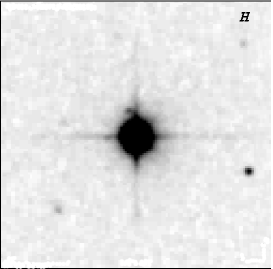
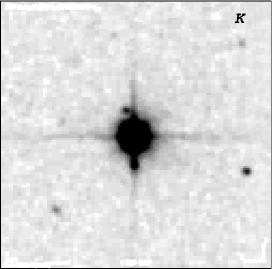
To find the eventual faint components in the GJ 900 system, we analyzed the 2MASS images ([Skrutskie et al., 2006]) taken in August, 2000. We found on the -, -, and -band images a faint companion of 12–13 magnitude Northeast of the central object (Fig.5). The -band image also shows another component, at South of the central source. The probability for a star to be located accidentally within the 30-arcsec field in the region studied is equal to about one percent. Hence GJ 900 is very likely to be a quadruple or even a quintuple system. From the intensity ratio it follows that the faint components are late M dwarfs.
To verify these hypotheses, -band images of the GJ 900 vicinity were taken by A.V. Moiseev in February 2007 with the SCORPIO focal reducer on the BTA telescope. We took and then averaged 25 ten-second exposures. The limiting magnitude of the resulting image is 17m, but we found no objects at the location of the Northeastern component. This result suggests that either this component is too red to be seen in the band — and this assumption is supported by the absence of the object on the -band plate of the DSS2 survey — or that, because of the proper motion of the component or that of GJ 900, this object is now projected onto GJ 900. Hence infrared photometry is needed to make the final conclusion about the membership of components in the multiple system. If the components found do not belong to the multiple system GJ 900, they should shift considerably relative to GJ 900 since the time when the corresponding 2MASS images were taken. If the relative positions of these components remain unchanged, this object would be a unique low-mass multiple system, which is of interest for testing the theory of star formation and dynamical evolution of stars.
6 CONCLUSIONS
Speckle interferometric observations made with BTA 6 m telescope during the period from 2000 to 2006 showed that GJ 900 is a gravitationally bound triple star. This system belongs to the population of the thin disk of the Galaxy and has an age of 200100 Myr. The absolute magnitudes of the components are: =6.660.08, =9.150.11, =10.080.26, =4.840.08, =6.760.20, and =7.390.31 and correspond to the spectral types of K5–K7, M3–M4, and M5–M6. We used the evolutionary tracks of Baraffe et al. ([Baraffe et al., 1998]) to compute the component masses for the solar metallicity and for the age of 200100 Myr: 0.64–0.67, 0.28–0.34, 0.16–0.24. The estimated masses and absolute magnitudes of the components agree with the results obtained in the and bands with the Subaru Telescope adaptive optics ([Martin, 2003]).
We estimated the orbital periods of the components, 20 yr and 80 yr, and concluded that GJ 900 is an hierarchical multiple star. We explain the comparable mutual angular separations between the components by the effect of sky-plane projection.
We examined the -, -, and -band images of the 2MASS survey and found possible distant components of the GJ 900 system at 12 and 15. If these components are gravitationally bound to the triple star, GJ 900 should be a young quintuple system of red dwarfs.
Acknowledgements.
We are grateful to A. Burenkov for taking and reducing a spectrum of GJ 900 with the Zeiss-1000 telescope as well as to A. Moiseev for taking direct images of the object studied with the BTA 6 m telescope. This research has made use of the SIMBAD database, operated at CDS, Strasbourg, France. We acknowledge support from Russian Foundation for Basic Research through research grant 07-02-01489.References
- [Nakajima et al., 1995] T. Nakajima, B. R. Oppenheimer, S. R. Kulkarni, et al., Nature 378, 463 (1995).
- [Kenworthy et al., 2001] M. Kenworthy, K.-H. Hofmann, L. Close, et al., Astrophys. J. 554, L67 (2001).
- [Henry & McCarthy, 1993] T. J. Henry and D. W. McCarthy, AJ 106, 773 (1993).
- [Segransan et al., 2000] D. Segransan, X. Delfosse, T. Forveille, et al., \aaa 364, 665 (2000).
- [Balega et al., 2007] Y. Y. Balega, J.-L. Beuzit , X. Delfosse, et al., \aaa 464, 635 (2007).
- [Boden et al., 2006] A. F. Boden, G. Torres, and D. W. Latham, Astrophys. J. 644, 1193 (2006).
- [Torres et al., 1999] G. Torres, T. J. Henry, O. G. Franz, and L. H. Wasserman, AJ 117, 562 (1999).
- [Benedict et al., 2000] G. F. Benedict, B. E. McArthur, O. G. Franz, et al., AJ 120, 1106 (2000).
- [Delfosse et al., 2000] X. Delfosse, T. Forveille, D. Segransan, et al., \aaa 364, 217 (2000).
- [Perryman et al., 1997] M. A. C. Perryman, ESA, The Hipparcos and Tycho Catalogues (ESA Publ. Division, SP–1200, 1997).
- [Balega et al., 2002] I. I. Balega, Y. Y. Balega, K.-H. Hofmann, et al., \aaa 385, 87 (2002).
- [Lindegren, 1997] L. Lindegren, in Proceedings of the ESA Symposium “Hipparcos – Venice ’97”, 13-16 May, Venice, Italy (ESA SP-402, Venice, 1997), p. 13-18.
- [Balega et al., 2006] I. I. Balega, Y. Y. Balega, A. F. Maksimov, et al., \bsao 59, 20 (2006).
- [Martin, 2003] E. L. Martin, AJ 126, 918 (2003).
- [Weigelt, 1977] G. Weigelt, Opt. Commun. 21, 55 (1977).
- [Lohmann et al., 1983] A. W. Lohmann, G. Weigelt, and B. Wirnitzer, Appl. Opt. 22, 4028 (1983).
- [Bessel, 1990] M. S. Bessel, \aas 83, 357 (1990).
- [Salim & Gould, 2003] S. Salim and A. Gould, Astrophys. J. 582, 1011 (2003).
- [Alonso et al., 1994] A. Alonso, S. Arribas, and C. Martinez-Roger, \aas 107, 365 (1994).
- [Gizis et al., 2002] J. E. Gizis, I. N. Reid, and S. I. Hawley, AJ 123, 3356 (2002).
- [Huensch et al., 1999] M. Huensch, J. H. M. M. Schmitt, M. F. Sterzik, and W. Voges, \aas 135, 319 (1999).
- [Soderblom et al., 1991] D. R. Soderblom, D. K. Duncan, and D. R. H. Johnson, Astrophys. J. 375, 722 (1991).
- [Wilson, 1963] O. C. Wilson, Astrophys. J. 138, 832 (1963).
- [Giampapa et al., 1989] M. S. Giampapa, L. E. Cram, and W. J. Wild, Astrophys. J. 345, 536 (1989).
- [Panagi & Mathioudakis, 1993] P. M. Panagi and M. Mathioudakis, \aas 100, 343 (1993).
- [Stauffer & Hartmann, 1986] J. R. Stauffer and L. W. Hartmann, ApJS 61, 531 (1986).
- [Rutten et al., 1989] R. G. M. Rutten, C. J. Schrijver, C. Zwaan, et al., \aaa 219, 239 (1989).
- [Robinson et al., 1990] R. D. Robinson, L. E. Cram, and M. S. Giampapa, ApJS 74, 891 (1990).
- [Rutten et al., 1991] R. G. M. Rutten, C. J. Schrijver, A. F. P. Lemmens, and C. Zwaan, \aaa 252, 203 (1991).
- [Zuckerman et al., 2006] B. Zuckerman, M. S. Bessel, I. Song, and S. Kim, Astrophys. J. 649, 115 (2006).
- [Zboril & Byrne, 1998] M. Zboril and P. B. Byrne, MNRAS 299, 753 (1998).
- [Montes et al., 2001] D. Montes, J. Lopez-Santiago, M. C. Galvez, et al., MNRAS 328, 45 (2001).
- [Gliese & Jahreiss, 1991] W. Gliese and H. Jahreiss, CD-ROM (NASA/Astronomical Data Center, Goddard Space FlightCenter, Greenbelt, MD, 1991).
- [Alonso et al., 1996] A. Alonso, S. Arribas, and C. Martinez-Roger, \aaa 313, 873 (1996).
- [Baraffe et al., 1998] I. Baraffe, G. Chabrier, F. Allard, and P. H. Hauschildt, \aaa 337, 403 (1998).
- [Skrutskie et al., 2006] M. F. Skrutskie, R. M. Cutri, R. Stiening, et al., AJ 131, 1163 (2006).