Node Similarity Within Subgraphs of Protein Interaction Networks
Abstract
We propose a biologically motivated quantity, twinness, to evaluate local similarity between nodes in a network. The twinness of a pair of nodes is the number of connected, labeled subgraphs of size in which the two nodes possess identical neighbours. The graph animal algorithm is used to estimate twinness for each pair of nodes (for subgraph sizes to ) in four different protein interaction networks (PINs). These include an Escherichia coli PIN and three Saccharomyces cerevisiae PINs – each obtained using state-of-the-art high throughput methods. In almost all cases, the average twinness of node pairs is vastly higher than expected from a null model obtained by switching links. For all , we observe a difference in the ratio of type twins (which are unlinked pairs) to type twins (which are linked pairs) distinguishing the prokaryote E. coli from the eukaryote S. cerevisiae. Interaction similarity is expected due to gene duplication, and whole genome duplication paralogues in S. cerevisiae have been reported to co-cluster into the same complexes. Indeed, we find that these paralogous proteins are over-represented as twins compared to pairs chosen at random. These results indicate that twinness can detect ancestral relationships from currently available PIN data.
pacs:
87.14.Ee, 02.70.Uu, 87.10.+e, 89.75.Fb, 89.75.HcI Introduction
Proteins constitute the machinery that carry out cellular processes by forming stable or transitory complexes with each other – organized perhaps into a web of overlapping modules. Information about this complex system can be condensed into a protein interaction network (PIN), which is a graph where nodes are proteins and links are measured or inferred pairwise binding interactions in a cell. Major efforts over the years devoted to resolving protein interactions have employed both small-scale and large-scale techniques. High throughput methods, such as yeast two hybrid (Y2H) and tandem affinity purification (TAP) have recently generated vast amounts of protein interaction data [1, 2, 3], allowing PINs from different organisms, experiments, research teams etc. to be compared.
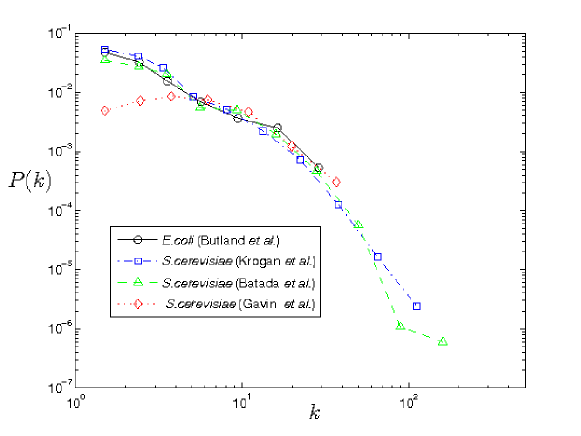
A basic statistical feature of any network is its degree distribution, , for the number of links, , connected to a node. In this respect, a variety of networks have been shown [4] to deviate decisively from a random graph, where the degree distribution is Poisson. In fact, early work suggested that degree distributions for PINs were power-law or scale-free [5]. However, as demonstrated in Fig. 1, degree distributions for recently obtained PINs are neither power-law nor particularly stable across different state-of-the-art constructions for the same organism – here the budding yeast S. cerevisiae. Note that all of the data sets studied here are based on the TAP-MS technique, except for Batada et al., which is a compilation of data obtained from a number of different techniques.
Despite the empirical inconsistency presented by PIN degree distributions, similar local structures can stand out when each network is compared to a null model where links are switched while retaining the original degree sequence [6, 7]. Subgraphs that are significantly over-abundant are referred to as motifs, while subgraphs that are significantly under-represented are referred to as anti-motifs [6]. It has been reported that proteins within motifs are more conserved than other proteins [8]. In PINs, dense subgraphs containing 3 or 4 nodes are motifs, while tree-like subgraphs are anti-motifs [9].
Complementary to the search for motifs, graph clustering algorithms have been applied to identify components or complexes in PINs. By construction, these components tend to contain a high density of links but are weakly connected to the rest of the network (see e.g. Refs. [10, 11]). Complexes identified in this manner can contain up to 100 or more proteins, with on-going debate [11] as to their biological significance. However, biological processes such as signal transduction, cell-fate regulation, transcription, and translation typically involve a few tens of proteins. In previous work [10] mesoscale (5-25) protein clusters have also been identified using graph clustering algorithms. These clusters were matched with groups of proteins known to form complex macromolecular structures, or modules of proteins that participate in a specific function in the cell [10].
The subgraphs we probe lie within the mesoscale range, but our technique avoids using clustering methods to identify components. Rather we directly estimate frequencies of occurrence of connected subgraphs of different sizes and analyze properties of these subgraph collections in the network. The particular properties we focus on here involve node similarity within subgraphs, quantified through a measure we refer to as ’twinness’.
Just as degree distributions are not consistent across currently available PINs, extensive studies of subgraph counts [9] as well as modular structures [11] show discrepancies among PINs nominally representing the same organism (again S. cerevisiae). Hence, in cases where the results are not demonstrably robust over current data sets, one can expect conclusions based on these results to change as the methods to construct PINs improve. On the other hand, statistical measurements that are relatively consistent over different PINs for the same organism can a priori be considered more robust. This is the criteria we use to decide whether or not results from our analyses are reliable.
A dominant feature of biological evolution affecting the structure of PINs is gene duplication, either of e.g. a single gene or in rare cases the whole genome, followed by divergence of the duplicates through mutation and selection. A pair of genes that evolved from the same ancestral gene is termed a paralogous gene pair, and the two proteins coded by such a gene pair are referred to as a paralogous protein pair. Remarkably, the whole genome of the yeast S. cerevisiae is believed to have duplicated approximately 100 million years ago [12]. Evolution ensuing duplication can silence duplicates. In fact, only about of the duplicated genes are known to have been retained in S. cerevisiae. Obviously, just after a duplication event, paralogous proteins interact with exactly the same set of proteins. However, evolution following the duplication event results in loss of some shared interactions, or gain of new interactions by one of the two paralogous proteins. Divergence following duplication thus reduces interaction similarity of paralogues. Early studies of paralogues in the yeast PIN showed little or no interaction similarity [13]. However, when paralogues resulting from the whole genome duplication event (WGD) in S. cerevisiae were studied separately, those paralogues were much more likely than randomly chosen pairs to share at least one neighbour [14, 15], and were significantly more likely to be co-clustered within the same protein complex. This suggests that in connected subgraphs much smaller than the entire network WGD paralogues may be observed to have the same neighbours. Indeed, our findings reliably confirm this hypothesis.
I.1 Summary
In Section II, we define twinness as a measure of node similarity within local structures in networks, summarize the graph animal algorithm used to estimate twinness, the Monte Carlo procedure used to construct null models, and the experimental methods through which the different PINs [2, 3, 1] we analyze were constructed. In Section III, we present our results. We measure twinness in connected, labeled subgraphs of size in E. coli and S. cerevisiae PINs. These are uniformly sampled using the graph animal algorithm [9]. For each subgraph, pairs of nodes that share identical subgraph neighbourhoods are identified. Twins are divided into two types depending on whether (type ) or not (type ) they are linked to each other. For all PINs and for to twinness is (almost always) significantly higher than expected from the null hypothesis. Our consistent observation for twinness for three different S. cerevisiae PINs speaks to its robustness as a structural feature of PINs. Also, type twinness is dominant for the prokaryote E. coli, while type twinness is dominant for eukaryote S. cerevisiae. We observe that pairs of WGD paralogues in yeast are grossly over-represented as twins compared to pairs chosen at random from the network. In Section IV we conclude with a discussion of some implications of these results and give an outlook for future directions.
II Definitions, Methods and Data
As is customary, we represent the connectivity of nodes in a graph in terms of an adjacency matrix . For undirected, unweighted networks, each element is either 0 – if no link exists between node and node – or 1 otherwise. Assume that node is contained within a connected, labeled subgraph of . The number of neighbors of in is its subgraph degree . Two nodes are twins in if they have identical neighbours in , i.e.
| (1) |
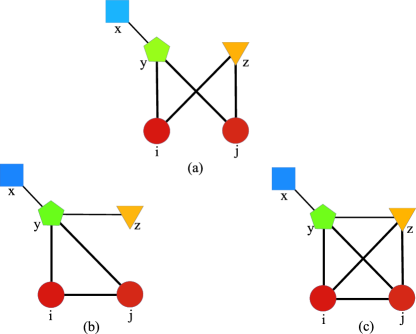
One consequence of Eq. (1) is that and must have the same subgraph degree within , or . To avoid the trivial case of twins with subgraph degree equal to one – which occurs when e.g. many nodes are connected to a hub – we require that . A pair of nodes with subgraph degrees larger than two that satisfy Eq.( 1) are type twins if and type twins if . Biologically the distinction between types and is motivated by the possibility that the ancestral protein of a paralogous pair was capable of homodimerization, i.e. it could interact with itself. Immediately after its duplication, the two paralogous proteins interact with each other and subsequent evolution can conserve this interaction. Type twins with are further denoted as type twins. These definitions are illustrated in Fig. 2 for an connected, labeled subgraph.
Using the graph animal algorithm, explained below, we obtain an estimate of the total number of connected, labeled node subgraphs, , in which the pair are type twins, with . We refer to as the type twinness of the pair . Furthermore, we refer to the pair as type twins if , that is if and appear as type twins in at least one connected, labeled node subgraph in the network. Notice that a pair of nodes () cannot be both type A and type B twins, although the pair may appear as twins in one subgraph but not in another. The total twinness for node subgraphs in a network with nodes is given by
| (2) |
The carets in the above expressions denote quantities that are estimates based on a sampling method. We also define the twinness per subgraph,
| (3) |
to account for the dependence of twinness on the total number of connected, labeled node subgraphs, , in the network. Twinness per subgraph enables comparisons between networks of different sizes and also between the original networks and their randomized counterparts.
The graph animal algorithm [9] makes it possible to obtain all of the estimates mentioned above. The algorithm, a generalization of Leath algorithms for lattice animals [16], grows connected subgraphs, and re-weights them to achieve uniform sampling of all labeled, connected subgraphs. Briefly, the graph animal algorithm proceeds as follows: (1) Pick a node at random from the network and mark it as ’infected’; (2) Add each neighbour of that node in the network to the boundary list as ‘uninfected’; (3) While the number of nodes in the subgraph is less than and the uninfected boundary list in not empty, do the following: Choose one uninfected boundary site and with probability mark it as infected, join it to the subgraph, and update the boundary list with the neighbours of that node (which were not previously on the list) marked as uninfected. With probability mark the node as immune. Immune nodes can never be added to the subgraph. For more details see [9]. The graph animal algorithm enables uniform sampling of all labeled connected subgraphs of nodes for a range of .
Evaluating the statistical significance of the results requires a null model. We use the standard [17] (although in some cases inadequate [9]) null model based on link exchange or rewiring. Then the results for connected labeled subgraphs can be compared with the results for the same quantities in an ensemble of graphs with the same degree sequence. This also has the advantage of accommodating discrepancies in node degrees among different experimental constructions of the yeast PIN as indicated in Fig. 1. To construct this null model, one randomly selects two links, and where, say, connects nodes and and connects and . A link exchange move is performed and the resulting links now connect to and to . Exchanges that would result in multiple or self-links are rejected. This process is repeated many times, and any number of nominally independent realizations of the null hypothesis can be constructed by repeating link exchange moves.
In this study we analyze four recently constructed PINs, one for E. coli and three for S. cerevisiae. The E. coli network was made by Butland et al. using experimental data obtained from High-Throughput Tandem Affinity Purification(HT-TAP), followed by MALDI-TOF MS and LC-MS to identify the purified proteins. The first S. cerevisiae network was inferred by Krogan et al. using a machine learning algorithm that utilized the MIPS database of known stable complexes as the gold standard upon which the algorithm was trained. The raw experimental data for the Krogan et al. network was obtained using the same method as Butland et al. The second S. cerevisiae network was inferred by Gavin et al. using a logarithmically weighted superposition of the spoke and matrix methods of link inference. The raw experimental data was obtained by Gavin et al. using HT-TAP, followed by MALDI-TOF MS. Data for the third S. cerevisiae network was collected by Batada et al. through a comprehensive literature review of all known sources of Protein-Protein Interaction data. The network assembled by Batada et al. included only those interactions that were confirmed by several published sources, or were verified by a highly accurate method (such as Western Blot). The data for all these networks can be found in the on-line supplementary materials associated with Refs. [2, 3, 18, 1]. Table 1 summarizes various global properties of these networks, and their degree distributions are shown in Fig. 1.
| Source | Organism | |||
|---|---|---|---|---|
| Butland et al. | E. coli | 230 | 695 | 6.0 |
| Krogan et al. | S. cerevisiae | 2559 | 7031 | 5.5 |
| Gavin et al. | S. cerevisiae | 1374 | 6833 | 9.9 |
| Batada et al. | S. cerevisiae | 2752 | 9097 | 6.6 |
The data set of Whole Genome Duplication (WGD) paralogues for S. cerevisiae was produced by Kellis et al. [12] and is found in the Supplementary Material of that publication. By sequencing and analyzing the genome of Kluyveromyces waltii – a related yeast species – these authors were able to identify paralogous genes resulting from a whole gene duplication event that occurred shortly after the two species diverged. The Kellis et al. data set was translated [14] so that it could be applied to the Krogan et al. data.
III Results
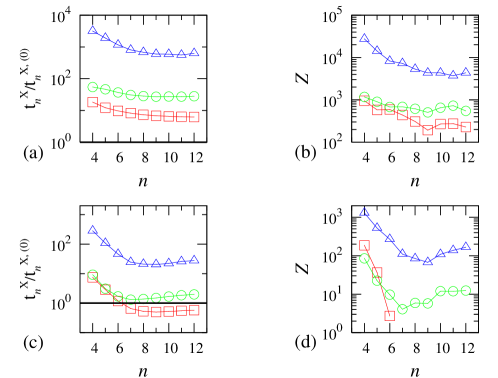
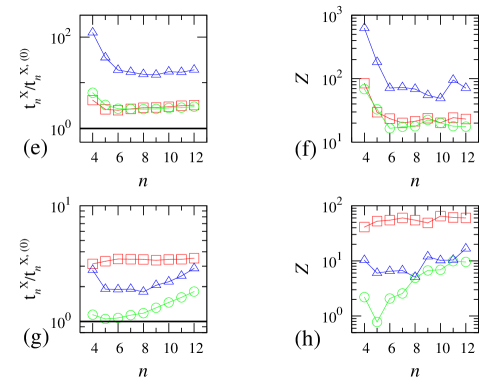
The first result of our analysis is a much higher twinness in the PINs than expected. As demonstrated in Fig. 3, in all cases twinness per subgraph is higher than in the null model – except for type twins in the Batada et al. PIN. This is in stark contrast with the result obtained for twinness in the limit , where no twins of any type appear in either the original networks or in their randomized versions. In other words, considering the entire PIN, no two nodes of degree greater than two share all of their neighbours.
The statistical significance of the results for twinness is also demonstrated in Fig. 3, which shows the scores 111 score for a measurement relative to an ensemble of null model measurements is: , where is the standard deviation of within the null ensemble. for twinness per subgraph in the original PINs compared to their randomized counterparts. This data is also plotted on log-linear axes. Almost all scores in Fig. 3 are greater than 1, and some, particularly for type twins are several orders of magnitude larger. These extremely high scores indicate that rewired networks are not the optimal null model for PINs (see Refs. [9, 7].) Nevertheless the values obtained both for twin ratios and their corresponding scores are relatively stable for . This indicates that a precise choice of is not necessary.
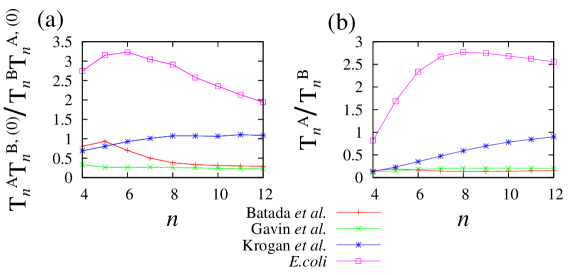
The second result of our analysis is a statistically significant difference between the ratio of type to type twinness in S. cerevisiae PINs compared to the E. coli PIN. In Fig. 4b we see that the ratio of type twinness to type twinness is much higher for the E. coli PIN than for all three S. cerevisiae PINs. In Fig. 4a we normalize this ratio by the same ratio for the respective ensemble of randomized networks. This accounts for the differences in degree sequence among the yeast PINs. The difference between E. coli and S. cerevisiae persists after this normalization. It is particularly important that the Gavin et al. and Krogan et al. S. cerevisiae PINs are easily distinguished from the Butland et al. E. coli PIN because the experimental data for all three of these networks was obtained using the TAP-MS method. The systematic decline for E. coli in Fig. 4 might be a finite size effect. In fact, this PIN is an order of magnitude smaller than the S. cerevisiae PINs (see Table 1).
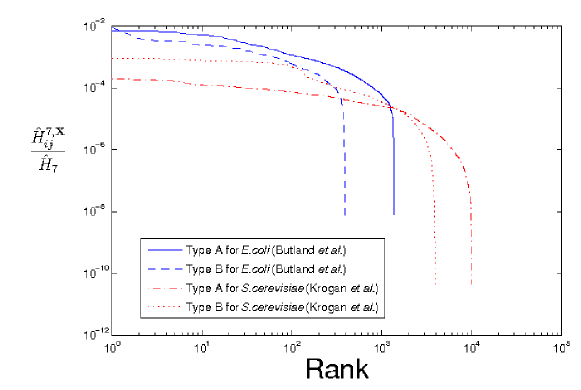
Fig. 5 is a Zipf plot of twinness for each pair of nodes. We rank each pair according to its twinness, , and then plot this twinness value against its relative rank. Pairwise twinness and ranks for Fig. 5 were evaluated for node subgraphs. To facilitate the comparison of different PINs, we divide each pair’s twinness by , the estimated total number of seven node subgraphs in the respective networks. Zipf plots for other ’s and data sets are qualitatively similar to those shown for the corresponding organism.
The difference between the prokaryote (E. coli) and the eukaryote (S. cerevisiae) PINs exhibited in Fig. 4 could be due to a higher number of type twins than type twins in E. coli – and the opposite in S. cerevisiae. Fig. 5 shows this is not the case, as for both the Krogan et al. S. cerevisiae PIN and the Butland et al. E. coli PIN the number of type twins is roughly the same order of magnitude as the the number of type twins. For E. coli the typical twinness of a type twin is larger than the typical twinness of a type twin, while the opposite is true for S. cerevisiae.
| Type | Measure | ||||||
| Number of twins in set | 11 | 11 | 11 | 11 | 11 | 11 | |
| of WGD paralogous pairs. | |||||||
| Same as above for an | |||||||
| ensemble of random samples. | |||||||
| scores for total subgraphs | |||||||
| in which paralogues appear as | |||||||
| twins. | |||||||
| Number of twins in set | 17 | 17 | 17 | 17 | 17 | 17 | |
| of WGD paralogous pairs. | |||||||
| Same as above for an | |||||||
| ensemble of random samples. | |||||||
| scores for total subgraphs | |||||||
| in which paralogues appear as | |||||||
| twins. | |||||||
| Number of twins in set | 12 | 12 | 12 | 12 | 12 | 12 | |
| of WGD paralogous pairs. | |||||||
| Same as above for an | |||||||
| ensemble of random samples. | |||||||
| scores for total subgraphs | |||||||
| in which paralogues appear as | |||||||
| twins. |
We now turn our attention to our third result, examining relationships between twinness and the evolutionary histories of PINs. Specifically, we focus on the set of paralogous proteins resulting from the whole genome duplication event in an ancestor of S. cerevisiae [12]. We started with the set of 457 WGD paralogous pairs identified by Kellis et al. [12]. We then searched for the WGD paralogues in the Krogan et al. S. cerevisiae PIN, and identified 117 WGD paralogues for which both member proteins were present in the PIN. The twinness of these 117 WGD paralogues was then measured, and a summary of this analysis is presented in Table 2.
Our results indicate a strong correlation between WGD paralogous pairs and twins. We count the number of type , , and twins in the set of 117 paralogues and compared this to the same quantity averaged over many samples obtained by choosing 117 pairs at random from the PIN. The WGD paralogue set contains many more twins, of all types, than expected from a random set of node pairs. For type we find 11 WGD paralogues that appear as twins, compared to an average of 0.36 for random samples of 117 pairs. Likewise for types and we find 17 compared to 0.14 and 12 compared to 0.11, respectively. For all types the number of WGD paralogue twins is at least one order of magnitude greater than expected, and in the cases of and , two orders of magnitude. In addition, WGD paralogues have a higher twinness (for all types) than pairs of 117 nodes chosen at random. However, when scores are calculated, this effect remains statistically significant only for type and .
To guide the reader through Table 2 let us look at the case of type twins for subgraphs. The entry of the first row indicates that 11 of the 117 WGD paralogues appear in at least one subgraph as type twins, while the second row indicates that the number of type twins expected in a sample of 117 randomly selected pairs is 0.36. The entry in the third row is the score for the total twinness, , summed only over the 117 WGD paralogues, compared to the total twinness of a random sample of 117 pairs. It should be noted that in the case of type twins the score falls below 1 for large subgraphs in the Krogan et al. PIN. This is due to the fact that although there is large number of twins among the WGD paralogues (), their actual twinness values are low. From the results presented in Table 2 it is apparent that twinness (for type ) correlates strongly with WGD paralogues. This suggests that further refinements of our methods could result in a technique capable of identifying paralogous genes based on the network properties of PINs.
IV Discussion
Early interest in the topological structure of protein interaction networks (PINs) was driven in part by the observation of a scale-free degree distribution [5]. Since then various other topological properties of PINs have been studied, such as their disassortativity [17], clustering and over-abundance of small subgraphs or motifs [9]. Many of these structural properties have failed the test of robustness presented by newer higher confidence data [18, 19] – as also indicated in Fig. 1. Other properties that may be correlated with underlying biological criteria, such as protein complexes [10], have proved to be more robust [2, 3], although some [11] have argued that protein complexes identified using clustering techniques on PINs lack biological significance.
In this paper we have proposed and studied a new structural property of networks that is not based on clustering algorithms or the identification of complexes – namely the occurrence of twin nodes in connected subgraphs. Our observation that PINs exhibit significantly higher twinness than randomized networks is robust for three different S. cerevisiae PINs despite the empirical disparity in the global characteristics of these networks. A further robust result is the marked difference between type and type twinness separating the E. coli PIN from all three S. Cerevesiae PINs studied. Based on the gross over-representation of WGD paralogues as type twins, we propose that our measure is associated with the biological phenomenon of gene duplication.
To show that the PINs studied possessed statistically significantly higher twinness than expected, a null model was used. The extremely high scores observed in our analysis (see Fig. 3) makes it clear that this null model is not optimal for PINs. The commonly held picture of the global structure of a PIN is that it consists of a number of dense clusters of nodes, that are in turn loosely connected to each other. It is well documented that rewiring significantly reduces the frequency of dense subgraphs [9, 7]. Thus, due do the fact that rewiring destroys the characteristic dense clusters mentioned above, it is unlikely that a null model based on purely random rewiring is the best null model for these networks.
This specifically applies to our results in the following manner. A subgraph with many links will tend to have a large number of types and twin pairs. (For instance, all pairs are twins in a complete graph.) However, in the rewired network, there are many fewer dense subgraphs and as such, many fewer types and twin pairs are observed. As well the over-represented motifs of the networks we analyzed are known to be dense. These points offer a potential explanation for the high levels of types and twinness observed. While this probably affects our first result (over-representation of twins in PINs), it could also affect our second result on the difference in levels of type and type twinness between E. coli and S. cerevisiae – as discussed below. However, the short comings of this null model could not impact our third result, the observed correlation between type twinness and WGD paralogues.
The difference in the ratio of type to type twinness between the prokaryote E. coli and eukaryote S. cerevisiae could be explained if the E. coli network exhibited a fundamentally different type of clustering than the three S. cerevisiae networks. This is suggested by the results of [9], as the extended motifs of the E. coli network tend to be bipartite subgraphs (which contain many type twins), while the extended motifs of the S. cerevisiae network are complete, or nearly complete subgraphs (which contain many type twins). However, the connection between motifs and twins is not as trivial as it might first appear. Motifs are over-represented, but do not necessarily comprise the bulk of subgraphs. Another possible explanation for the ratio difference comes from biological considerations. Consider a twin pair of proteins descended from the same ancestral protein capable of homodimerization. It would follow that the twin proteins would be candidates to be type twins if the interaction arising from the homodimerization of the ancestral protein was conserved, where they would be candidates to be type twins if that interaction was lost. Thus our results for the type to type twinness ratios in E. coli and S. cerevisiae could arise from a) a fundamental difference in the frequency of homodimerizing proteins between the two organism; b) differing rates of conservation of an ancestral homodimerization interaction between the two organisms or c) for reasons not related to homodimerization, such as different types of clustering. It is clear that to determine which of these cases is most likely a more sophisticated null model would be useful, particularly if it could reproduce the different types of clustering, and extended motifs found in the E. coli and S. cerevisiae PINs.
Turning our attention to our third result we note that paralogous pairs resulting from the whole genome duplication event in S. cerevisiae have been reported to be more likely to share at least one neighbour [15, 14]. While this is consistent with our result for twinness of WGD paralogues, no two nodes with degrees larger than two share all their neighbours. Our result is also consistent with the observation that WGD paralogues are separated by a shorter minimum-edge distance [14] and should thus appear in subgraphs of sizes that we have considered. Our analysis suggests that ancestral relationships between proteins can perhaps be uncovered using twinness in subgraphs, with the caveat that neither are all twins WGD paralogues, nor are all WGD paralogues twins. Furthermore it is possible that small scale duplicate proteins (such as those identified in [15]) will also appear as twins in the PIN. However, as discussed earlier, the high link density of motifs can be responsible for high twinness between nodes. Disentangling the effects of clusters from the effects of paralogous relationships is a subject for future work.
Moving on to directions not directly related to our results, we contend that analyses of connected subgraphs can shed light on the inference methods used to construct PINs. Recent TAP based experiments purify groups of proteins that are directly or indirectly bound to a bait protein. This protein group data is then converted into an interaction network using various inference methods [20, 2, 3]. Proteins that are purified as a group should lie close to each other in the inferred network, and thus be captured in our subgraphs. The criteria that were used to identify pairwise interactions from the protein group data should have a direct effect on the twinness of proteins. In fact, the gross differences between the PIN of Krogan et al. and that of Gavin et al., both of which are based on TAP experiments, might be due to the different inference methods used [21]. We have not pursued questions related to inference methods in this work, but it does present a future direction of inquiry.
Finally, we point out that apart from biological motivations, twinness between nodes can also be used as a node similarity measure for other real-world networks. Node similarity based on the intersection of the neighbour sets has been used to study similarity between documents [22, 23], and has been extended to iterative definitions of similarity [24, 25]. The basic premise for these similarity measures, as for twinness, is that if the links between nodes are derived from their function, then the functional similarity between nodes can be inferred from the topological structure of the PIN. The method presented here is not iterative, but focuses on node similarity within local network structure, which is arguably of functional relevance.
References
- [1] G. Butland, J.M. Peregrín-Alvarez, J. Li, W. Yang, X. Yang, V. Canadien, A. Starostine, D. Richards, B. Beattle, N. Krogan, M. Davey, J. Parkinson, J. Greenblatt, and A. Emili. Nature, 433 (2005) 531.
- [2] N. J. Krogan et al. Nature, 440 (2006) 637.
- [3] A. Gavin et al. Nature, 440 (2006) 631.
- [4] R. Albert and A. L. Barabási. Rev. Mod. Phys. 74 (2002) 47.
- [5] H. Jeong, S. P. Mason, A. L. Barabási, and Z. N. Oltvai. Nature, 411 (2001) 41.
- [6] R. Milo, S. Shen-Orr, S. Itzkovitz, N. Kashtan, D. Chklovskii, and U. Alon. Science, 298 (2002) 824.
- [7] M. E. J. Newman. SIAM Review, 45 (2003) 167.
- [8] S. Wuchty, Z. N. Oltvai, and A-L. Barabási. Nature Genetics, 35 (2003) 176.
- [9] K. Baskerville, P. Grassberger, and M. Paczuski. q-bio/0702029 (2007).
- [10] V. Spirin and L. A. Mirny. PNAS, 100(21) (2003) 12123.
- [11] Z. Wang and J. Zhang. PLOS Computational Biology, 3:e107 (2007).
- [12] M. Kellis, B. W. Birren, and E. S. Lander. Nature, 428 (2004) 617.
- [13] A. Wagner. Mol. Biol. Evol. 18 (2001) 1283.
- [14] G. Musso, Z. Shang, and A. Emili. Trends in Genetics, 23 (2007) 266.
- [15] Y. Guan, M. J. Dunham, and O. G. Troyanskaya. Genetics, 175 (2007) 933.
- [16] P. L. Leath. Phys. Rev. B, 14 (1976) 5046.
- [17] K. Sneppen and S. Maslov. Science, 296 (2002) 910.
- [18] N. N. Batada, T. Reguly, A. Breitkreutz, L. Boucher, B-J. Breitkreutz, L. D. Hurst, and M. Tyers. PLOS Biology, 4:e317 (2006).
- [19] S. Coulomb, M. Bauer, D. Bernard, and M-C. Marsolier-Kergoat. Proc. R. Soc. B, 272 (2005) 1721.
- [20] G. D. Bader and C. W. V. Hogue. Nature, 20 (2002) 991.
- [21] J. Goll and P. Uetz. Genome Biology, 7 (2006) 223.
- [22] M. M. Kessler. American Documentation, 14 (1963) 10.
- [23] H. Small. JASIST, 24 (1973) 265.
- [24] G. Jeh and J. Widom. KDD ’02: Proceedings of the eighth ACM SIGKDD international conference on knowledge discovery and data mining, (2002) 538.
- [25] E. A. Leicht, P. Holme, and M. E. J. Newman. Phy. Rev. E, 73 (2006) 026120.