11email: rm2@mssl.ucl.ac.uk 22institutetext: Instituto de Astronom a, Universidad Nacional Autónoma de México, Apartado Postal 877, 22830, Ensenada, Baja California, México 22email: zhar@astrosen.unam.mx 33institutetext: INAF, Istitituto di Astrofisica Spaziale, Via Bassini 15, Milan, 20133 Italy
33email: pat@iasf-milano.inaf.it
The Optical Spectrum of the Vela Pulsar††thanks: Based on observations collected at the European Southern Observatory, Paranal, Chile under programme ID 66.D-0261(A)
Abstract
Context. Our knowledge of the optical spectra of Isolated Neutron Stars (INSs) is limited by their intrinsic faintness. Among the fourteen optically identified INSs, medium resolution spectra have been obtained only for a handful of objects. No spectrum has been published yet for the Vela pulsar (PSR B0833–45), the third brightest () INS with an optical counterpart. Optical multi-band photometry underlines a flat continuum.
Aims. In this work we present the first optical spectroscopy observations of the Vela pulsar, performed in the 4000-11000Å spectral range.
Methods. Our observations have been performed at the ESO Very Large Telescope (VLT) using the FORS2 instrument.
Results. The spectrum of the Vela pulsar is characterized by a flat power-law with (4000-8000 Å), which compares well with the values obtained from broad-band photometry. This confirms, once more, that the optical emission of Vela is entirely of magnetospheric origin.
Conclusions. The comparison between the optical spectral indeces of rotation-powered INSs does not show evidence for a spectral evolution suggesting that, as in the X-rays, the INS aging does not affect the spectral properties of the magnetospheric emission. At the same time, the optical spectral indeces are found to be nearly always flatter then the X-rays ones, clearly suggesting a general spectral turnover at lower energies.
Key Words.:
Spectroscopy, Stars: pulsars individual: PSR B0833–451 Introduction
The study of the optical emission properties of Isolated Neutron Stars (INSs) is hampered by their intrinsic faintness. For most of them the knowledge of the optical spectrum is still based on the comparison between multi-band photometry measurements. We note here that this comparison is affected by several uncertainties since photometry measurements are often compiled from the literature and, thus, are taken with different instruments and filters, calibrated with different photometric systems (167 used in total; see, e.g. Mono & Munari 2000111http://ulisse.pd.astro.it/Astro/ADPS/), indipendently corrected for the atmospheric and interstellar extinction and, last but not least, converted to spectral fluxes using slightly different techniques. Only for five of the fourteen INSs with identified optical counterparts (see Mignani et al. 2004; Mignani 2005 for updated reviews) medium-resolution spectra have been obtained so far. The first one was the Crab pulsar (Oke 1969), the youngest ( years) and the brightest INS (), for which repeated spectroscopy observations have been performed (Nasuti et al. 1996; Sollerman et al. 2000). The second one was PSR B0540–69 (Hill et al. 1997, Serafimovich et al. 2004), the youngest ( years) and brightest () INS after the Crab pulsar. Only after the advent of the generation of the 10 m class telescopes, it was possible to obtain spectra of the fainter () and older ( years) INSs such as Geminga (Martin et al. 1998) and PSR B0656+14 (Zharikov et al. 2007), as well as of the radio-quiet INS RX J1856–3754 (van Kerkwijk & Kulkarni 2001).
The best next target for optical spectroscopy is the Vela Pulsar (PSR B0833–45), the third optically brightest () INS. Among the first radio pulsars discovered in the sixties, its optical identification was proposed by Lasker (1976) and confirmed by the detection of optical pulsations at the radio period (Wallace et al. 1977). The high pulsed fraction of the optical lightcurve (see also Gouiffes 1998), naturally pointed towards a non thermal, magnetospheric origin of the optical radiation. This was confirmed by multi-band photometry performed by Nasuti et al. (1997) with the NTT and by Mignani & Caraveo (2001) with the HST. The fluxes between Å and Å follow a flattish, power-law distribution (). The non-thermal nature of the optical radiation of the Vela pulsar has been also confirmed by polarisation observations performed with the VLT (Wagner & Seifert 2000; Mignani et al. 2007), pointing to a relatively high polarisation level. The Vela pulsar has been recently observed in the IR with the VLT (Shibanov et al. 2003), and in the near-UV (Romani et al. 2005; Kargaltsev & Pavlov 2007) with the HST. While its multi-band photometry now extends from the IR to the near-UV, no optical spectrum has been published yet. Here, we report on the first spectroscopy observations of the Vela pulsar performed with the VLT. Observations, data analysis and results are described in §2, while the interpretations are discussed in §3.
2 Observations and Data Analysis
2.1 Observations
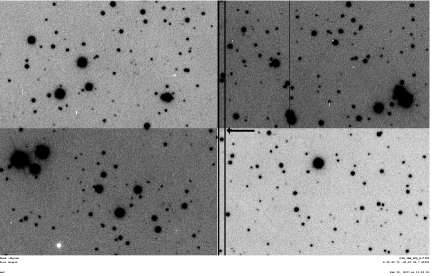
Spectroscopy observations of the Vela pulsar were performed in Service Mode in four different nights between December 2000 and January 2001 with the VLT at the ESO’s Paranal Observatory (Chile). We have used FORS2 (FOcal Reducer Spectrograph222www.eso.org/instruments/fors), a multi-mode camera for imaging and long-slit/multi-object spectroscopy which is identical to FORS1 (Appenzeller et al. 1998) but with the CCD optmized to achieve a higher sensitivity in the Red part of the spectrum. At the time of the observations FORS2 was still mounting the original detector, a Tektronix 20482046 pixels CCD with a plate scale of with the Standard Resolution (SR) collimator. The instrument was operated in its single-port, high-gain, read out mode which is the default one for long slit spectroscopy (LSS). To cover the wavelength interval 4000-11000Å the observations were performed with two different grisms: the ( Å) and the one ( Å), equipped with the order separation filter . Both grisms have a dispersion of 2.7Å/pixel and a resolving power . A slit width of was used to collect as much flux as possible from the pulsar (see Fig. 1).
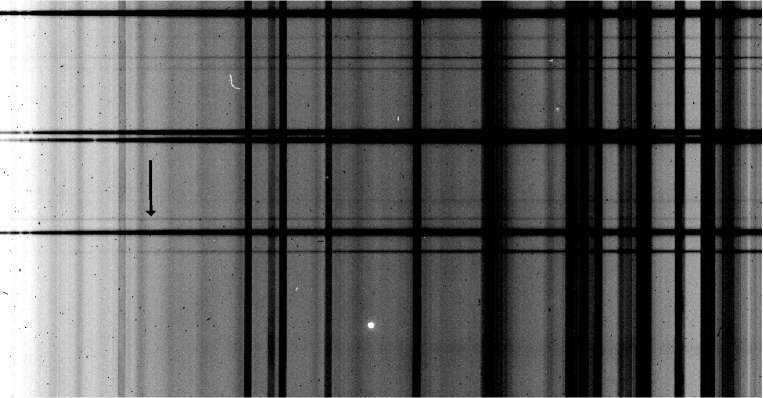
Single LSS science exposures of 2800 s each were obtained for both grisms and repeated for cosmic rays filtering. A total of eight 2800 s exposures were taken for a total integration time of 11200 s for each grism. The complete log of the science observations is reported in Table 1. The first exposure sequence in the grism was aborted and is not considered in the following analysis. The seeing conditions were always sub-arcsec ( average) and the airmass below 1.2. The slit was oriented NS on the first night and always EW on the following nights. For each night, daytime calibrations (biases, darks, flatfields, arc lamp spectra) were taken to correct for instrumental effects and to perform the wavelength calibration. Multi object spectroscopy (MOS) observations of the spectrophotometric standard stars LTT 3218, Feige 56 and Feige 67 (Hamuy et al. 1994) were acquired at the beginning of each night (with the only exception of the third one) for flux calibration. Because of their brightness, standard stars were observed in MOS mode (slitlet size ) to avoid flux losses which might occur when using the narrower LSS slit (). Thanks to the sub-arcsec seeing conditions during the observations it was possible to resolve the pulsar spectrum in each individual science exposure. As an example, we show in Fig. 2 one of the two spectra taken on the first night, where the pulsar is clearly detected. Unfortunately, the pulsar is detected with a much lower significance in the spectra due to the higher sky background and to the drop of the CCD sensitivity towards longer wavelengths
| yyyy-mm-dd | Grism | Time (s) | N | Seeing | Airmass |
|---|---|---|---|---|---|
| 2000-12-03 | 300V | 2800 | 2 | 1.14 | |
| 2001-01-23 | 300V | 2800 | 2 | 1.07 | |
| 2001-02-25 | 300I | 1400 | 1 | 1.09 | |
| 2001-01-30 | 300I | 2800 | 4 | 1.11 |
2.2 Data Analysis
Spectral data reduction and calibration were performed using standard suites of tools for treating CCD data available in the MIDAS and IRAF sofware packages. Master calibration frames (master biases and darks, flux-normalized flat fields) were provided by the FORS data reduction pipeline.333http://www.eso.org/observing/dfo/quality/FORS1 Science and standard stars spectra, as well as arc lamp spectra, were then bias and dark-subtracted, and flatfielded. Wavelength calibration was computed from the reduced arc lamp spectra by fitting a second order polynomial, yielding an rms of 0.4 Å/pixel. The wavelength calibration was then applied row-by-row to both the standard stars and science spectra. For each grism, the flux normalization was computed from the extracted one-dimensional standard star spectrum using the available flux reference table and applying the atmospheric extinction correction with the extinction curves measured for the Paranal Observatory (Patat 2004). For each grism, single science spectra were finally co-added and cosmic rays removed. The pulsar one-dimensional spectrum was then extracted from each of the co-added science spectra using a 4 pixel wide () extraction window centered on the pulsar position where the S/N is higher. The sky background was computed and subtracted from two 6 pixel wide () regions immediately adjacent to the pulsar spectrum. For each extracted one-dimensional spectrum of the pulsar we finally applied a flux correction factor, computed from the extracted spectra of brighter field stars, to account for the width difference between the extraction window and the object’s PSF. The spectra were corrected for the interstellar extinction using as a reference obtained from the spectral fit to the XMM X-ray spectrum (e.g. Manzali et al. 2007). The two one-dimensional spectra of the pulsar were finally merged to yield a single spectrum across the 4000-11000Å wavelength range.
2.3 Results
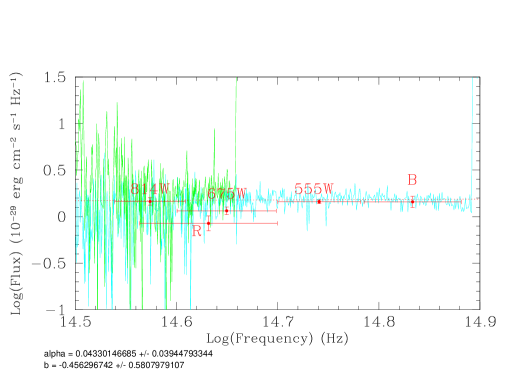
The final Vela pulsar’s spectrum is shown in Fig. 3. Due to the different detection significance of the pulsar in the two grisms, the S/N of the resulting (unbinned) spectrum is rather unhomogeneous. In particular, we estimated a S/N 5 (per pixel) in the 4000-5500Å wavelength range and a S/N as low as near/above 8000Å. At longer wavelengths the spectrum is entirely dominated by noise. For this reason in the following analyses we have considered only the part of the spectrum between 4000 Å and 8000 Å. Clearly, the spectrum consists of a pure flat continuum, with no evidence for emission or absorption feautures. For comparison, we have overplotted the spectral fluxes recomputed from the optical multi-band photometry (Nasuti et al. 1997; Mignani & Caraveo 2001), obtained between 4000 Å and 8000 Å. To be consistent, we have re-corrected these fluxes for the same value of the interstellar extinction used in this work (=0.16), while both Nasuti et al. (1997) and Mignani & Caraveo (2001) have used =0.4. For the interstellar extinction correction we have used the coefficients of Fitzpatrick (1999). As seen, within the cross-calibration uncertainties, the multi-band photometry and the spectroscopy flux measurements are substantially consistent with each other. A putative dip at 6500 Å was hinted in the multi-band photometry data of Mignani & Caraveo (2001). However, its existence was not confirmed by the VLT photometry of Shibanov et al. (2003). No evidence for such a dip is found in our spectral data either. We thus conclude that it was just the result of a cross-calibration problem in the multi-band photometry of Mignani & Caraveo (2001).
We have fitted the FORS2 spectrum between 4000 and 8000 Å with a power-law () and we derived a spectral index . This value superseeds the one obtained from the multi-band photometry of Mignani & Caraveo (2001) on the base of only five spectral flux measurements. We note that our spectral index is somewhat flatter than the one obtained by Shibanov et al. (2003) by fitting the IR-to-optical spectral fluxes (), while it compares better with the spectral index , obtained by Kargaltsev & Pavlov (2007) by extending the fit to the near-UV. Interestingly, the optical power-law is below the extrapolation of the power-law component () used to fit the XMM X-ray spectrum (Manzali et al. 2007; see also Kargaltsev & Pavlov 2007), which clearly suggests that the magnetospheric emission of the Vela pulsar features a spectral turnover at longer wavelengths.

3 Discussion
| Name | Log() | Log() | Log() | Ref. | |||||
|---|---|---|---|---|---|---|---|---|---|
| yrs | (G) | (erg s-1) | (Å) | (Å) | |||||
| Crab | 3.1 | 12.58 | 38.65 | 3300-9250 | 1,2 | ||||
| B1509–58 | 3.2 | 13.19 | 37.25 | 6000-18000 | 3,4 | ||||
| B0540–69 | 3.2 | 12.70 | 38.17 | 3605-6060 | 3300-8000 | 5,4 | |||
| Vela | 4.1 | 12.53 | 36.84 | 4000-8000 | 1500-16000 | 6,7,8 | |||
| B0656+14 | 5.0 | 12.67 | 34.58 | 4600-7000 | 0.41 | 4300-18000 | 9,10,11 | ||
| Geminga | 5.5 | 12.21 | 34.51 | 3700-8000 | 0.46 | 4300-16000 | 12,10,11 | ||
| B1929+10 | 6.5 | 11.71 | 33.59 | 1700-3400 | 13,14 | ||||
| B0950+08 | 7.2 | 11.39 | 32.75 | 3600-8000 | 15,16 |
(1) Sollerman et al. (2000), (2) Kirsch et al. (2006), (3) Kaplan & Moon (2006),(4) Gotthelf (2003),(5) Serafimovich et al. (2004), (6) this work, (7) Kargaltsev & Pavlov (2007), (8) Manzali et al. (2007), (9) Zharikov et al.(2007), (10) Koptsevich et al. (2001), (11) De Luca et al. (2005),(12) Martin et al. (1998), (13) Mignani et al. (2002), (14) Becker et al. (2006), (15) Zharikov et al. (2004), (16) Becker et al. (2004)
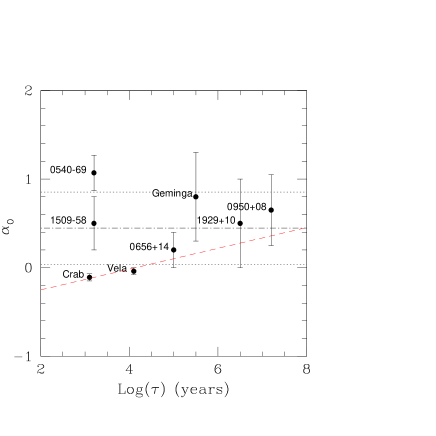
We have compared the spectrum of the Vela pulsar with those of the other rotation-powered INSs for which either medium-resolution spectroscopy or multi-band photometry is available (Fig. 4). Apparently, the complexity of the spectral flux distribution grows with the INS age. For the young objects the optical spectral energy distribution is dominated by a flat power-law continuum which brings the signature of synchrotron radiation produced by relativistic charged particles in the neutron star’s magnetosphere. For the older ones, a Rayleigh-Jeans component, ascribed to thermal radiation from the cooling neutron star’s surface, is also present. In all cases, no statistically significant evidence of emission or absorption features is found. For all the objects in Fig.4, Tab. 2 reports the measured spectral index of the power-law component, either derived from spectroscopy or from broad-band photometry. In those cases where both values are available the agreement is rather good, with the only exception of PSR B0540–69. However, as discussed in Serafimovich et al. (2004), its spectrum is unrecoverably polluted by the background of the surrounding, bright compact () synchrotron nebula. The comparison of the optical spectral indeces shows that it is difficult to find clear spectral templates for different INS groups444We warn here that the values of have been computed over slightly different wavelength ranges, which makes a direct comparison more uncertain. This is shown in Fig. 5 (top left panel), where we have plotted the optical spectral index as a function of the INS spin-down age. When available, we have assumed as a reference the spectral index obtained from spectroscopy, with the obvious exception of PSR B0540–69 (see above).
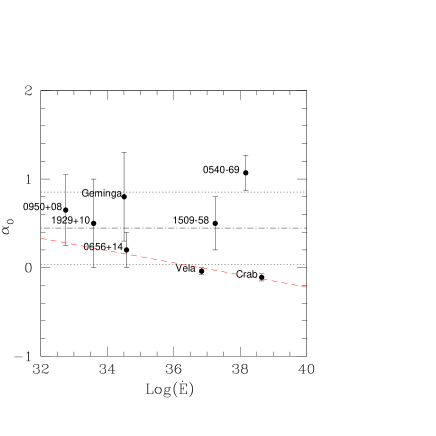
Although the spectral index value seems generally to correlate with the spin-down age, with , the errors are such that most of the points are also consistent with a costant distribution around the average value . Thus, there is no firm evidence for an evolution of the pulsars’ optical spectral index over four age decades. This is similar to what is found in the X-rays, where the available data also suggest that the value of the spectral index does not depend on the spin-down age (see, e.g. Becker & Trümper 1997). A possible anti correlation between the optical spectral index and the rotational energy loss , with , can also be recognized in the data (Fig. 5, top right panel). However, as before, the large errors do not allow to draw any firm conclusion. Finally, no trend can be recognized between the optical spectral index and the magnetic field (Fig.5, bottom left panel).


As it has been pointed out (e.g. Mignani et al. 2004; Serafimovich et al. 2004), the optical and X-ray magnetospheric emission of rotation-powered pulsars are almost never described by the same spectral parameters. This is clearly shown in Fig. 5 (bottom right panel), where we have plotted the optical spectral index vs. the X-ray one . As seen, the optical power-law index is often less steep than the X-ray one, suggesting that the spectra of rotation-power pulsars undergo a general turnover at lower energies. In particular, for the Crab the slope of the power-law swaps from positive to negative when passing from the X-ray to the optical/IR domain, underlying an even more marked spectral turnover. Furthermore, no general positive or negative correlation is found between and , which indicates that the X-ray and optical magnetospheric emission, although likely produced by the same physical processes, are not directly correlated. This finding is particularly interesting in comparison with the strong correlation between the optical and X-ray luminosities of rotation-powered pulsars noticed by Zharikov et al. (2004) and by Zavlin and Pavlov (2004).
4 Summary
We have presented the first optical spectroscopy observations of the Vela pulsar. The pulsar’s spectrum is characterized by a flat power-law with spectral index , consistent with the values derived from broad-band photometry (Mignani & Caraveo 2001; Shibanov et al. 2003; Kargaltsev & Pavlov 2007). We have compared the newly derived optical spectral index of Vela with those of all rotation-powered INSs for which a power-law component has been identified in the optical/IR spectrum. While a trend can be recognized in the data, the large errors on the spectral index values for most of the objects prevent any claim for an evolution of the magnetospheric emission properties over four age decades. We also found no evidence for a correlation between the optical and X-ray spectral indeces, which indicates that the X-ray and optical magnetospheric emissions are not directly correlated. However, we showed that in the majority of cases, the optical spectral index is flatter than the X-ray one, suggesting a spectral turnover in the INSs’ spectra at low energies.
Acknowledgements.
RPM is supported by a PPARC Rolling Grant. SZ acknowledges the support of the DGAPA/PAPIIT project IN101506 and of CONACYT 48493. We thank Werner Becker for the useful discussions and Oleg Kargaltsev for sending us the STIS/FUV pulsars fluxes. We thank our referee, Yury Shibanov, for his comments which helped to improve the quality of the manuscript.References
- Appenzeller et al. (1998) Appenzeller, I., Fricke, K., Furtig, W., Gassler, W., Haffner, R., et al. 1998, The Messenger, 94, 1
- Becker & Trümper (1997) Becker, W., Trümper, J., 1997, A&A, 326, 682
- Becker et al. (2004) Becker, W., Weisskopf, M. C., Tennant, A. F., Jessner, A., Dyks, J., et al., 2004, ApJ, 615, 908
- Becker et al. (2006) Becker, W., Kramer, M., Jessner, A., Taam, R. E.. Jia, J.J., et al., 2006, ApJ, 645, 1421
- De Luca et al. (2005) De Luca, A., Caraveo, P. A., Mereghetti, S., Negroni, M., Bignami, G. F., 2005, ApJ, 623, 1051
- (6) Fitzpatrick, E.L., 1999, PASP, 111, 63
- Gouiffes (1998) Gouiffes, C. 1998, Proc. of “Neutron Stars and Pulsars: Thirty years after the discovery”, eds. N. Shibazaki et al., Universal Academic Press, Frontiers Science Series n. 24, p. 363
- Gotthelf (2003) Gotthelf, E., 2003, ApJ, 591, 361
- Hamuy et al. (1994) Hamuy, M., Suntzeff, N. B., Heathcote, S. R., Walker, A. R., Gigoux, P., et al., 1994, PASP, 106, 566
- Hill et al. (1997) Hill, R.J., Dolan, J. F., Bless, R. C., Boyd, P. T., Percival, J. W., et al., 1997, ApJ, 486, L99
- Kaplan & Moon (2006) Kaplan, D.L & Moon, D. 2006, ApJ 644, 1056
- Kargaltsev et al. (2005) Kargaltsev, O. Y., Pavlov, G. G., Zavlin, V. E., Romani, R. W., 2005, ApJ, 625, 307
- Kargaltsev & Pavlov (2007) Kargaltsev, O., Pavlov, G, G., 2007, ApSS, 308, 287
- Kirsch et al. (2006) Kirsch, M. G. F., Scoönherr, G., Kendziorra, E., Freyberg, M. J., Martin, M., et al., 2006, A&A, 453, 173
- Koptsevich et al. (2001) Koptsevich, A. B., Pavlov, G. G., Zharikov, S. V., Sokolov, V. V., Shibanov, Yu. A. et al. 2001, A&A 370, 1004
- Lasker (1976) Lasker, B., 1976, ApJ 203, 193
- Manzali et al. (2007) Manzali, A., De Luca, A., Caraveo, P.A., 2007, ApJ accepted, (arXiv:0706.3194)
- Martin et al. (1998) Martin, C., Halpern, J. P., Schiminovich, D., et al., 1998, ApJ, 494, L211
- Mignani & Caraveo (2001) Mignani, R. P., Caraveo, P. A., 2001, A&A, 376, 213
- Mignani (1998) Mignani, R.P., 1998, Proc. of “Neutron Stars and Pulsars: Thirty Years after the Discovery”, eds. N. Shibazaki et al., Universal Academy Press, Frontiers Science Series, n. 24, p.335
- Mignani et al. (2002) Mignani, R. P., De Luca, A., Caraveo,P.A., Becker, W., 2003, ApJ, 580, L147
- Mignani et al. (2003) Mignani, R. P., De Luca, A., Kargaltsev, O., Pavlov, G. G., Zaggia, S. et al. 2003, ApJ, 594, 419
- Mignani et al. (2004) Mignani, R.P., De Luca, A., Caraveo, P.A. 2004, Proc. of “Young Neutron Stars and Their Environments”, IAU Symp. 218, eds. F. Camilo and B. Gaensler, ASP Conf. Proc., p. 391
- Mignani (2005) Mignani, R.P., 2005, Proc. of “The Electromagnetic Spectrum of Neutron Stars”, eds. A. Baykal et al., Springer, 210, 133
- Mignani et al. (2007) Mignani, R.P., Bagnulo, S., Dyks, J., Lo Curto, G., Słowikowska, A., 2007, A&A, 467, 1157
- Mono & Munari (2000) Moro, D. & Munari, U., 2000, A&A Suppl., 147, 361
- Nasuti et al. (1996) Nasuti, F. P., Mignani, R., Caraveo, P. A., Bignami, G. F., 1996, A&A, 314, 849
- Nasuti et al. (1997) Nasuti, F.P., Mignani, R., Caraveo, P.A., Bignami, G.F., 1997, A&A, 323,839
- Oke (1969) Oke, J.B., 1969, ApJ, 156, L49
- Patat (2004) Patat, F., 2004, The Messenger, 118, 11
- Romani et al. (2005) Romani, R. W., Kargaltsev, O., Pavlov, G, G., 2005, ApJ, 627, 383
- Serafimovich et al. (2004) Serafimovich, N.I., Shibanov, Y. A., Lundqvist, P., Sollerman, J., 2004, A&A, 425, 1041
- Shibanov et al. (2003) Shibanov, Y. A., Koptsevich, A. B., Sollerman, J., Lundqvist, P., 2003, A&A, 406, 645
- Shibanov et al. (2005) Shibanov, Yu. A., Sollerman, J., Lundqvist, P., Gull, T., Lindler, D., 2005, A&A, 440, 693
- Sollerman et al. (2000) Sollerman, J., Lundqvist, P., Lindler, D., Chevalier, R. A., Fransson, C., et al., 2000, ApJ, 537, 861
- Wagner and Seifert (2000) Wagner, S.J., & Seifert, W. 2000, Proc. of “Pulsar Astronomy - 2000 and Beyond”, eds. M. Kramer et al., ASP Conf. Series, 202, 315
- Wallace et al. (1977) Wallace, P.T., Peterson, B. A., Murdin, P. G., Danziger, I. J., Manchester, R. N., et al., 1977, Nature, 266, 692
- van Kerkwijk & Kulkarni (2001) van Kerkwijk, M. H., Kulkarni, S. R., 2001, A&A, 378, 986
- Zhavlin & Pavlov (2004) avlin, V. E., Pavlov, G. G., 2004, ApJ, 616, 452
- Zharikov et al. (2004) Zharikov, S. V., Shibanov, Yu. A., Mennickent, R. E., Komarova, V. N., Koptsevich, A. B., et al., 2004, A&A, 417, 1017
- Zharikov et al. (2007) Zharikov, S., Mennickent, R. E., Shibanov, Y., Komarova, V., 2007, ApSS, 308, 545