New insights on the dense molecular gas in NGC253 as traced by HCN and HCO+
Abstract
We have imaged the central kpc of the circumnuclear starburst disk in the galaxy NGC 253 in the HCN(10), HCO+(10), and CO(10) transitions at 60 pc resolution using the Owens Valley Radio Observatory Millimeter-Wavelength Array (OVRO). We have also obtained Atacama Pathfinder Experiment (APEX) observations of the HCN(43) and the HCO+(43) lines of the starburst disk. We find that the emission from the HCN(10) and HCO+(10) transitions, both indicators of dense molecular gas, trace regions which are non–distinguishable within the uncertainties of our observations. Even though the continuum flux varies by more than a factor 10 across the starburst disk, the HCN/HCO+ ratio is constant throughout the disk, and we derive an average ratio of . From an excitation analysis we find that all lines from both molecules are subthermally excited and that they are optically thick. This subthermal excitation implies that the observed HCN/HCO+ line ratio is sensitive to the underlying chemistry. The constant line ratio thus implies that there are no strong abundance gradients across the starburst disk of NGC253. This finding may also explain the variations in between different star forming galaxies both nearby and at high redshifts.
Subject headings:
ISM: molecules – galaxies: individual (NGC253) – galaxies: starburst – galaxies: ISM1. Introduction
Constraining the physical properties of the dense molecular gas phase is important for understanding the relation between the gas properties and the star formation process in nearby and high- galaxies. HCO+ has successfully been used as a tracer of dense gas ( cm-3) both in star forming regions of the Milky Way (e.g., Christopher et al. 2005) and in nearby galaxies (e.g., Nguyen-Q-Rieu et al. 1992; Brouillet et al. 2005). Recently, it has also been detected at high redshifts towards the Cloverleaf quasar (Riechers et al., 2006) and towards APM 08279+5255 (García-Burillo et al., 2006). HCN is another good tracer of dense gas and has also been observed both locally (e.g., Gao & Solomon 2004) and towards high redshift sources (e.g., Solomon et al. 2003; Vanden Bout et al. 2004; Carilli et al. 2005; Wagg et al. 2005; Gao et al. 2007). Gao & Solomon (2004) found that the HCN luminosity is correlated with the far-infrared luminosity for starforming galaxies over several decades. Wu et al. (2005) found that this correlation holds all the way to the smaller scales of the local star forming regions, i.e. over 7–8 orders of magnitude.
The number of nearby galaxies in which molecular gas observations allow resolving the emission across the dense gas starburst regions is limited to only a few. At a distance of only about 3.5 Mpc (Rekola et al., 2005), NGC 253, a member of the Sculptor group of galaxies, is one of the closest starbursting galaxies. This makes it one of the best-suited laboratories for studies of a circumnuclear starburst and its effect on the ambient interstellar medium (ISM). Some early detections of HCN and HCO+ towards the center of NGC253 came from Rickard et al. (1977) and Rickard & Palmer (1981), both using single-dish telescopes. Paglione et al. (1995) presented first interferometry maps of HCN towards NGC253 using the Nobeyama Millimeter Array.
We here present Owens Valley Radio Observatory (OVRO) interferometry maps and Atacama Pathfinder Experiment (APEX)111This publication is based on data acquired with the Atacama Pathfinder Experiment (APEX). APEX is a collaboration between the Max-Planck-Institut fur Radioastronomie, the European Southern Observatory, and the Onsala Space Observatory. single-dish mapping of both HCN and HCO+, which we use for studying the spatial distribution and excitation of the two molecules in the circumnuclear starburst of NGC253. The paper is structured as follows: section 2 presents the observations and data reduction, the results are given in §3, and in §4 we discuss the implications both in the context of other nearby galaxies and for high redshift sources. At a distance of 3.5 Mpc, on the sky corresponds to 17.0 pc.
2. Observations and Reduction
2.1. OVRO observations
We observed NGC 253 in the HCN(10) ( = 88.63185 GHz), HCO+(10) ( = 89.18852 GHz) and CO(10) ( = 115.2712 GHz) transitions with the OVRO Millimeter-Wavelength Array in its C and E configurations. The HCN and HCO+ observations were obtained simultaneously during four tracks taken between 1999 November and 2000 February (60 channels, with a channel width of 4 MHz, corresponding to 13.5 km s-1); the CO observations were taken during six tracks from 2001 October to 2002 March (120 channels with a width of 2 MHz 5.2 km s-1); the duration of one track was typically 5 hr. The observations for each array were edited and calibrated separately with the mma and the miriad packages. The uv–data were inspected and bad data points due to either poor atmospheric conditions or shadowing were removed, after which the data were calibrated. Flux calibration was determined by observing Neptune during most observing runs. For observing runs without planet observations the flux calibration has been bootstrapped using the gain calibrator 3C454.3 (9 Jy). These calibrators and an additional noise source were used to derive the complex bandpass corrections. The nearby calibrators B0135-247 (0.37 Jy), B0048-097 (0.72 Jy), and B0003-066 (1.25 Jy) were used as secondary amplitude and phase calibrators. We estimate our flux calibration to be accurate to within 15%.
For each transition, we produced a data cube using “robust” weighting which was cleaned down to a level of twice the rms noise. This resulted in beam sizes (and position angles) of 3.792.56′′ (137) and 3.842.64′′ (89) for the HCN and the HCO+ observations, respectively. As one of the main aims of this study is to compare the properties of the HCN and the HCO+ emission, we convolved both cubes to a common resolution of 3.92.7′′ (100), which resulted in an rms noise of mJy beam-1 in one 4 MHz channel. The resulting beam size for the CO(10) observations is 4.92.7′′ (9) with an rms of mJy beam-1 per 2 MHz channel. The channels not containing HCN and HCO+ line emission were combined to create a continuum map at 3 mm; the resulting rms in this image is 5 mJy beam-1. We note that the resolution of the CO and HCN maps is comparable to that of the interferometric maps from Paglione et al. (1995, 2004), while the HCO+ has a higher resolution than the Hat Creek Array map from Carlstrom (1990). Furthermore, the resolution of our 3 mm continuum map is a bit better than those of Peng et al. (1996) and García-Burillo et al. (2000).
As the channel width of the CO(10) observations is different from the HCN(10) and HCO+(10) observations, we regridded the CO(10) data cube to match the channel width of the other transitions. Subsequently, we used the high signal–to–noise ratio CO(10) data cube to define, in each channel map, the regions that contain emission (this is called the “master” cube). We used this master cube to blank both the HCN and HCO+ cubes. All integrated maps shown here are based on these blanked cubes and contain the same areas of emission for all three transitions.
2.2. APEX observations
We also obtained observations of the HCN(43) ( = 354.50547 GHz) and HCO+(43) ( = 356.73413 GHz) transition using the APEX 12m telescope on Chajnantor. For these frequencies the half–power beamwidth of the antenna is . The observations were carried out during two runs in 2006 September in good weather conditions (typical water columns: 0.7–1mm) using the dual–side–band receiver APEX-2A. Calibration was achieved using the standard hot–cold–sky observing scheme roughly every 10 minutes. For both runs typical system temperatures were K (). Spectra were recorded using the Fast Fourier Transform Spectrometer on APEX (Klein et al., 2006) providing a bandwidth of 1 GHz with an effective resolution of 120 kHz (0.12 km s-1). The telescope pointing was checked on the nearby carbon star R Scl and found to be accurate to . The observations were performed in the standard raster-mapping mode covering the full region where emission has been detected in the OVRO maps in both transitions. Data processing was done using the CLASS software package. In the data processing, we dropped all scans with distorted baselines, subtracted linear baselines from the remaining spectra, and then rebinned to a velocity resolution of 20 km s-1. Finally, temperatures were converted to using a forward efficiency and a main beam efficiency of 0.97 and 0.73 respectively (Güsten et al., 2006). The conversion from to flux is 32 Jy K-1 at 350 GHz. We estimate our flux calibration to be accurate to within 15%.
3. Results
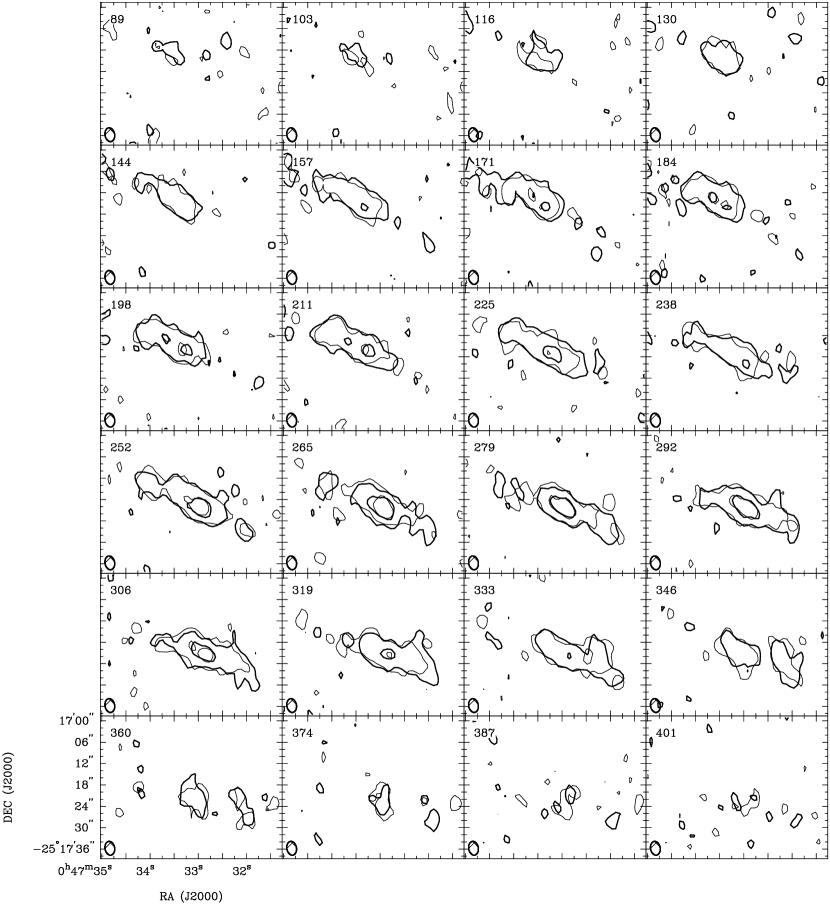
Figure 1 shows the OVRO channel maps for the HCN(10) and HCO+(10) data. It is striking that their spatial distributions are essentially identical. Both molecules are tracing dense molecular gas in the circumnuclear starburst region of NGC 253.
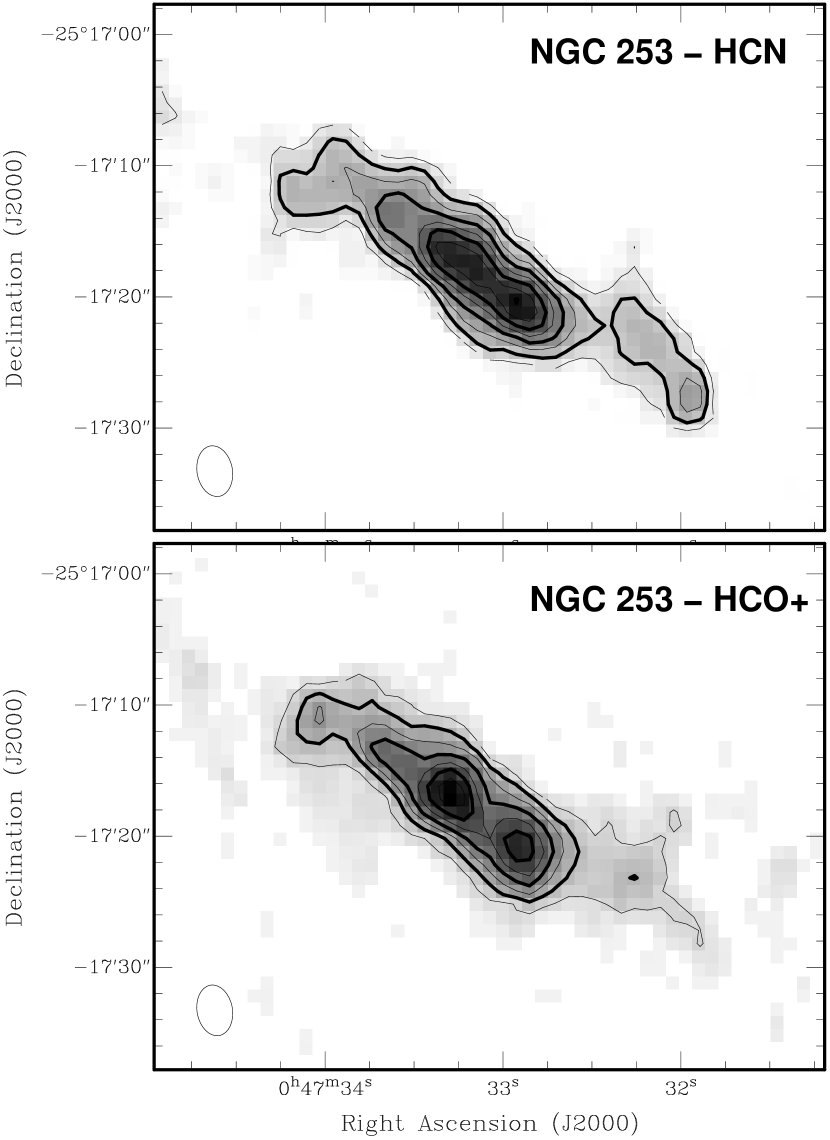
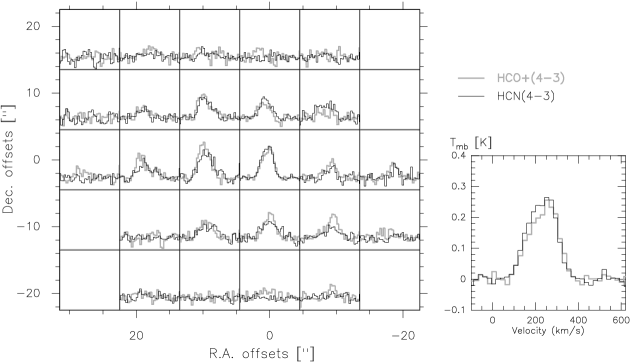
Figure 2 shows the integrated maps of HCN(10) and HCO+(10) line emission, respectively. The slightly different morphology towards the southwest in the HCO+(10) map compared to HCN(10) is likely due to the slightly lower signal–to–noise ratio in the map. The HCN(43) and HCO+(43) spectra from APEX are shown in Figure 3. The line profiles are very similar at all observed positions, and the rotation of the circumnuclear gas is nicely visible in both transitions. The integrated fluxes for all transitions are given in Table 1 along with the line luminosities, which we derive using the equations given in Solomon et al. (1997). The values for HCN and HCO+ ground transitions are consistent with previous results from Nguyen-Q-Rieu et al. (1989) and Nguyen-Q-Rieu et al. (1992) for both molecules and Paglione et al. (1995) for HCN.
The fluxes and luminosities given in Table 1 imply a HCN(10)/CO(10) flux ratio of 0.084 or a luminosity ratio of 0.14, and a HCO+(10)/CO(10) flux ratio of 0.077 or a luminosity ratio of 0.13, which is similar to other starbursts (e.g., Nguyen-Rieu et al. 1994; Jackson et al. 1995; Sorai et al. 2002; Gao & Solomon 2004; Nakanishi et al. 2005). If only measuring the CO flux in those pixels where there is HCN emission, the CO flux decreases by 12%, indicating that there is relatively little diffuse CO emission present around the bright nucleus.
For all three molecules we measure the peak surface brightness at the central position: CO(10), 2.4 Jy beam-1,; HCN(10), 0.49 Jy beam-1; and HCO+(10), 0.38 Jy beam-1. From this we determine the peak brightness temperature using the conversions 6.95 Jy K-1 at 115.27 GHz and 14.9 Jy K-1 at 89 GHz for our observations and derive the following temperatures: 17 K for CO(10), 7.3 K for HCN(10), and 5.7 K for HCO+(10). Thus, our CO data set a lower limit to the kinetic temperature K (Planck temperature). The CO(10) brightness temperature is in agreement with Paglione et al. (2004), although it is somewhat lower than the 36 K derived by Sakamoto et al. (2006) at comparable angular resolution.
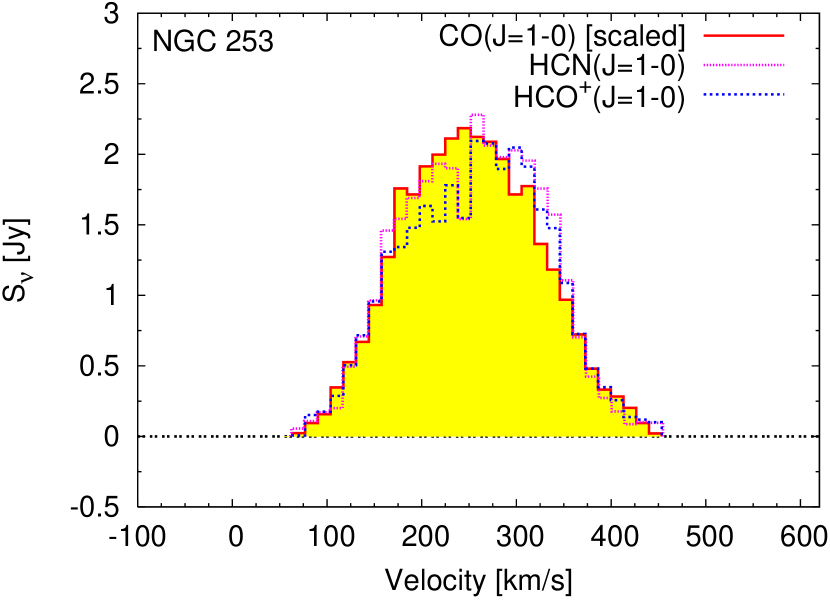
For several high redshift sources it has been found that lines from HCN appear to be narrower than the CO lines. This is the case for the Cloverleaf quasar (Weiß et al., 2003; Solomon et al., 2003; Riechers et al., 2006), APM 08279+5255 (Wagg et al., 2005; Weiss et al., 2007), and IRAS F10214+4724 (Downes et al., 1995; Vanden Bout et al., 2004). It has been argued that this indicates that the dense gas is more concentrated around the nucleus. Even though NGC253 does not match these high redshift galaxies in far-infrared luminosity, we extract the spectra for CO(10), HCN(10), and HCO+(10) (shown in Fig. 4). Here we find that the line widths are the same for all three lines. This agrees with the interferometric channel maps (Fig. 1), in that the emission emerges from the same cloud or system of clouds.
| Transition | aperture | ||
|---|---|---|---|
| (arcsec) | (Jy km s-1) | (K km s-1 pc2) | |
| HCN(10) | 20 | 186 | |
| HCN(10) | 27 | 208 | |
| HCN(10) | Full map | 370 | |
| HCN(43) | 20 | 1338 | |
| HCN(43) | 27 | 1634 | |
| HCN(43) | Full map | 2310 | |
| HCO+(10) | 20 | 178 | |
| HCO+(10) | 27 | 203 | |
| HCO+(10) | Full map | 340 | |
| HCO+(43) | 20 | 1302 | |
| HCO+(43) | 27 | 1723 | |
| HCO+(43) | Full map | 2860 | |
| CO(10) | Full map | 4400 |
Note. — The lines are detected at . This is well within the 15% uncertainty of the flux calibration.
For illustration purposes we also compare the distribution of dense gas to H emission and 20 cm radio continuum in Figure 5. Strong H emission is seen in the dense gas regions traced by HCN(10) and HCO+(10). In the H image (from Lehnert & Heckman 1995) the outflow from the central region is very pronounced. In the radio 20 cm map (from Ulvestad 2000), we see that the radio emission traces the starburst region as well as the outflow. The 20 cm map compared to high-frequency radio maps is particularly useful for comparison with the HCN and HCO+ maps as the resolution is similar. The region towards the southwest is not seen in the H image, although radio continuum is detected at 20 cm, indicating that this likely is a highly obscured star forming region.
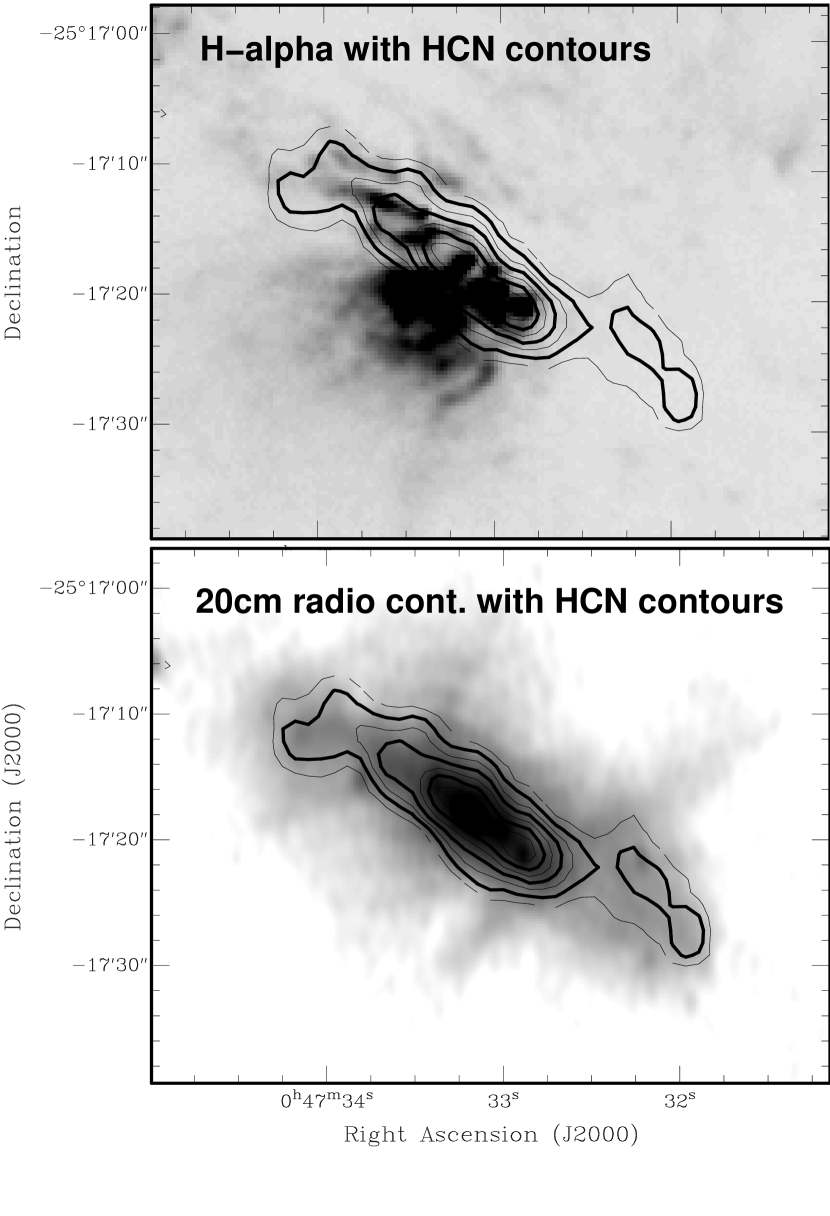
From the line-free channels of the OVRO observations, we derive a 3 mm continuum image. The 20 cm emission peaks at the center at a flux level of 0.1 Jy beam-1, while the flux level in surrounding regions has dropped to about 0.01 Jy beam-1. In the 3 mm continuum map, the same is seen, where the flux level also peaks around 0.1 Jy beam-1 and also falls off by about an order of magnitude. The continuum emission as seen at 20 cm is dominated by synchrotron emission and the 3 mm emission is likely a combination of free-free emission and dust continuum. A similar behaviour is seen in the Submillimetre Common-User Bolometer Array (SCUBA) maps from Alton et al. (1999), where the submillimeter observations trace the thermal dust emission.

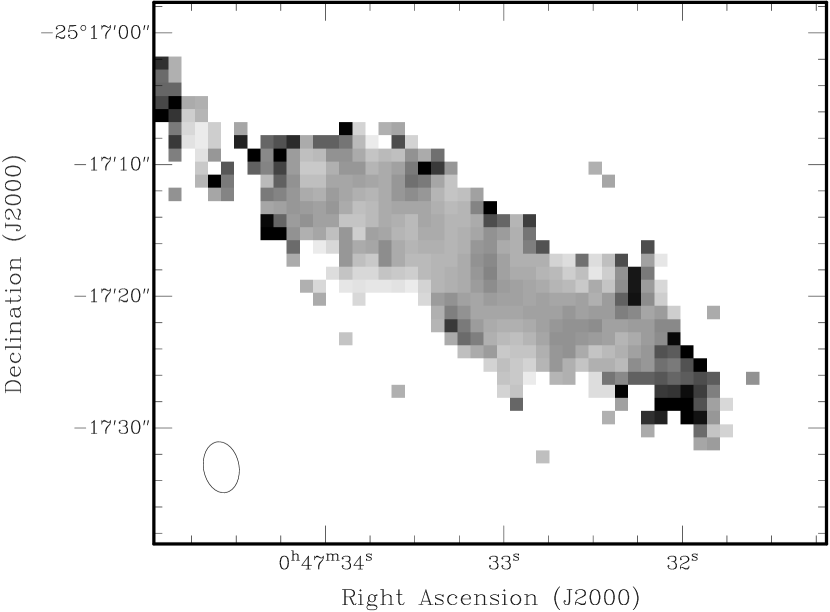
Figure 6 shows the HCN/HCO+ ratio map. Some of the pixels along the edges suffer from low signal–to–noise ratio, resulting in large uncertainties in the ratio in those pixels. We construct a histogram of the HCN(10)/HCO+(10) ratio map, shown in Figure 7 (solid line), where the tails of the distribution are dominated by the low signal pixels. We perform a Gaussian fit to the histogram and find an average ratio HCN(10)/HCO+(10). To check for spatial variations of this value, we also show the histogram for the central region only (Fig. 7, dashed line), where the continuum level is the highest. The ratio is , while in the surrounding regions, where the continuum level has dropped by almost a factor 10, it is . We find no evidence for a change in the HCN/HCO+ ratio across the regions with large variation in the continuum level (i.e., radiation field).
4. Discussion
4.1. HCN and HCO+ excitation

A comparison of the 43 to the 10 line luminosities of both molecules shows that the 43 transitions are both subthermally excited independent of the aperture chosen (L/L, L/L). At a spatial resolution of , the APEX data is directly comparable to previous HCN(43) measurements from the CSO (Jackson et al., 1995). Although the peak brightness temperatures of both measurements are roughly comparable, our integrated intensity is a factor of 2 lower than the measurements by Jackson et al (35 vs 71.4 K km s-1). A similar difference is apparent in the HCO+(43) data (31 vs. 50.8 K km s-1). The APEX data in comparison to the Caltech Submillimeter Observatory (CSO) data have a much broader bandwidth and thus result in a much more reliable baseline subtraction and total fluxes. Given the quality of our new APEX data we adopt our values for the following excitation analysis.
As the HCN(43) and HCO+(43) intensities are critical to constrain the excitation, we have reinvestigated the gas excitation by applying a series of spherical, single-component, large velocity gradient (LVG) models. We use the collision rates from Schöier et al. (2005) and relative abundance ratios of [HCN/H2] = and [HCO+/H2] = determined for NGC 253 by Martín et al. (2006) and a velocity gradient of 8 km s-1 pc-1. The latter is motivated from CO studies which indicate that the a large velocity spread is required in order to model the high 12CO/13CO line ratios observed towards NGC253 and other starburst galaxies (e.g. Aalto et al., 1991; Paglione et al., 2001; Weiß et al., 2005). To compare the LVG predicted line brightness temperatures to the observations we convert the LVG line temperatures to integrated flux densities. Note that for fixed abundance ratios and a fixed velocity gradient the column density per velocity bin scales linearly with the density: .
Figure8 shows line spectral energy distributions (SEDs), i.e., rotational quantum number versus flux density, for HCN and HCO+ for the central 27′′ beam which allows us to also include the HCN(32) and HCO+(32) from Paglione (1997) and Paglione et al. (1997) to this plot. Both SEDs limit the possible range in H2 density to about 104.9-105.5 cm-3. Models with lower density fail to reproduce the observed 43 flux densities for both molecules. Similarly, higher densities over-predict the 32 and 43 lines even for very cold temperatures of 15 K. The kinetic temperature is poorly constrained from the models (see also the LVG models in Jackson et al. 1995; our Fig. 8, dotted and dashed lines); however, a kinetic temperature of 50 K is the most plausible solution as it is consistent with the dust temperature (Melo et al., 2002) and also in agreement with models of the CO SED (Güsten et al., 2006). We note that a temperature of K, as derived by Bradford et al. (2003), cannot be ruled out by the model. With this, a good match to both line SEDs in our fixed chemistry framework is provided by an H2 density of 105.2 cm-3, a kinetic gas temperature of K, and an area filling factor of about 1% (Fig. 8 solid line). All solutions which match the data predict that HCN and HCO+ lines are optically thick and subthermally excited, even in the ground transition of HCN and HCO+. For the 50K model we get an excitation temperature of 26K for HCN(10) and of 42K for HCO+(10) and all higher transitions have lower . For a very cold solution of 20K ( cm-3) the HCO+(10) emission would be close to being thermalized. Although the area filling factors for HCN and HCO+ differ slightly for a given – LVG input, the good agreement of the model predicted SEDs for HCN and HCO+ with the observations suggests that the emission from HCN and HCO+ arise from a common volume.

We repeat the analysis for the central position of NGC253 after convolving the data to a resolution of 20′′. For our LVG model with cm-3 and K, the results are consistent with those derived from 27′′ resolution. The only difference is the area filling factor which increases for higher resolution. If we apply the same LVG model to the total flux within the maps covered by the OVRO and APEX observations, the LVG predicted HCN and HCO+ (43) fluxes are slightly higher than the observed values which suggests that the HCN and the HCO+ excitation is somewhat lower in the outer most regions of the data cubes. At a fixed temperature of K, however, a small decrease of the H2 density to cm-3 is sufficient to bring the model prediction and the observations into agreement.
In summary, the constant HCN/HCO+ flux ratio across the starburst disk would require a highly unlikely combination between varying abundances and excitation conditions. Hence it is safe to conclude that there is no significant abundance gradient across the disk.
4.2. Comparison to excitation conditions in other galaxies

We have used our new HCN observations as well as data from the literature to compare the excitation of the dense gas via the HCN SEDs in NGC253, M82, NGC4945, NGC6240, Mrk231 and Arp220 (references are given in the caption of Fig. 9). We restrict ourselves here to HCN because it provides the most complete data set among tracers of the dense gas for these active galaxies. All galaxies except Mrk231 have been measured in HCN(10), HCN(32), and HCN(43). For Mrk231, only the HCN(10) and HCN(43) have been published in the literature. Figure 9 shows a comparison of the HCN SEDs of the six galaxies normalized by their HCN(10) flux density. This comparison shows that among these sources NGC 253 exhibits one of the highest HCN excitations. Given that the HCN emission in NGC253 is subthermally excited, this comparison shows that subthermal HCN is a common property of star forming galaxies. The only source where the HCN excitation exceeds that of NGC253 is Arp220 (see also Greve et al. 2006; Papadopoulos 2007). We note, however, that the HCN line intensities of Arp220 in Greve et al. (2006) (which have been used to fit the HCN SED of Arp220 in Fig. 9) are higher by a factor of compared to other studies (Solomon et al., 1992; Wiedner et al., 2002; Cernicharo et al., 2006). Therefore, the available data is not conclusive and does not allow to rule out that HCN is subthermally excited also in Arp 220. Interestingly, NGC6240 and Mrk231 show a lower excitation of the dense gas phase compared to NGC253 (Fig. 9) despite their much higher FIR luminosities (Fig. 11).
4.3. Possible interpretation of / variations between galaxies

While our results show that the HCN/HCO+ ratio is statistically constant across the starburst disk, we do inspect the details. In Figure 10 we plot the HCN/HCO+ flux ratios as function of the 20cm fluxes for each pixel. Towards higher 20cm flux, there are three data points which hint at a higher HCN/HCO+ ratio (this increase is due to a relative decrease of the HCO+ emission). They correspond to the peak in the 20cm flux. This is also towards the peak of the hard X-ray emission as measured with Chandra (Strickland et al., 2000), where it is possible that there is an absorbed active galactic nucleus (AGN) present in the very center of NGC253 (Weaver et al., 2002). While these data points are within the scatter, we speculate that the small increase in the HCN/HCO+ ratio could be a consequence of the presence of an AGN based on the relations suggested by Kohno et al. (2001). This, however, can only be resolved when future instruments with larger resolving power and higher sensitivity will become available.
The line ratio between HCN and HCO+ has been studied for several classes of star forming galaxies, mostly through single-dish observations (Nguyen-Q-Rieu et al., 1992; Imanishi et al., 2004, 2006; Graciá-Carpio et al., 2006), where ratios have been found in the range 0.5-2.7. Graciá-Carpio et al. (2006) presented a data set of HCN/HCO+ for luminous IR galaxies (LIRGs; L⊙) and ultra-luminous IR galaxies (ULIRGs; L⊙). They present a possible correlation between the HCN/HCO+ ratio and the IR luminosity. If, however, other measurements from the literature, including those of less luminous star forming galaxies and a recent high-redshift measurement (Nguyen-Q-Rieu et al., 1992; Imanishi et al., 2006, 2004; Nakanishi et al., 2005) are included in such a plot, there remains little evidence for such a correlation with (Fig. 11; see also Riechers et al., 2006).
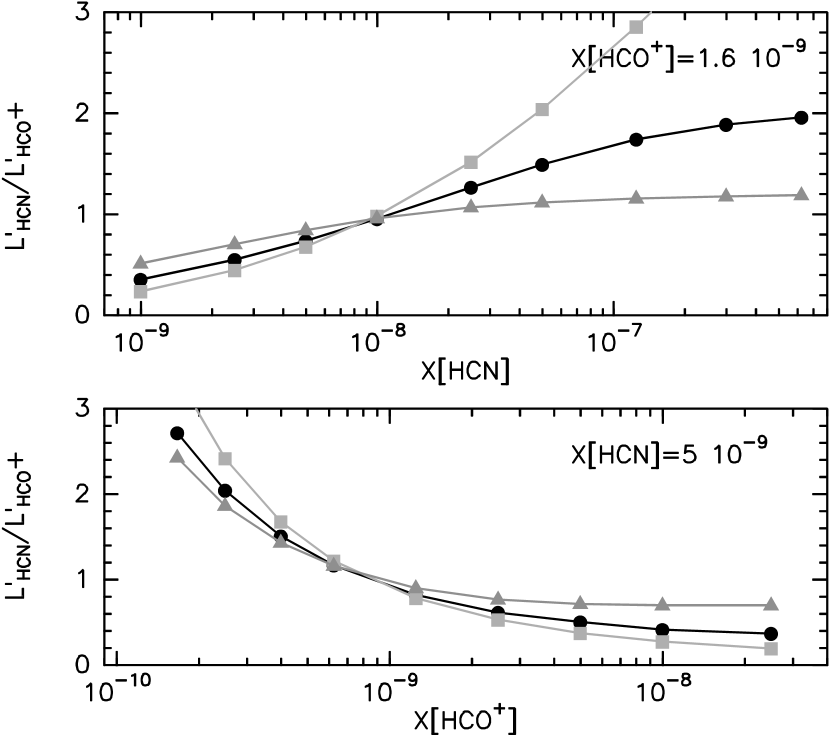
The large number of galaxies with / seems surprising at the first glance since the emission in both lines is likely optically thick in all galaxies (see also Greve et al., 2006), and the critical densities of HCO+ are lower than those for HCN. From this one would expect that the HCO+(10) line is brighter than the HCN(10) line if both molecules trace the same gas. However, as both molecules are subthermally excited, their line intensity depends on the underlying chemistry despite their high optical depth. This is exemplified in Figure 12, where we show the LVG predicted / ratio as a function of reasonable HCN and HCO+ abundance for different H2 densities. From the plot it can be seen that a decrease of the HCO+ abundance can indeed explain even the highest observed line ratios independent on the underlying density of the gas. Alternatively, an increase of the HCN abundance will also increase the / ratio. The latter process, however, is only effective for H2 gas densities below a few times 105 cm-3, as for higher densities HCN(10) will become thermalized and, therefore, insensitive to abundance variations. Given the gas density derived by us for NGC253 (105.2 cm-3), both processes can effectively modify the observed line ratio.
A decrease of the HCO+ abundance due to the ionizing field produced by cosmic rays has been proposed by Seaquist & Frayer (2000). Cosmic rays ionize H2, leading to the production of H, which reacts with CO to form HCO+. The abundance of HCO+ is thus affected by ratio of cosmic–ray ionization rate and gas density. While a higher ionizing flux favours the production of HCO+, it also increases the number of free electrons, which leads to a higher probability for recombination. At a gas density of cm-3, an ionizing field comparable to that of the Galaxy may already be strong enough to significantly decrease the abundance of HCO+ due to dissociative recombination of H (e.g. Phillips & Lazio 1995).
Theoretical modelling by Meijerink & Spaans (2005) and Meijerink et al. (2007) suggest that for modest column densities cm-2 the presence of an embedded X-ray source, such as an AGN, can enhance the HCN/HCO+ and HCN/CO abundance ratios relative to a pure UV source, such as young massive stars in a starburst. Note, however, that for larger column densities the reverse would be true. There are hints of enhanced HCN/HCO+ ratios in nearby Seyfert galaxies (e.g., Kohno et al., 2001). Nonetheless, similar enhancements are not found for the far-infrared bright Cloverleaf QSO (Riechers et al., 2006).
An alternative explanation for the observed variations of the / ratio could be that HCO+ and HCN are not arising form the same volume. From an analysis of the dense gas properties in Arp220 and NGC6240, Greve et al. (2006) recently concluded, that the HCO+ emission is dominantly emitted from regions with 10 times lower density than HCN. In this picture the / ratio would then be explained by the relative area filling factors of the denser cores and the less dense surounding medium in combination with the excitation conditions in both gas phases. This picture, however, is not supported by our observation of NGC253, where the excitation of both molecules can be explained by a single density–temperature combination.
5. Conclusions
We have presented maps of HCN(10) and HCO+(10) obtained with OVRO and observations of HCN(43) and HCO+(43) obtained with APEX of the starburst disk of NGC253. We find that the spatial distribution of the two molecules is very similar, even when compared on a channel-by-channel basis. We find the ratio between HCN(10) and HCO+(10) is across the whole circumnuclear starburst region independent of the strength of the central radiation field. The emission from the HCN(10) and HCO+(10) transitions, both indicators of the dense molecular gas, trace regions that are non–distinguishable within the uncertainties of our observations.
From an excitation analysis we find that both molecules are subthermally excited and that their emission lines are optically thick. The constant line ratio implies that there are no strong abundance gradients across the starburst disk. A consequence of both molecules being subthermally excited is that the line intensity is sensitive to the underlying chemistry despite their high optical depth. This finding may also explain the variations in between different star forming galaxies.
The advent of the Atacama Large Millimeter Array (ALMA), Expanded Very Large Array (EVLA), and Square Kilometer Array (SKA) will open up improved prospects for observations of dense molecular gas phase in galaxies through molecular line transitions such as HCN and HCO+ at low and high redshifts. As both HCN and HCO+ appear to trace the same dense gas regions where the formation of the stars are taking place, observations of these two molecules will be important probes in future projects aimed at studying galaxies during phases of the build-up of their stellar mass.
References
- Aalto et al. (1991) Aalto, S., Johansson, L. E. B., Booth, R. S., & Black, J. H. 1991, A&A, 249, 323
- Alton et al. (1999) Alton, P. B., Davies, J. I., & Bianchi, S. 1999, A&A, 343, 51
- Bradford et al. (2003) Bradford, C. M., Nikola, T., Stacey, G. J., Bolatto, A. D., Jackson, J. M., Savage, M. L., Davidson, J. A., & Higdon, S. J. 2003, ApJ, 586, 891
- Brouillet et al. (2005) Brouillet, N., Muller, S., Herpin, F., Braine, J., & Jacq, T. 2005, A&A, 429, 153
- Carilli et al. (2005) Carilli, C. L., Solomon, P., Vanden Bout, P., Walter, F., Beelen, A., Cox, P., Bertoldi, F., Menten, K. M., Isaak, K. G., Chandler, C. J., & Omont, A. 2005, ApJ, 618, 586
- Carlstrom (1990) Carlstrom, J. E. 1990, in ASP Conf. Ser. 12: The Evolution of the Interstellar Medium, ed. L. Blitz, 337
- Cernicharo et al. (2006) Cernicharo, J., Pardo, J. R., & Weiss, A. 2006, ApJ, 646, L49
- Christopher et al. (2005) Christopher, M. H., Scoville, N. Z., Stolovy, S. R., & Yun, M. S. 2005, ApJ, 622, 346
- Downes et al. (1995) Downes, D., Solomon, P. M., & Radford, S. J. E. 1995, ApJ, 453, L65
- Gao et al. (2007) Gao, Y., Carilli, C. L., Solomon, P. M., & Vanden Bout, P. A. 2007, ApJ, accepted (astro-ph/0703548)
- Gao & Solomon (2004) Gao, Y. & Solomon, P. M. 2004, ApJS, 152, 63
- García-Burillo et al. (2006) García-Burillo, S., Graciá-Carpio, J., Guélin, M., Neri, R., Cox, P., Planesas, P., Solomon, P. M., Tacconi, L. J., & Vanden Bout, P. A. 2006, ApJ, 645, L17
- García-Burillo et al. (2000) García-Burillo, S., Martín-Pintado, J., Fuente, A., & Neri, R. 2000, A&A, 355, 499
- Graciá-Carpio et al. (2006) Graciá-Carpio, J., García-Burillo, S., Planesas, P., & Colina, L. 2006, ApJ, 640, L135
- Greve et al. (2006) Greve, T. R., Papadopoulos, P. P., Gao, Y., & Radford, S. J. E. 2006, ApJ, submitted (astro-ph/0610378)
- Güsten et al. (2006) Güsten, R., Nyman, L. Å., Schilke, P., Menten, K., Cesarsky, C., & Booth, R. 2006, A&A, 454, L13
- Imanishi et al. (2006) Imanishi, M., Nakanishi, K., & Kohno, K. 2006, AJ, 131, 2888
- Imanishi et al. (2004) Imanishi, M., Nakanishi, K., Kuno, N., & Kohno, K. 2004, AJ, 128, 2037
- Jackson et al. (1995) Jackson, J. M., Paglione, T. A. D., Carlstrom, J. E., & Rieu, N.-Q. 1995, ApJ, 438, 695
- Klein et al. (2006) Klein, B., Philipp, S. D., Krämer, I., Kasemann, C., Güsten, R., & Menten, K. M. 2006, A&A, 454, L29
- Kohno et al. (2001) Kohno, K., Matsushita, S., Vila-Vilaró, B., Okumura, S. K., Shibatsuka, T., Okiura, M., Ishizuki, S., & Kawabe, R. 2001, in ASP Conf. Ser. 249: The Central Kiloparsec of Starbursts and AGN: The La Palma Connection, ed. J. H. Knapen, J. E. Beckman, I. Shlosman, & T. J. Mahoney, 672
- Lehnert & Heckman (1995) Lehnert, M. D. & Heckman, T. M. 1995, ApJS, 97, 89
- Martín et al. (2006) Martín, S., Mauersberger, R., Martín-Pintado, J., Henkel, C., & García-Burillo, S. 2006, ApJS, 164, 450
- Meijerink & Spaans (2005) Meijerink, R. & Spaans, M. 2005, A&A, 436, 397
- Meijerink et al. (2007) Meijerink, R., Spaans, M., & Israel, F. P. 2007, A&A, 461, 793
- Melo et al. (2002) Melo, V. P., Pérez García, A. M., Acosta-Pulido, J. A., Muñoz-Tuñón, C., & Rodríguez Espinosa, J. M. 2002, ApJ, 574, 709
- Nakanishi et al. (2005) Nakanishi, K., Okumura, S. K., Kohno, K., Kawabe, R., & Nakagawa, T. 2005, PASJ, 57, 575
- Nguyen-Q-Rieu et al. (1992) Nguyen-Q-Rieu, Jackson, J. M., Henkel, C., Truong, B., & Mauersberger, R. 1992, ApJ, 399, 521
- Nguyen-Q-Rieu et al. (1989) Nguyen-Q-Rieu, Nakai, N., & Jackson, J. M. 1989, A&A, 220, 57
- Nguyen-Rieu et al. (1994) Nguyen-Rieu, N.-R., Viallefond, F., Combes, F., Jackson, J. M., Lequeux, J., Radford, S., & Truong-Bach, T.-B. 1994, in ASP Conf. Ser. 59: IAU Colloq. 140: Astronomy with Millimeter and Submillimeter Wave Interferometry, ed. M. Ishiguro & J. Welch, 336
- Paglione (1997) Paglione, T. A. D. 1997, PhD thesis, Boston University
- Paglione et al. (1997) Paglione, T. A. D., Jackson, J. M., & Ishizuki, S. 1997, ApJ, 484, 656
- Paglione et al. (1995) Paglione, T. A. D., Tosaki, T., & Jackson, J. M. 1995, ApJ, 454, L117
- Paglione et al. (2001) Paglione, T. A. D., Wall, W. F., Young, J. S., Heyer, M. H., Richard, M., Goldstein, M., Kaufman, Z., Nantais, J., & Perry, G. 2001, ApJS, 135, 183
- Paglione et al. (2004) Paglione, T. A. D., Yam, O., Tosaki, T., & Jackson, J. M. 2004, ApJ, 611, 835
- Papadopoulos (2007) Papadopoulos, P. P. 2007, ApJ, 656, 792
- Peng et al. (1996) Peng, R., Zhou, S., Whiteoak, J. B., Lo, K. Y., & Sutton, E. C. 1996, ApJ, 470, 821
- Phillips & Lazio (1995) Phillips, J. A. & Lazio, T. J. W. 1995, ApJ, 442, L37
- Rekola et al. (2005) Rekola, R., Richer, M. G., McCall, M. L., Valtonen, M. J., Kotilainen, J. K., & Flynn, C. 2005, MNRAS, 361, 330
- Rickard & Palmer (1981) Rickard, L. J. & Palmer, P. 1981, ApJ, 243, 765
- Rickard et al. (1977) Rickard, L. J., Turner, B. E., Palmer, P., Morris, M., & Zuckerman, B. 1977, ApJ, 214, 390
- Riechers et al. (2006) Riechers, D. A., Walter, F., Carilli, C. L., Weiss, A., Bertoldi, F., Menten, K. M., Knudsen, K. K., & Cox, P. 2006, ApJ, 645, L13
- Sakamoto et al. (2006) Sakamoto, K., Ho, P. T. P., Iono, D., Keto, E. R., Mao, R.-Q., Matsushita, S., Peck, A. B., Wiedner, M. C., Wilner, D. J., & Zhao, J.-H. 2006, ApJ, 636, 685
- Schöier et al. (2005) Schöier, F. L., van der Tak, F. F. S., van Dishoeck, E. F., & Black, J. H. 2005, A&A, 432, 369
- Seaquist & Frayer (2000) Seaquist, E. R. & Frayer, D. T. 2000, ApJ, 540, 765
- Solomon et al. (2003) Solomon, P., Vanden Bout, P., Carilli, C., & Guelin, M. 2003, Nature, 426, 636
- Solomon et al. (1992) Solomon, P. M., Downes, D., & Radford, S. J. E. 1992, ApJ, 387, L55
- Solomon et al. (1997) Solomon, P. M., Downes, D., Radford, S. J. E., & Barrett, J. W. 1997, ApJ, 478, 144
- Sorai et al. (2002) Sorai, K., Nakai, N., Kuno, N., & Nishiyama, K. 2002, PASJ, 54, 179
- Spergel et al. (2007) Spergel, D. N., et al. 2007, ApJS, 170, 377
- Spergel et al. (2003) Spergel, D. N., Verde, L., Peiris, H. V., Komatsu, E., Nolta, M. R., Bennett, C. L., Halpern, M., Hinshaw, G., Jarosik, N., Kogut, A., Limon, M., Meyer, S. S., Page, L., Tucker, G. S., Weiland, J. L., Wollack, E., & Wright, E. L. 2003, ApJS, 148, 175
- Strickland et al. (2000) Strickland, D. K., Heckman, T. M., Weaver, K. A., & Dahlem, M. 2000, AJ, 120, 2965
- Ulvestad (2000) Ulvestad, J. S. 2000, AJ, 120, 278
- Vanden Bout et al. (2004) Vanden Bout, P. A., Solomon, P. M., & Maddalena, R. J. 2004, ApJ, 614, L97
- Wagg et al. (2005) Wagg, J., Wilner, D. J., Neri, R., Downes, D., & Wiklind, T. 2005, ApJ, 634, L13
- Wang et al. (2004) Wang, M., Henkel, C., Chin, Y.-N., Whiteoak, J. B., Hunt Cunningham, M., Mauersberger, R., & Muders, D. 2004, A&A, 422, 883
- Weaver et al. (2002) Weaver, K. A., Heckman, T. M., Strickland, D. K., & Dahlem, M. 2002, ApJ, 576, L19
- Weiss et al. (2007) Weiss, A., Downes, D., Neri, R., & Walter, F. 2007, A&A, in press (astro-ph/0702669)
- Weiß et al. (2003) Weiß, A., Henkel, C., Downes, D., & Walter, F. 2003, A&A, 409, L41
- Weiß et al. (2005) Weiß, A., Walter, F., & Scoville, N. Z. 2005, A&A, 438, 533
- Wiedner et al. (2002) Wiedner, M. C., Wilson, C. D., Harrison, A., Hills, R. E., Lay, O. P., & Carlstrom, J. E. 2002, ApJ, 581, 229
- Wu et al. (2005) Wu, J., Evans, II, N. J., Gao, Y., Solomon, P. M., Shirley, Y. L., & Vanden Bout, P. A. 2005, ApJ, 635, L173