The MACRO Experiment at Gran Sasso
G. Giacomelli and A. Margiotta
Dipartimento di Fisica dell’Università di Bologna and INFN, 40127 Bologna, Italy
Charles Peck - Fest, Caltech, 2005 ***The meeting was organized by Douglas Michael, who later passed away. Doug was one of the leaders of MACRO.
Abstract
In this overview of the MACRO experiment we recall the structure of the detector and discuss several physics topics: atmospheric neutrinos and neutrino oscillations, high energy neutrino astronomy, searches for WIMPs and for low energy stellar gravitational collapse neutrinos, stringent upper limits on GUT magnetic monopoles, high energy downgoing muons, primary cosmic ray composition and shadowing of primary cosmic rays by the Moon and the Sun.
1 Introduction
MACRO was a large area multipurpose underground detector designed to search for rare events and rare phenomena in the penetrating cosmic radiation. It was optimized to look for the supermassive magnetic monopoles predicted by Grand
Unified Theories (GUT) of the electroweak and strong interactions; it could also perform measurements in areas of astrophysics, nuclear, particle and cosmic ray physics. These include in particular the study of atmospheric
neutrinos and neutrino oscillations, high energy neutrino astronomy, indirect searches for WIMPs, studies of various aspects of the high energy underground muon flux (which is an indirect tool to study the primary cosmic ray composition), searches for rare particles that may exist in the cosmic radiation.
The experiment was located in Hall B of the underground Gran Sasso Lab and started data taking with part of the apparatus in 1989; it was completed in early 1995 and was running in its final configuration until the end of 2000.
The detector had global dimensions of m3 and provided a total acceptance of 10000 to an isotropic flux of particles.
The detector had a modular structure: it was divided into six sections referred to as supermodules.
The average rock overburden was m.w.e., while the minimum was m.w.e. This defines the minimum muon energy at the surface as 1.3 in order to reach MACRO.
It may be worth pointing out that all the physics and astrophysics items proposed in the 1984 Proposal were covered and good results were obtained on each of them, even beyond the most rosy anticipations [1]-[50].
The collaboration consisted of 140 physicists and engineers from 6 Italian and 6 US Institutions, 1 Moroccan group and visitors from various developing countries. The complete list of names can be found in Ref. [10], [35], [50]. There was a close cooperation with the EASTOP Collaboration which operated an Extensive Air Shower Array at Campo Imperatore.
2 The Detector
Redundancy and complementarity were the primary goals in designing the experiment. Since few events were expected, multiple signatures and ability to perform cross checks with various parts of the apparatus were important. The detector was composed of three sub-detectors: liquid scintillation counters, limited streamer tubes and nuclear track detectors [16][35]. Each one of them could be used in “stand-alone” and in “combined” mode. The layout of the experiment is shown in Fig. 1. Notice the division in the lower and in the upper part (this was often referred to as the Attico); the inner part of the Attico was empty and lodged the electronics. Fig. 2 shows a cross section of the apparatus.
The scintillation subdetector. Each supermodule contained 77 scintillation counters, divided into three horizontal planes (bottom, center, and top) and two vertical planes (east and west). The lower part of the north and south faces of the detector were covered by vertical walls with 7 scintillators each; the upper parts of these faces were open to allow access to the readout electronics.
The active volume of each horizontal scintillator was , while for the vertical ones it was . All scintillator boxes were filled with a mixture of high purity mineral oil () and pseudocumene (), with an additional /l of PPO and /l of bis-MSB wavelength shifters. The horizontal counters were seen by two photomultipliers (PMTs) and the vertical counters by one PMT at each end. The total number of scintillators was with a total active mass of . Minimum ionizing muons, when crossing vertically the of scintillator, released an average energy of and were measured with a timing and longitudinal position resolution of and , respectively.
The scintillation counters were equipped with specific triggers for rare particles, muons and low energy neutrinos from stellar gravitational collapses. The Slow Monopole Trigger (SMT) was sensitive to MMs with velocities from to , the Fast Monopole Trigger (FMT) to poles with velocities from to , the Lightly Ionizing Particle trigger was sensitive to fractionally charged particles, the Energy Reconstruction Processor (ERP) and “CSPAM” were primarily muon triggers (but used also for relativistic monopoles) and the gravitational collapse neutrino triggers (the Pulse Height Recorder and Synchronous Encoder –PHRASE– and the ERP) were optimized to trigger on bursts of low energy events in the liquid scintillators. The scintillator system was complemented by a waveform digitizing (WFD) system used in rare particle searches, and in any occasion where knowledge of the PMT waveform was useful.
The streamer tube subsystem. The lower part of the detector contained 10 horizontal planes of limited streamer tubes, the middle 8 of which were interleaved by 7 rock absorbers (total thickness ). These set a energy threshold for muons vertically crossing the lower part of the detector. At the top of the Attico there were 4 horizontal streamer tube planes, 2 above and 2 below the top scintillator layer. On each lateral wall 6 streamer tube planes sandwiched the corresponding vertical scintillator plane (3 streamer planes on each side). Each tube had a cross section and was long. The total number of tubes was , all filled with a gas mixture of () and n-pentane (). They had Cu/Be wires and stereo pickup strips at an angle of . The tracking resolution of the streamer tube system was , corresponding to an angular accuracy of over the 9.3 m height of MACRO. The real angular resolution was limited to by multiple Coulomb scattering of muons in the rock above the detector. The streamer tubes were read by -channel cards (1 channel for each wire) which discriminated the signals and sent the analog information (time development and total charge) to an ADC/TDC system (the QTP). The signals were used to form 2 different chains (Fast and Slow) of pulses, which were the inputs for the streamer tube Fast and Slow Particle Triggers. In the 11 years of operation only 50 wires were lost.
The nuclear track subdetector was deployed in three planes, horizontally in the center of the lower section and vertically on the East and North faces. The detector was divided in modules, which could be individually extracted and substituted. Each module ( ) was composed of three layers of CR, three layers of Lexan and Aluminium absorber to stop nuclear fragments.
The Transition Radiation Detector (TRD) was installed inside the Attico. It was composed of 3 modules (overall dimensions ) and it was made of thick polyethylene foam radiators and proportional counters filled with () and (). The TRD measured muon energies in the range ; muons of higher energies were counted.
Fig. 3 shows four photographs of Hall B taken from its south side. Fig. 4 shows a “group” of 11 downgoing muons.
(a) (b) (c) (d)
3 Atmospheric neutrino oscillations
A high energy primary cosmic ray (CR), proton or nucleus, interacts in the upper atmosphere producing a large number of charged pions and kaons, which decay yielding muons and muon neutrinos; also the muons decay yielding and . The ratio of the numbers of to is 2 and . Atmospheric neutrinos are produced in a spherical surface at 10-20 km above ground and they proceed towards the earth.
If neutrinos have non-zero masses, one has to consider the weak flavour eigenstates and the mass eigenstates . The flavour eigenstates are linear combinations of the mass eigenstates. For 2 flavour () and 2 mass eigenstates
| (1) |
where is the mixing angle. The survival probability of the ”beam” is
| (2) |
where , is the distance travelled by the from production to detection.
Atmospheric neutrinos are well suited for the study of neutrino oscillations, since they have energies from a fraction of GeV up to more than 100 GeV and they travel distances from few tens of km up to 13000 km; thus ranges from km/GeV to km/GeV. They are particularly useful to study oscillations for small , while matter effects can be studied with their high energy components.
The early water Cherenkov detectors and the tracking calorimeters
measured
and charged current (CC) interactions. The results were
expressed in terms of the double ratio , where
is the ratio of observed
and events and
is the same ratio for Monte Carlo (MC) events. The ratios from IMB [51] and Kamiokande [52] were smaller than expectations, while
NUSEX [53], Frejus [54] and Baksan [55] did not find any deviation.
Later, the Soudan 2 tracking and shower calorimeter detector confirmed the
anomaly in the double ratio for contained events [56]. MACRO reported
in 1995 a measurement of upthroughgoing muons from of 50 GeV, in which there was an anomalous zenith distribution and a deficit in the total number of observed upgoing muons [17].
In 1998 Soudan 2, MACRO and SuperKamiokande (SK) provided strong indications in favour of oscillations [57][25][58][59]. Later new results were presented by the 3 experiments and by others [60].
MACRO detected upgoing ’s via CC interactions ; upgoing muons were identified with the streamer tube system (for tracking) and the scintillator system (for time-of-flight measurement). The events were classified in different categories:
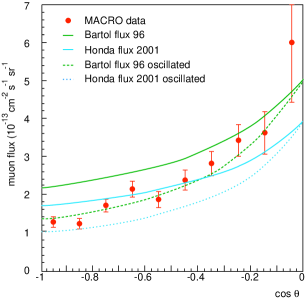
Upthroughgoing muons ( GeV) come from interactions in the rock below the detector of with 50 GeV. The MC uncertainties arising from the neutrino flux, cross section and muon propagation on the expected flux of upthroughgoing muons were estimated to be 17; this systematic error is
mainly a scale uncertainty.
In order to verify that different flux simulations affect the zenith distribution at the level of only a few percent (while there is an effect of the order of on the event rates) MACRO compared data with the predictions of the Bartol96 [61], FLUKA [64] and HKKM01 [63] MCs, see fig. 5a. The shape of the angular distribution and the absolute value strongly favour neutrino oscillations with eV2 and maximum mixing. The absolute values of the MACRO upthroughgoing muon data are higher than those predicted by the FLUKA and HKKM01 MC, while the shapes of the oscillated and non oscillated angular distributions from the different MCs agree within 5%.
A similar situation is found in the SK data [58]. The electron-like events were in agreement with the HKKM95 [62] MC predictions in absence of oscillations, while they are higher than the HKKM01 [63] non oscillated MC. For muon-like events, the new MC predictions are low for the SK data, especially for upthroughgoing muons. Previous comparisons between the SK muon data and the HKKM95 predictions had shown a global deficit of events and a zenith distribution shape in agreement with oscillations [58].
The difference between the new and old MC predictions is probably due to the use of a new fit of the cosmic ray data [65]. Recent results by the L3C and BESS experiments [66] on the primary cosmic ray fit show good agreement with the Bartol96 and HKKM95 predictions and a disagreement with the new fit of the cosmic ray data [65].
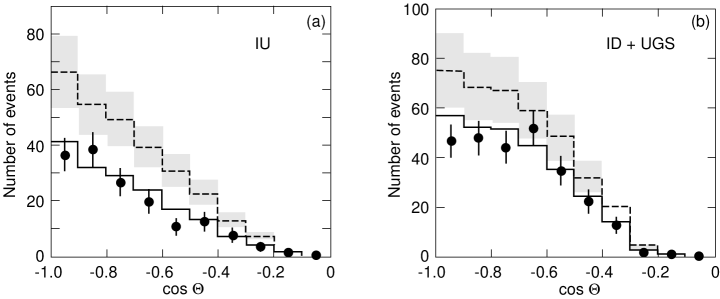
Low energy events. Semicontained upgoing muons (IU) come from
interactions inside the lower apparatus. Up stopping muons (UGS)
are due to external interactions yielding upgoing muons stopping in the
detector; the semicontained downgoing muons (ID) are due to downgoing
’s with interaction vertices in the lower detector; the lack
of time information prevents to distinguish between the two subsamples.
An almost equal number of UGS and ID events is expected. The average
parent neutrino energy for all these events is 2-3 GeV.
The angular distributions are compared with MC
predictions without oscillations in Figs. 5b,c. Our low
energy data show a uniform deficit
over the whole angular distribution with respect to the Bartol96 predictions, thus favouring oscillations.
| Events | MC [61] | Data/MC | |
|---|---|---|---|
| Upthr. | 857 | 1169 | 0.73 |
| IU | 157 | 285 | 0.55 |
| ID+UGS | 262 | 375 | 0.70 |
Table 1 gives the measured and expected events for the 3 topologies. They all favor oscillations. The distribution, Fig. 7a, deviates from MC expectations without oscillations; the deviations point to the same oscillation scenario [31] [34] [50].
 (a) (b) (c)
against . Matter effects due to the difference between the weak interaction effective potential for muon neutrinos with respect to sterile neutrinos, which have null potential, yield different total number and different zenith distributions of upthroughgoing muons [34]. The measured ratio between the events with and with was used [34]. In this ratio most of the theoretical uncertainties on neutrino flux and cross sections cancel (combining the experimental and theoretical errors in quadrature, a global uncertainty of 6% is obtained). The measured ratio is , to be compared with and . One concludes that oscillations (with any mixing) are excluded at the 99.8% c.l. compared to the channel, see Fig. 6.
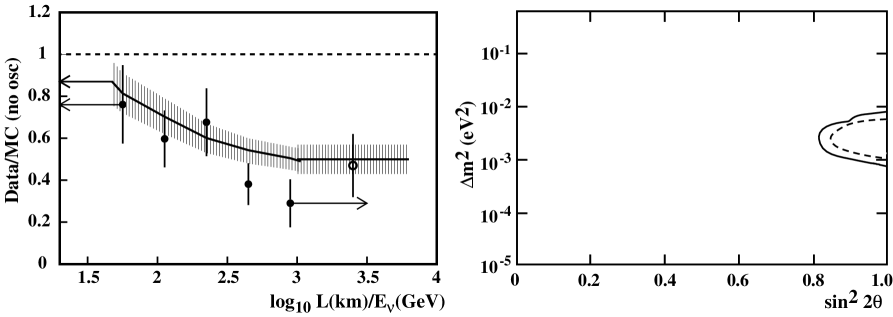
energy estimate by Multiple Coulomb Scattering (MCS) of upthroughgoing muons. Since MACRO was not equipped with a magnet, the only way to estimate the muon energy was through their Multiple Coulomb Scattering (MCS) in the absorbers. Two analyses were performed [39] [46]. The first was made studying the deflection of muons using the streamer tubes in digital mode. This method had a spatial resolution of 1 cm. The second analysis was performed using the streamer tubes in “drift mode”. To check the electronics and the feasibility of the analysis two tests were performed at the CERN PS. The space resolution was 3 mm. For each muon, 7 MCS variables were defined and given in input to a Neural Network, trained with MC events of known energy crossing the detector at different zenith angles. The output of this program gave the muon energy estimate event by event. The sample of upthroughgoing muons was separated in 4 subsamples with average energies of 12, 20, 50 and 100 GeV. The ratios Data/MC as a function of for upthroughgoing muons are plotted in Fig. 7a; they are in agreement with the oscillation hypothesis [31] [34] [50].
 (a) (b)
New determination of the oscillation parameters. In the early analyses MACRO fitted the shape of the upthroughgoing muon zenith distribution and the absolute flux compared to Bartol96. This yielded eV2 and maximal mixing [31] [34]. Later, in order to reduce the effects of systematic uncertainties in the MC simulations, MACRO used the following three independent ratios (it was checked that FLUKA, HKKM01 and Bartol96 MC yield the same predictions to within ):
(i) High Energy Data: zenith distribution ratio:
(ii) High Energy Data: energy measurement ratio:
(iii) Low Energy Data: .
The no oscillation hypothesis has a probability P3 and is thus ruled out by . By fitting the 3 ratios to the oscillation formulae, we obtained eV2 and the allowed region indicated by the solid line in Fig. 7b. There is good consistency between the old and new methods [50]. Using Bartol96, it is possible to add the information on absolute fluxes:
(iv) High energy data (systematic error 17): .
(v) Low energy semicontained muons (scale error ): .
These informations leave the best fit values unchanged and reduce the area of the allowed region, as indicated by the dashed line in Fig. 7b.
( significance).
Fig. 8 shows one page of the 1984 proposal [1]. It stated that MACRO could yield valuable information on possible neutrino oscillations in the then unexplored region indicated by the shaded area: in fact atmospheric neutrino oscillations were found there! [67].
Exotic oscillations. MACRO and SuperK data have been used to search for sub-dominant oscillations due to possible Lorentz invariance violation (or violation of the equivalence principle). In the first case there could be mixing between flavor and velocity eigenstates. The data disfavor these exotic possibilities, even at a sub-dominant level. Stringent 90 c.l. limits were placed in the Lorentz invariance violation parameters at =0 and at 1 [68] [69].
Neutrino decay. It could be another exotic partial explanation for neutrino disappearence; no radiative decay has been observed [70].
4 Search for Astrophysical Point Sources of HE ’s
High energy ’s are expected to come from several galactic and extragalactic sources. Neutrino production requires astrophysical accelerators of charged particles and astrophysical beam dumps. The good angular resolution of MACRO allowed a sensitive search for upgoing muons produced by neutrinos coming from celestial sources, with a negligible atmospheric neutrino background. An excess of events was searched for around the positions of known sources in (half width) angular bins. This value was chosen to take into account the angular smearing produced by the multiple muon scattering in the rock below the detector and by the energy-integrated angular distribution of the scattered muon with respect to the neutrino direction. In a total livetime of 6.16 y we obtained 1356 events, Fig. 9. The 90% c.l. upper limits on the muon fluxes from specific celestial sources lay in the range , Fig. 9b. The solid line is MACRO sensitivity vs. declination. Notice the two cases, GX339-4 (, ) and Cir X-1 (, ), with 7 events: in Fig. 9 they are considered as background, thus the upper flux limits are higher; but they could also be indications of signals [33].
We searched for time coincidences of our upgoing muons with -ray bursts as given in the BATSE 3B and 4B catalogues, for the period from 1991-2000 [33]. No statistically significant time correlation was found.
We have also searched for a diffuse astrophysical neutrino flux for which we establish a flux upper limit at the level of [37].
(a) (b)
5 Indirect Searches for WIMPs
Weakly Interacting Massive Particles (WIMPs) may be part of the galactic dark matter; they may be intercepted by celestial bodies, slowed down and trapped in their centers, where WIMP and anti-WIMP could annihilate yielding upthroughgoing muons. The annihilations yield of GeV energy, in small angular windows from their centers.
For the Earth we have chosen a cone around the vertical: we found 863 events. The MC expectation for atmospheric without oscillations gave a larger number of events. We set a conservative flux upper limit assuming that the measured number of events equals the expected ones. The c.l. limits for the flux of upgoing muons are shown in Fig. 10a (it varies from about 0.8 to 0.5 ). If the WIMPs are identified with the smallest mass neutralino, the MACRO limit may be used to constrain the stable neutralino mass, following the model of Bottino et al. [71] [28], see Fig. 10a.
A similar procedure was used to search for from the Sun, using 10 search cones. In the absence of statistically significant excesses muon upper limits at the level of were established, see Fig. 10b.
(a) (b)
6 Magnetic Monopoles and Nuclearites
The concept of magnetic monopole (MM) may be traced back to the origin of magnetism. In 1931 Dirac introduced MMs in order to explain the quantization of the electric charge, obtaining the formula e, from which c.g.s.; n is an integer [72].
Supermassive monopoles predicted by Grand Unified Theories (GUT) of the electroweak and strong interactions should have masses of the order of [73]. These MMs could be present in the penetrating cosmic radiation and are expected to arrive isotropically from all directions and to have typical galactic velocities, 10, if trapped in our Galaxy. MMs trapped in our solar system or in the supercluster of galaxies may travel with typical velocities of the order of and , respectively [74].
The search for GUT magnetic monopoles was one of the main objectives of MACRO.
Monopoles, in the presence of strong magnetic fields, may reach higher velocities. Possible Intermediate Mass MMs could achieve relativistic velocities, but they could reach MACRO only from above.
The reference sensitivity level for a significant MM search is the Parker bound [74], the maximum monopole flux compatible with the survival of the galactic magnetic field. This limit is of the order of , but it could be reduced by almost an order of magnitude when considering the survival of a small galactic magnetic field seed. Our experiment was designed to reach a flux sensitivity for GUT MMs well below the Parker bound, in the MM velocity range The three MACRO sub-detectors had sensitivities in wide -ranges, with overlapping regions; thus they allowed multiple signatures of the same rare event candidate.
No candidate was found in many years of data taking by any of the three subdetectors. The MM flux limits set by different analyses using the three subdetectors over different -range were combined to obtain a global MACRO limit. For each value, the global time integrated acceptance was computed as the sum of the independent portions of each analysis. The limits versus are shown in Fig. 11 together with the limits set by other experiments [74, 86, 87]; other limits are quoted in [40]. The limits obtained with the MACRO NTDs only are shown in Fig. 11b: our limits are the best direct limits existing for GUT MMs over a wide range of , see ref. [75] [76] for stringent limits with indirect experiments. Energy losses are computed in ref. [67] [77].
A specific search for GUT monopole catalysis of nucleon decay was made with our streamer tube system. Since no event was found, one can place a monopole flux upper limit at the level of for , valid for a large catalysis cross section, [41]. The flux limit for the standard direct MM search with streamer tubes is valid for .
The MM searches based on the scintillator and on the nuclear track subdetectors were also used to set new upper limits on the flux of cosmic ray nuclearites (strange quark matter), over the same range. If nuclearites are part of the dark matter in our galaxy, the most interesting is of the order of [78]. Some of the nuclearite limits apply also to charged Q-balls (agglomerates of squarks, sleptons and Higgs fields and other objects)[79][80][88].
The energy losses of MMs, dyons and of other heavy particles in the Earth and in different detectors for various particle masses and velocities were computed in [77].
7 Neutrinos from Stellar Gravitational Collapses
A stellar gravitational collapse (GC) of the core of a massive star is expected to produce a burst of all types of and with energies of MeV and a duration of 10 s. The ’s can be detected via the process in liquid scintillators; events were expected in our scintillator for a stellar collapse at the center of our Galaxy.
We used two electronic systems for detecting ’s from stellar gravitational collapses. The first system was based on the dedicated PHRASE trigger, the second one was based on the ERP trigger, see sect. 2. Both systems had an energy threshold of 7 and recorded pulse shape, charge and timing informations. Immediately after a 7 trigger, the PHRASE system lowered its threshold to about 1 MeV, for , to detect (with a efficiency) the released in the reaction induced by the neutron produced in the primary process.
A redundant supernova alarm system was in operation, alerting immediately the physicists on shift. We defined a general procedure to alert the physics and astrophysics communities in case of an interesting alarm. Finally, a procedure to link the various supernova observatories around the world was set up [23].
The effective MACRO active mass was 580 t; the live-time fraction in the last four years was 97.5 %. No stellar gravitational collapse was observed in our Galaxy from the beginning of to the end of 2000 [45].
8 Cosmic Ray Muons
MACRO large area and acceptance allowed to record single muons, multiple muons and to study
many aspects of physics and astrophysics of cosmic rays (CR).
Muon vertical intensity. The underground muon vertical
intensity vs rock thickness gives information on the high energy
() atmospheric muon flux and on
the all-particle primary CR spectrum. The results constrain
the CR production and interaction models. A study
performed in covered the overburden range
[16].
Analysis of high multiplicity muon bundles. The multiplicity distribution of muon bundles provides information on the primary CR composition model. The decoherence function (the distribution of the distance between two muons in a muon bundle) gives information on the hadronic interaction features at high energies; a study was performed using a large sample of data and improved MC methods, Fig. 12a [29]. Different hadronic interaction models (DPMJET, QGSJET, SIBYLL, HEMAS, HDPM) interfaced to the HEMAS and CORSIKA shower propagation codes were used.
Muon correlations inside a bundle were studied, using the so called correlation integral [88], to search for dynamical correlations in the bundles. Since the cascade development in atmosphere is mainly determined by the number of “steps” in the “tree formation”, we expect a different behaviour for cascades originated by light and heavy CR primaries. For the same reason, the analysis is less sensitive to the hadronic interaction model used in the simulations. For TeV, the composition model derived from the analysis of the muon multiplicity distribution [19, 20] is almost independent of the interaction model.
We also searched for substructures (“clusters”)
inside muon bundles [82]. The search
was performed by means of different software algorithms; the study
is sensitive to both hadronic interaction and primary CR
composition models.
If the primary composition has been determined by the first method, a choice of the bundle topology
gives interesting connections with the early hadronic interaction
features in the atmosphere. The comparison between our data and MC simulations allowed to place constraints on the interaction models. The same MC study has
shown that muon bundles with a central core and an isolated cluster
with at least two muons are the result of random associations. An analysis of the decoherence
function for high multiplicity events has shown that QGSJET is the hadronic
interaction model which better reproduces the underground observables.
The ratio double muons/single muons: The ratio / of double muon over
single muon events is expected to decrease at increasing rock
depths.
The LVD collaboration reported an increase of the ratio multiple-muons to all-muons for rock depths .
We measured the ratio as a function of the rock depth, using also multiple muon events at
large zenith angles. A detailed MC simulation was made using the HEMAS code, with the zenith
angle extended up to .
The event direction
was reconstructed by the tracking system. The
rock depth is provided by the Gran Sasso map function up to . MC simulations have shown that the percentage
of events with mis-reconstructed multiplicity is . Attention was
devoted to “cleaning” the events from spurious effects; we also made a
visual scanning of the events.
Our measured ratios / as a function of the rock depth,
Fig. 12(b), are
in agreement with the expectation of a monotonic decrease
up to . Above this value,
the low statistics does not allow a firm conclusion
on a possible increase of / [82].
Muon Astronomy [68]. Some past experiments reported
excesses of a modulated muon flux from the direction of Cyg X-. Our data did not indicate
excesses above background, both for steady
dc fluxes and for modulated ac fluxes.
(a) (b)
Our pointing precision was checked via the shadow of the Moon and of the Sun on primary CRs. The pointing resolution was checked with double muons. The angle containing of the events in a bin was .
All sky d.c. survey. The sky, in galactic coordinates,
was divided into bins of equal solid angle,
, , corresponding
to cones of half angles. In order to remove
edge effects, three other surveys were done, by shifting the map by
one-half-bin in , by one-half bin in sin
and with both and sin shifted. For each solid angle bin we computed the deviation from the
average muon intensity, after background subtraction.
No deviation was found; the flux upper limits were
.
Specific point-like d.c. sources. For
Cyg X-3, Mrk421, Mrk501 we searched in a narrow cone (
half angle) around the source direction. We obtained flux limits at
the level of . There is a
small excess of in the direction
of Mrk501.
Modulated a.c. search from Cyg X-3 and Her X-1. No evidence
for an excess was observed and the limits are ,
see Fig. 13 .
Search for bursting episodes. A search was made for pulsed muon signals in a
half angle cone around the location of high energy photon sources. Bursting episodes of duration of
1 day were searched for with two different methods. In the
first we searched for daily excesses of muons above the background,
also plotting cumulative excesses day by day. In the second method
we computed day by day the quantity where P
is the probability to observe a burst at least as large as .
We find some possible excesses for Mrk421 on the days 7/1/93, 14/2/95,
27/8/97, 5/12/98.
Seasonal variations. Underground muons are produced by mesons
decaying in flight in the atmosphere. The muon flux thus depends
on the ratio between decay and interaction probabilities of
the parent mesons, which are sensitive to the atmospheric density
and temperature. The flux decreases in
winter, when the temperature is lower and the atmosphere more dense,
and increases in summer; the variations are of , Fig. 14.
Solar daily variations. Because of changes in the day-night
temperatures we expect solar daily variations similar to seasonal
variations, but of smaller amplitudes. These variations were found with an amplitude at a significance of 3.4 , Fig. 15a.
(a) (b)
(a) (b)
Sidereal anisotropies are
due to the motion of the solar system in the “sea” of relativistic cosmic rays
in our galaxy. They are expected to yield a small effect.
After a correction due to the motion of the Earth around the Sun, we
observed variations with an amplitude and a phase
with a statistical significance of 3 , Fig. 15b.
Moon and sun shadows of primary cosmic rays. The pointing
capability of MACRO was demonstrated by the observed “shadows”
of the Moon and of the Sun. A sample of muons was used to
look at the bidimensional density of the events around the directions
of the Moon and of the Sun, Fig. 16. For the Moon: we looked for events in a window centered on the Moon; the window was divided into
cells, each of dimensions
(); Fig. 16a shows a depletion of events with
a statistical significance of . The observed
slight displacement of the maximum deficit is consistent with the
displacement of the primary protons due to the geomagnetic field.
The same analysis was repeated for muons in the sun window, Fig.
16b. The difference between the apparent sun position
and the observed muon depletion is due to the combined effect of the
magnetic field of the Sun and of the Earth. The observed
depletion has a statistical significance of [44][26].
Muon energy measurement with the TRD detector.
The underground differential energy spectrum of muons was measured
with the TRD detector. Two types of
events were analyzed: “single muons”, i.e. single muons in MACRO
crossing a TRD module, and “double muons”
in MACRO with only one muon crossing the TRD detector. The
measurements refer to muons with energies 0.11 and for 1 [27][42]. In order to evaluate
the local muon energy spectrum, we took into account the TRD
response function.
The average single muon
energy in the underground lab is ;
for double muons is 380 GeV.
9 EAS-TOP/MACRO Coincidences
For coincident events, the Extensive Air Showers EASTOP measured the e.m. size of the showers at Campo Imperatore, while MACRO measured muons underground. The purpose was the study of primary CR composition vs energy reducing the dependence on the interaction and propagation models. The two detectors operated in coincidence for a livetime of 960 days. The number of coincident events was 28160, of which 3752 had shower cores inside the edges of EASTOP (“internal events”) and shower sizes 2; 409 events had , i.e. above the CR knee. The data were analyzed in terms of the QGSJET interaction model implemented in CORSIKA [14][47][48][84].
The e.m. detector of EASTOP covered an effective area of . The array was fully efficient for . The reconstruction capabilities of the air shower parameters for internal events were: for , and for the arrival direction. MACRO considered muons with 4 aligned hits in both views of the horizontal streamer tube planes. Inside the EASTOP effective area, the muon energy threshold at the surface, for muons reaching MACRO, ranged from 1.3 to 1.8 TeV. Coincidences were made off-line, using the absolute time given by a GPS system with an accuracy 1 .
The data considered were the muon multiplicity distributions in different intervals of shower sizes. For each bin the muon distribution was fitted with a superposition of (i) pure and components, or (ii) light and heavy admixtures containing equal fractions of and or and , respectively. All spectra in the simulation have slope . In each interval a expression was minimized.
Fig. 17 shows vs (E in TeV); the shaded regions include the uncertainties for (a) the p/Fe composition model and (b) for the light/heavy model.
(a) (b)
There is an increase of with energy in the CR knee region.
The coincidences allowed to measure the lateral distribution of Cherenkov light collected by EASTOP in the 10100 TeV range associating it with the TeV muon in MACRO. The test provided a validation of the CORSIKA-QGSJET code [84].
10 Nuclear Track Detector Calibrations
Many calibrations of the CR39 nuclear track detector (NTD) were performed with both slow and fast ions. In all measurements we have seen no deviation of its response from the Restricted Energy Loss (REL) model. Stacks of CR and Lexan foils, placed before and after various targets, were exposed to 158 A GeV ions at the CERN-SPS and to 1 A GeV ions at the BNL-AGS. In traversing a target, the beam ions produce nuclear fragments with 82 and 26 for the lead and iron beams, respectively; this allows a measurement of the response of the detector in a region relevant to MM detection. Previous analyses had shown that the CR39 charge resolution for a single measurement is in the range Z 83 (by measurements of the etch-cone heights); at lower Z the measurements of the cone base diameters allow to separate the different charges. Tests were made looking for a possible aging effect, from the time elapsed from the production date to the exposure date [85]. Two sets of sheets, 0.8 y and 2.5 y old, were exposed in 1994 to 158 A GeV ions. For each detected nuclear fragment the reduced etch rate ( and are the track and bulk etching rates) was computed and plotted vs REL. Within the experimental uncertainties, aging effects in the CR39 are negligible.
11 Search for Lightly Ionizing Particles
Free fractionally charged particles could be expected in Grand Unified Theories; the expected charges range from Q=e/5 to Q=e 2/3. They should release a fraction of the energy deposited by a relativistic muon traversing a medium. Lightly Ionizing Particles (LIPs) were searched for in MACRO using a four-fold coincidence between three layers of scintillators and the streamer tube system [32][49]. The 90 % c.l. flux upper limits for LIPs with charges 2e/3, e/3 and e/5 are at the level of .
12 Conclusions
MACRO obtained important results in all the items listed in the proposal :
- GUT Magnetic Monopoles. We obtained the best flux upper limit over
the widest range, thanks to the large acceptance and the redundancy
of the different techniques employed. This limit is a unique
result and it will stand for a long time.
- Atmospheric neutrino oscillations. In this field MACRO had its
major achievements. Analyses of different event topologies, different
energies and the exploitation of Coulomb multiple scattering in the detector
strongly support oscillations.
- High energy astronomy. Our detector was competitive
with other underground/underwater experiments thanks to its good angular accuracy.
- Search for bursts of from stellar gravitational
collapses. MACRO was sensitive to supernovae events in the Galaxy,
it started the SN WATCH system, and for a period it was the only detector in operation.
- Cosmic ray downgoing muons. We observed the shadows of primary CRs by the Moon and the
Sun, the seasonal variation (2 amplitude) over many years, solar
and sidereal variations with reasonable statistical significances. No excesses of secondary muons attributable to astrophysical point sources (steady, modulated or bursting) were observed.
- Exploration of the CR composition around
the “knee” of the primary CR energy.
- Coincidences between MACRO and the EASTOP array. The data indicate an increase with increasing energy of the average Z of the primary CR nuclei.
- Sensitive searches for exotic particles were carried
out: (i) WIMPs, looking
for upgoing muons from the center of the Earth and of the Sun;
(ii) Nuclearites and Q-balls (as byproducts of MM searches).
(iii) Other limits concern possible Lightly Ionizing Particles.
The dismantling of MACRO went regularly and essentially on schedule. We recuperated part of the electronics (modules, circuits, cables, etc) to be used in our Institutions, and donated the photomultipliers and part of the streamer tubes to other experiments.
The MACRO scientific and technical results were published in 50 papers in refereed journals, in 242 contributions to conferences and in invited papers, discussed in 543 Internal Memos, used for 83 italian Laurea theses, 22 italian Dottorato theses, 23 US PhD theses and 5 moroccan theses de Doctorat Nationale.
Acknowledgments
We thank all our colleagues for their cooperation, and wish all the best to Charles Peck.
MACRO acknowledged the support of the Directors and of the staff of the
Gran Sasso Lab. and of the Institutions partecipating in the
experiment, the Istituto Nazionale di Fisica Nucleare (INFN),
the US Department of Energy and the US National Science Foundation. INFN-FAI, ICTP (Trieste), NATO and WorldLab provided
fellowships and grants for non-Italian citizens.
References
-
[1]
Proposal for a large area detector dedicated to monopole searches, astrophysics and cosmic ray physics at the Gran Sasso Lab., LNF preprint, July 10, 1984; CALT-68-1237, Nov.1984.
C. De Marzo et al., Nuovo Cimento 9C(1986)281. - [2] M.Calicchio et al., Nucl. Instr. Meth. Phys. Res. A264(1988)18.
- [3] R.Bellotti et al. Phys. Rev. D42(1990)1396.
- [4] S.Ahlen et al., Phys. Lett. B249(1990)149.
- [5] S.Ahlen et al., Nucl. Phys. B370(1992)432.
- [6] S.Ahlen et al., Phys. Rev. D46(1992)895.
- [7] S.Ahlen et al., Phys. Rev. D46(1992)4836.
- [8] S.Ahlen et al., Astropart. Phys. 1(1992)11.
- [9] S.Ahlen et al., Phys. Rev. Lett. 69(1992)1860.
- [10] S.Ahlen et al., Nucl. Instr. Meth. Phys. Res. A324(1993)337.
- [11] S.Ahlen et al., Astrophys. J. 412(1993)301.
- [12] S.Ahlen et al., Phys. Rev. Lett. 72(1994)608.
- [13] GRACE-MACRO Coll., M.Ambrosio et al., Phys. Rev. D50(1994)3046.
- [14] EASTOP-MACRO Coll., M.Aglietta et al., Phys. Lett. B337(1994)376.
- [15] M.Ambrosio et al., Astropart. Phys. 4(1995)33.
- [16] M.Ambrosio et al., Phys. Rev. D52(1995)3793.
- [17] S.Ahlen et al., Phys. Lett. B357(1995)481.
- [18] M.Ambrosio et al., Astropart. Phys. 6(1997)113.
- [19] M.Ambrosio et al., Phys. Rev. D56(1997)1407.
- [20] M.Ambrosio et al., Phys. Rev. D56(1997)1418.
- [21] M.Ambrosio et al., Astropart. Phys. 7(1997)109.
- [22] M.Ambrosio et al., Phys. Lett. B406(1997)249.
- [23] M.Ambrosio et al., Astropart. Phys. 8(1998)123.
- [24] M.Ambrosio et al., Astropart. Phys. 9(1998)105, hep-ex/9807032.
- [25] M.Ambrosio et al., Phys. Lett. B434(1998)451, hep-ex/9807005.
- [26] M.Ambrosio et al., Phys. Rev. D59(1999)012003, hep-ex/9807006.
- [27] M.Ambrosio et al., Astropart. Phys. 10(1999)11, hep-ex/9807009.
- [28] M.Ambrosio et al., Phys. Rev. D60(1999)082002, hep-ex/9812020.
- [29] M.Ambrosio et al., Phys. Rev. D60(1999)032001, hep-ex/9901027.
- [30] M.Ambrosio et al., Eur. Phys. J. C13(2000)453, hep-ex/9904031.
- [31] M.Ambrosio et al., Phys. Lett. B478(2000)5, hep-ex/0001044.
- [32] M. Ambrosio et al.,Phys. Rev. D62(2000)052003, hep-ex/0002029.
- [33] M. Ambrosio et al., Astrophys. J. 546(2001)1038, astro-ph/0002492.
- [34] M.Ambrosio et al., Phys. Lett. B517(2001)59, hep-ex/0106049.
- [35] M.Ambrosio et al., Nucl. Instr. Meth. Phys. Res. A486(2002)663.
- [36] M.Ambrosio et al., Astropart. Phys. 18(2002)27, hep-ex/0110083.
- [37] M.Ambrosio et al., Astropart. Phys. 19 (2003)1, astro-ph/0203181.
- [38] M.Ambrosio et al., Astropart. Phys. 18 (2003) 615, hep-ph/0204188.
- [39] M.Ambrosio et al., Nucl. Instr. Meth. Phys. Res. A492 (2002)376, physics/0203018.
- [40] M.Ambrosio et al., Eur. Phys. J. C25 (2002) 511, hep-ex/0207020.
- [41] M.Ambrosio et al., Eur. Phys. J. C26 (2002) 163, hep-ex/0207024.
- [42] M.Ambrosio et al., Astropart. Phys. 19 (2003) 313, hep-ex/0207043.
- [43] M.Ambrosio et al., Phys. Rev. D67 (2003) 042002, astro-ph/0211119.
- [44] M.Ambrosio et al., Astropart. Phys. 20 (2003) 145, astro-ph/0302586.
- [45] M.Ambrosio et al., Eur. Phys. J. C37 (2004) 265.
- [46] M.Ambrosio et al.,Phys. Lett. B566 (2003) 35, hep-ex/0304037.
- [47] EASTOP-MACRO Coll., M.Aglietta et al., Astropart. Phys. 20 (2004) 641.
- [48] EASTOP-MACRO Coll., M.Aglietta et al., Astropart. Phys. 21 (2004) 223.
- [49] M.Ambrosio et al., hep-ex/0402006(2004).
- [50] M.Ambrosio et al., Eur. Phys. J. C36 (2004) 323.
- [51] IMB Coll., R. Becker-Szendy et al., Phys. Rev. D46(1992)372.
- [52] Kamiokande Coll., Y. Fukuda et al., Phys. Lett. B335(1994)237.
- [53] NUSEX Coll., M.Aglietta et al., ICRC Proc. 2014(1993)446.
- [54] Frejus Coll., K.Daum et al., Z. Phys. C66(1995)417.
- [55] Baksan Coll., S.Mikheyev et al., Phys. Lett. B391 (1997)491; Phys. Lett. B449(1999)137.
- [56] Soudan 2 Coll., W.W.M. Allison et al., Phys. Lett.B391 (1997) 491.
- [57] Soudan 2 Coll., W.W.M. Allison et al., Phys. Lett. B449 (1999) 137; M. Sanchez et al., Phys. Rev. D68(2003)113004.
- [58] SuperKamiokande Coll., Y.Fukuda et al., Phys. Rev. Lett. 81(1998)1562; Phys. Lett. B433(1998)9; Phys. Rev. Lett. 85(2000)3999. Y. Ashie et al., Phys. Rev. Lett. 93(2004)101801.
- [59] MACRO Coll., P. Bernardini, hep-ex/9809003; F. Ronga, hep-ex/9810008.
-
[60]
K2K Coll., D. Kielorezka et al., Acta Phys. Polon. B35(2004)1453.
MINOS Coll., N. Tagg et al., hep-ex/0605058.
OPERA Coll., R. Acquafredda et al., J. Phys. 8(2006)303. hep-ex/0703247. - [61] V. Agrawal et al., Phys. Rev. D53(1996)1314.
- [62] M.Honda et al., Phys. Rev. D52(1995)4985.
- [63] M.Honda et al., Phys. Rev. D64(2001)053011; Phys. Rev. D70(2004)043008.
- [64] G. Battistoni et al., Astrop. Phys. 19(2003)269.
- [65] T.K.Gaisser et al., Nucl. Phys. B Proc. Suppl. 118(2003)109.
- [66] L3C Coll., P. Le Coultre et al., BESS Coll., T. Sanuki et al., Proc. of NOW2004, Otranto, 2004.
- [67] G.Giacomelli et al., hep-ex/0201032; hep-ex/0504002; Phys. Atomic Nuclei 67(2004)1139.
- [68] G. Battistoni et al., Phys. Lett. B615(2005)14; hep-ex/0503015; hep-ex/0508041.
- [69] M.C.Gonzalez et al., Phys. Rev. D70(2004)033010.
- [70] S. Cecchini et al., hep-ex/0606037; Astrop. Phys. 21(2001)35.
- [71] N. Fornengo, “New Trends in Neutrino Physics”, Ringberg Castle, 1998, World Scient.
- [72] P.A.M. Dirac, Proc. Roy. Soc. 133(1931)60.
- [73] G. ’t Hooft, Nucl. Phys. B29(1974)276.
-
[74]
G. Giacomelli et al., hep-ex/0005041; hep-ex/0506014; hep-ex/0702050.
G. Giacomelli, Rivista Nuovo Cimento 7 N12(1984)1. - [75] P. B. Price, Phys. Rev. D38(1988) 3813. D. Ghosh et al., Europhys. Lett. 12(1990)25.
- [76] K. A. Milton, Rept. Progr. Phys. 69(2006)1637.
- [77] J. Derkaoui et al., Astropart. Phys. 9(1998)173; Astropart. Phys. 10(1999)339.
- [78] E. Witten, Phys. Rev. D30(1984)272. A. de Rujula and S. Glashow, Nature 31(1984)271.
- [79] S. Coleman, Nucl. Phys. B262(1985)293. A. Kusenko et al., Phys. Lett. B418(1998)46.
- [80] M. Yu. Klopov et al., astro-ph/0603187.
- [81] D. Bakari et al., hep-ex/0004019.
- [82] M. Sioli, hep-ex/0209029; hep-ex/0201017.
- [83] Y. Becherini et al., Astropart. Phys. 23(2005)341, astro-ph/0502251.
- [84] J. Knapp and D. Heck, Extensive Air Shower Simulation with CORSIKA 5.61 (1998).
- [85] S. Cecchini et al., Radiat. Meas. 34(2001)55, hep-ex/0104022.
- [86] S. Nakamura et al., Phys. Lett. B263(1991)529.
- [87] S. Orito et al., Phys. Rev. Lett. 66(1991)1951.
- [88] P. Lipa et al., Phys. Lett. B285(1992)300.
- [89] P. Antonioli et al., Astrop. Phys. 7(1997)357.
- [90] EASTOP Collaboration, M. Aglietta et al., Nucl. Phys. B Proc. Suppl. 54(1997)263.