Spatial imaging of modifications to fluorescence lifetime and intensity by individual Ag nanoparticles
Abstract
Highly ordered periodic arrays of silver nanoparticles have been fabricated which exhibit surface plasmon resonances in the visible spectrum. We demonstrate the ability of these structures to alter the fluorescence properties of vicinal dye molecules by providing an additional radiative decay channel. Using fluorescence lifetime imaging microscopy (FLIM), we have created high resolution spatial maps of the molecular lifetime components; these show an order of magnitude increase in decay rate from a localized volume around the nanoparticles, resulting in a commensurate enhancement in the fluorescence emission intensity.
Fluorescence spectroscopy and lifetime measurements are powerful tools in the study of biological samples;festy07 however, these techniques suffer from limited sensitivity at low fluorophore concentrations typically employed. The presence of a metallic surface can dramatically alter the emission properties of a locally situated fluorophore, resulting in enhanced fluorescence emission and greater photostability by reducing the excited state lifetime.barnes1998 ; lakowicz2002 These plasmon-induced fluorescence modifications are currently being investigated for a wide variety of nanostructured systems, such as metal-island films,gheddes2007 lithographically patterned nanoparticle arrays,gerber07 and individual gold nanospheres.novotny2006 ; seelig07 The strong dependence of these effects on fluorophore-metal separation has been used to increase both lateral and longitudinal resolution in confocal microscopy, with important consequences for biological imaging.alschinger03
Here, we report the results of high spatial resolution time-resolved measurements on individual self-assembled Ag nanoparticles. Using fluorescence lifetime imaging microscopy (FLIM), we have observed localized enhancements in the emission intensity and additional fluorescence lifetime components from vicinal fluorophores. By correlating the initial emission intensity and lifetime resulting from these modified decay channels, we attribute these enhancements to a greater photon recycling rate due to coupling with surface plasmons.
Aqueous 500 nm diameter latex spheres were drop-cast onto a piranha treated glass slide, resulting in the formation of a monolayer / bilayer close-packed lattice as the water evaporated.vanduyne2001 A 0.5 nm layer of chromium was then deposited onto the slide by thermal evaporation in a vacuum chamber; this increases the adhesion of silver which was subsequently deposited to a thickness of 25 nm. The latex spheres were removed by sonication in chloroform, leaving a periodic array of Ag nanoparticles over a typical area of 20 mm2. Figure 1(a) shows an atomic force microscopy (AFM) image of a region of nanoparticles formed from a single layer of latex spheres; individual particles have a base length of 150 nm and height of 25 nm. In some regions, different structures form due to Ag deposition on double layers of spheres,vanduyne2001 as shown in Fig. 1(b).
Rhodamine 6G (R6G) dye was deposited onto the nanoparticles by vacuum sublimation to produce a uniform coverage of sub-monolayer thickness. The sample was prepared for high resolution optical measurements by applying a thin layer of index-matching polymer to a glass slide and affixing this on top of the nanoparticle array. During this procedure the R6G was incorporated into the polymer layer, creating a homogeneous distribution of fluorophores across the sample with a thickness of several microns.
Fluorescence lifetime and intensity images were obtained using a scanning confocal epifluorescence microscope (Leica TC SP2, 100x oil objective, 1.4 NA) with a synchronous time correlated single photon counting module (Becker and Hickl SPC-830). Excitation was with a 488 nm continuous-wave (CW) Ar+ laser (intensity) or 467 nm 20 MHz pulsed diode laser (lifetime), at a power far below fluorescence saturation in both cases.
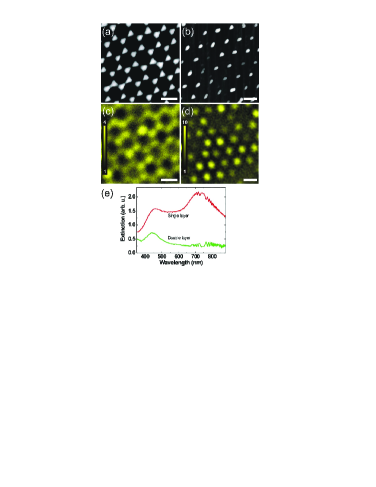
Figures 1(c) and (d) show CW fluorescence intensity maps of R6G on single and double layer nanoparticles, respectively. These maps show highly localized fluorescence enhancement from molecules close to nanoparticles. Spectral analysis has verified that the emission originates from R6G and is not caused by photoluminescence from the silver nanoparticles or scattered laser light. The R6G fluorescence enhancement measured from the nanoparticles, relative to that from the glass, is approximately fourfold and tenfold for (c) and (d), respectively. The actual enhancement in the vicinity of the nanoparticles will be much larger than that measured: enhancement is only expected to occur over a very small range of metal-fluorophore distances (20 nm),novotny2006 hence there is a significant unmodified fluorescence background from the other fluorophores in the excited confocal volume. This is discussed further below.
Extinction spectroscopy (Perkin-Elmer Lambda 800) was used to determine the local surface plasmon resonances (LSPR) of the Ag nanoparticles. Figure 1(e) shows ensemble extinction spectra from single and double layer regions. The single layer structures have two strong absorption resonances corresponding to dipole (720 nm) and quadrupole (460 nm) LSPR modes,schatz2003 ; nelayah2007 whereas the double layer structures have only one peak at 440 nm due to their ellipsoidal geometry.vanduyne2001
There are two main causes of fluorescence enhancement from molecules close to metal nanoparticles: when optically excited at its plasmon resonance, a nanoparticle can dramatically enhance the local electromagnetic field intensity, resulting in an increase in a molecule’s excitation rate.schatz2003 ; nelayah2007 The excited-state molecular dipole can also couple with surface plasmon electrons in the metal creating an additional radiative decay channel.barnes1998 ; lakowicz2005 ; gheddes2007
For CW measurements it is not possible to separate the contributions to the fluorescence enhancement arising from the modified excitation and decay channels; however, this is not the case with time-resolved measurements. The quantum efficiency gives the probability of an excited state molecule decaying to a lower state by photon emission. In free-space , where is the radiative emission rate, is the total lifetime of the molecule, and is the sum of the non-radiative decay rates. The presence of a metal creates an additional decay channel for an excited molecule, so the total radiative decay rate becomes . The modified fluorescence quantum yield and lifetime are then related by , and .
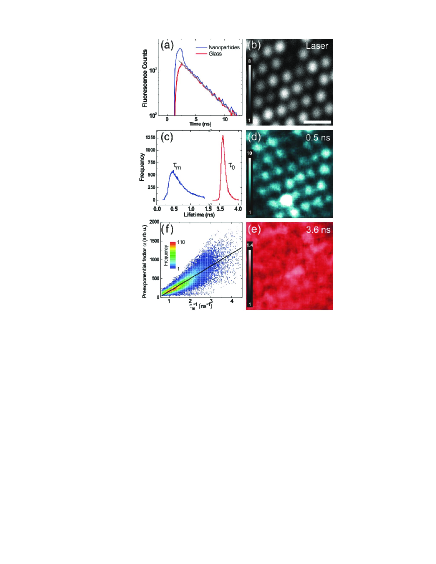
The effects of Ag nanoparticles on the R6G fluorescence lifetime were investigated for a region of double-layer structures. After excitation by a short laser pulse, the time evolution of the fluorescence intensity of a free-space single molecule is . Figure 2(a) shows spatially integrated raw decay transients from large areas of glass and nanoparticles. In both cases there is an identical long-lived component originating from unmodified fluorophores in the polymer layer; this has a monoexponential decay 3 ns and implies that there are no significant concentration-induced non-radiative channels.leitner85
Figure 2(b) shows the reflected laser intensity map for a scan area similar to that of Figs. 1(b) and (d). A FLIM map of this region was acquired for a 30 min integration period. Bins of pixels ( nm) were used to give decay transients with total preexponential counts of . Biexponential fits were then applied to give spatially resolved maps of constituent lifetimes and their corresponding intensities .note1 A histogram of the extracted lifetime components is shown in Fig. 2(c): this comprises a sharply peaked component from the unperturbed fluorophores, and a broader fast component arising from fluorophores with modified decay rates. Figures 2(d) and (e) show maps of the normalized preexponential intensities for the two modal lifetime components; the 0.5 ns component is localized (resolution limited) around the nanoparticles, whereas the 3.6 ns component has a uniform intensity (standard deviation ) consistent with the homogeneous coverage of fluorophores.
For this sample, the R6G (in polymer) layer thickness is comparable to the axial confocal excitation depth; hence, fluorophores at different distances from the nanoparticles will contribute differently to the total signal measured. Molecules in very close proximity to a metal show strong fluorescence quenching due to dominant non-radiative energy transfer.dulkeith02 We have taken measurements on samples without the additional polymer layer; these show almost complete quenching of the R6G fluorescence over the Ag nanoparticles, and an instrumental-response limited lifetime. This strong distance-dependent weighting means that, for the current sample, the enhanced fluorescence with a lifetime is from a thin shell of molecules around the nanoparticles where the competing quenching and enhancement mechanisms result in a maximum net emission intensity.huang ; novotny2006
An aqueous R6G molecule has ; hence, we assume that fluorophores showing a maximally enhanced emission intensity have , so . The preexponential factor depends on several fixed experimental parameters and also directly depends on the radiative decay rate .gerber07 Thus, we expect a direct correlation between and the measured decay rate. Figure 2(f) shows a pixel-by-pixel correlation between the spatial maps of the lifetime and their associated values, extracted from biexponential fits over a region of nanoparticles as described above. The data have been binned and the resulting frequency at each point is shown by the color bar. Scatter plots of versus and were created from all biexponential fits; these show no fitting related bias. The data in Fig. 2(f) are well fit by a linear regression, in agreement with the above discussion. A large number of fluorophores show an order of magnitude increase in decay rate relative to the unmodified background ( ns-1), with a commensurate enhancement in initial intensity, as shown in Fig. 2(d). In CW measurements, the nanoparticle-induced enhancement in integrated intensity cannot be accounted for by an increase in . Instead it originates primarily from a greatly increased photon recycling rate for fluorophores with a strong radiative coupling to surface plasmons.
In conclusion, we have demonstrated highly localized modification of fluorescence intensity and lifetime on ordered arrays of Ag nanoparticles. FLIM maps of R6G fluorescence show an additional plasmon-induced radiative decay channel for a thin shell of molecules around individual nanoparticles. This results in an order of magnitude increase in ensemble photon recycling rate with a proportionate enhancement in fluorescence intensity. The strong distance dependence of these effects suggests that metal enhanced fluorescence may offer a means of selectively mapping the location of specific target molecules within a larger excitation volume, such as fluorophore-tagged proteins in cell membranes.
The authors would like to thank F. Festy and K. Suhling for helpful discussions. This work was supported by the EPSRC (UK).
References
- (1) F. Festy, S. M. Ameer-Beg, T. Ng, and K. Suhling, Mol. Biosyst. 3, 381 (2007).
- (2) J. R. Lakowicz, Y. Shen, S. D’Auria, J. Malicka, J. Fang, Z. Gryczynski, and I. Gryczynski, Anal. Biochem. 301, 261 (2002).
- (3) W. L. Barnes, J. Mod. Opt. 45, 661 (1998).
- (4) Y.Z. Zhang, K. Aslan, M. J. R. Previte, and C. D. Geddes, Appl. Phys. Lett. 90, 053107 (2007).
- (5) S. Gerber, F. Reil, U. Hohenester, T. Schlagenhaufen, J. R. Krenn, and A. Leitner, Phys. Rev. B. 75, 073404 (2007).
- (6) P. Anger, P. Bharadwaj, and L. Novotny, Phys. Rev. Lett. 96, 113002 (2006).
- (7) J. Seelig, K. Leslie, A. Renn, S. Kühn, V. Jacobsen, M. van de Corput, C. Wyman, and V. Sandoghdar, Nano Lett. 7, 685 (2007).
- (8) M. Alschinger, M. Maniak, F. Stietz, T. Vartanyan, and F. Träger, Appl. Phys. B 76, 771 (2003).
- (9) C. L. Haynes and R. P. Van Duyne, J. Phys. Chem. 105, 5599 (2001).
- (10) K. L. Kelly, E. Coronado, L. L. Zhao, and G. C. Schatz, J. Phys. Chem. B. 107, 668 (2003).
- (11) J. Nelayah, M. Kociak, O. Stéphan, F. J. García de Abajo, M. Tencé, L. Henrard, D. Taverna, I. Pastoriza-Santos, L. M. Liz-Marzán, and C. Colliex, Nat. Phys. 3, 348 (2007).
- (12) J. R. Lakowicz, Anal. Biochem. 337, 171 (2005).
- (13) A. Leitner, M. E. Lippitsch, S. Draxler, M. Riegler, and F. R. Aussenegg, Appl. Phys. B. 36, 105 (1985).
- (14) An instrumental response of 60 ps has been included in all lifetime analyis.
- (15) E. Dulkeith, A. C. Morteani, T. Niedereichholz, T. A. Klar, J. Feldmann, S. A. Levi, F. C. J. M. van Veggel, D. N. Reinhoudt, M. Möller, and D. I. Gittins, Phys. Rev. Lett. 89, 203002 (2002).
- (16) F. M. Huang and D. Richards, J. Opt. A. 8, S234 (2006).