CLEO Collaboration
Measurement of prominent decay branching fractions
Abstract
The decay is used to measure, for the first time, all prominent -meson branching fractions with the same experiment in the same dataset, thereby providing a consistent treatment of systematics across branching fractions. We present results for decays to , , , , and , accounting for of all decays. The precisions for several of the branching fractions and their ratios are improved. Two channels, and , show results that differ at the level of three standard deviations from those previously determined.
pacs:
13.25.-kThe meson was discovered almost half a century ago Pevsner:1961pa . It is the second-lightest meson, considered to consist of , , and quarks, and studying its decays into pions, electrons, and photons gives insight into different aspects of non-perturbative QCD and electromagnetic phenomena. Measurements of the decay properties come from many different experiments, and almost all exclusive branching fraction determinations are made relative to other decays. The Particle Data Group (PDG) Yao:2006px uses 43 such measurements in a fit to determine the branching fractions to , , , , , , , and , as well as the total width.
The analysis presented here studies decays in the reaction with , , , and . We identify the through its decays to and . The choice of modes addresses the known branching fractions of and larger, and covers 99.88% of the decay modes when using the branching fractions from Ref. Yao:2006px . The strength of this analysis lies in the simultaneous and similar treatment of charged and neutral decay products, cross-feed of different modes into each other, and, with the same analysis procedure, estimates of backgrounds from other sources.
The CLEO-c detector is described in detail elsewhere CESRCLEO . Its features exploited here are the 93% solid angle coverage of precision charged particle tracking and an electromagnetic calorimeter consisting of 7784 CsI(Tl) crystals, the barrel portion of which has a vertex-pointing geometry. The barrel calorimeter and two open-cell drift chambers are concentric with the colliding beams and embedded inside a 1 T axial magnetic field provided by a superconducting solenoid. The small inner chamber has six cylindrical stereo layers (drift cells canted at an angle to the chamber axis), and the outer, larger chamber has 47 layers, the inner 16 of which are axial and the outer 31 stereo. (About 5% of the data used here were acquired in the earlier CLEO III detector configuration, which differed from CLEO-c primarily by having a four-layer silicon strip vertex detector in place of the inner tracking chamber.) The tracking system enables momentum measurements for particles with momentum transverse to the beam exceeding 50 MeV/, and achieves resolution 0.6% at =1 GeV/. The barrel calorimeter reliably measures photon shower energies down to =30 MeV and has a resolution of 5% at 100 MeV and 2.2% at 1 GeV.
The data sample comprises about 27M decays, corresponding to about 0.1M decays produced with a tag.
We determine the detection efficiency and background levels with Monte Carlo (MC) samples that were generated using the EvtGen event generator evtgen and a GEANT-based geant detector simulation. We model and according to phase space. The mode is simulated as mediated by a decay, weighted with a factor , where is the photon energy in the center-of-mass system. We generate according to the distribution measured in threepi . The simulation of is analogous to (“Dalitz decay”) faessler .
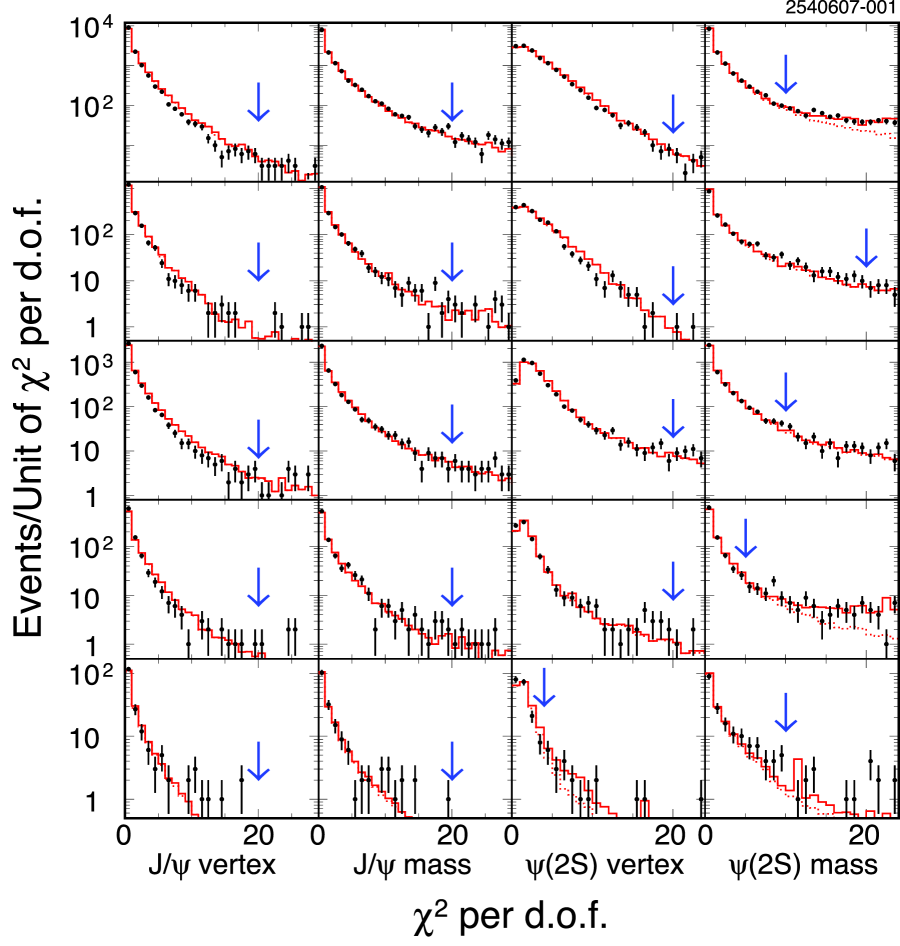
The event selection proceeds as follows. We select the track candidates within polar angles , adding bremsstrahlung photons within a cone of around the track momentum vector at the collision point. We identify leptons through the ratio of energy deposition in the calorimeter associated with the track, , to the track momentum measured in the drift chamber, : For electron (muon) candidates, we require values of () for one lepton and () for the other. We impose kinematic constraints by fitting the two lepton candidates to a common originating vertex (where the figure of merit is given by ) and to the mass (). We keep candidates that have and , which keeps signal decays with high efficiency, as evident from Fig. 1. The photons in the decay products are required to be in the region of best calorimeter performance and least material in front of the crystals, , and not be matched or close to a track’s projection into the calorimeter.
We then proceed to use kinematic constraints once more for improved event cleanliness: The fitted and the decay products are constrained, together with the beam spot beamspot , to a common vertex, and then to the mass. This results in a very clean separation of final states. We apply mode-dependent restrictions on the quality of these fits, denoted by and , respectively. Conversion events originating from decay can fulfil the pre-selection, but have a poor vertex fit; hence we apply a stricter cut of in this channel (see Fig. 1). All other modes require . The mass fit has mode-dependent cuts, set as loosely as possible while preserving sample cleanliness: for , for , , and , for .
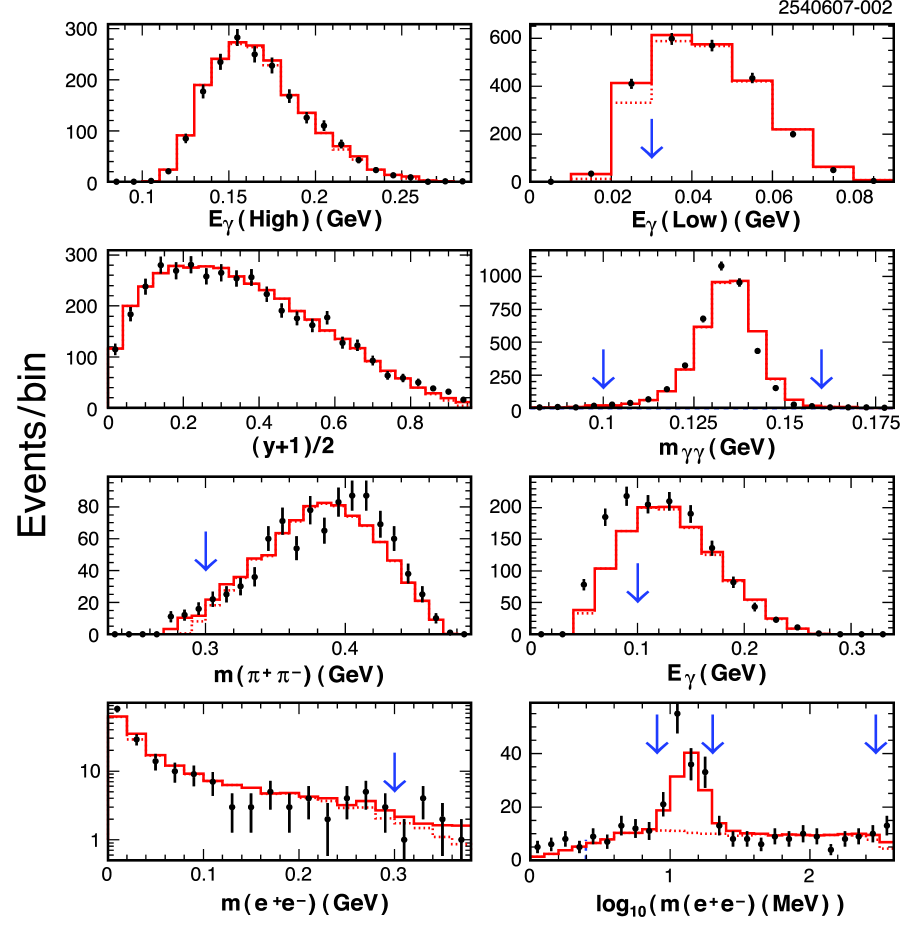
After this step, we define the following signal windows: , and two ranges for : for , for all others. Final state specific characteristics are: (1) : , to suppress photons from . (2) : We search for two photons with and , and constrain them to the mass. (3) : We search for six photons, but do not attempt to make assignments to candidates because doing so typically results in multiple comparably probable assignments. (4) : and . (5) : We add bremsstrahlung photons to the soft electrons as with , and the soft tracks must satisfy . In addition, we require . A substantial number of events with a conversion survive the vertex restriction described above and fake the signature; indeed, this type of background has necessitated substantial subtractions in previous measurements of this mode eeg_cmd2 ; eeg_snd . These conversions tend to occur at the discrete locations such as the beam pipe and tracking chamber boundaries, but are reconstructed as if they originated at the interaction point. Consequently they create an artificial mass peak near 10 MeV as seen in the lower right of Fig. 2. We remove the mass region to suppress this background and the systematic uncertainties associated with it.
For all five decay channels, we keep the two decay modes separate. The fit quality for data and simulation is compared in Fig. 1. As a cross-check, we also perform the analysis without the kinematic fit: consistent results are obtained, but in most modes with far worse background conditions and larger uncertainties.
The main backgrounds arise from cross-feed between the modes and from other transitions, mostly , , and through . We select such exclusive event samples using selections similar to the signal decays, including the kinematic fits. Backgrounds from these channels into the signals are then determined by scaling the MC predictions so as to match the observed yields in data, and subtracted. The statistical uncertainties of these subtractions are accounted for. We find that , , , and have such backgrounds at the levels of 1-2%. Examination of the mass sidebands revealed no discrepancy between data yields and MC estimate; the only exception is , where data exceeds MC by an amount which, when extrapolated into the signal region, corresponds to a background of and is subtracted in addition to the other Monte Carlo predictions. The mode has a background of about due mostly to conversions which survived the and tight vertex fit restrictions. Other (non-) decays do not fake the signal signature at any appreciable level. We use a sample of data taken at a center-of-mass energy of to estimate continuum background (scaled by luminosity and energy dependence), which is found to be negligible.
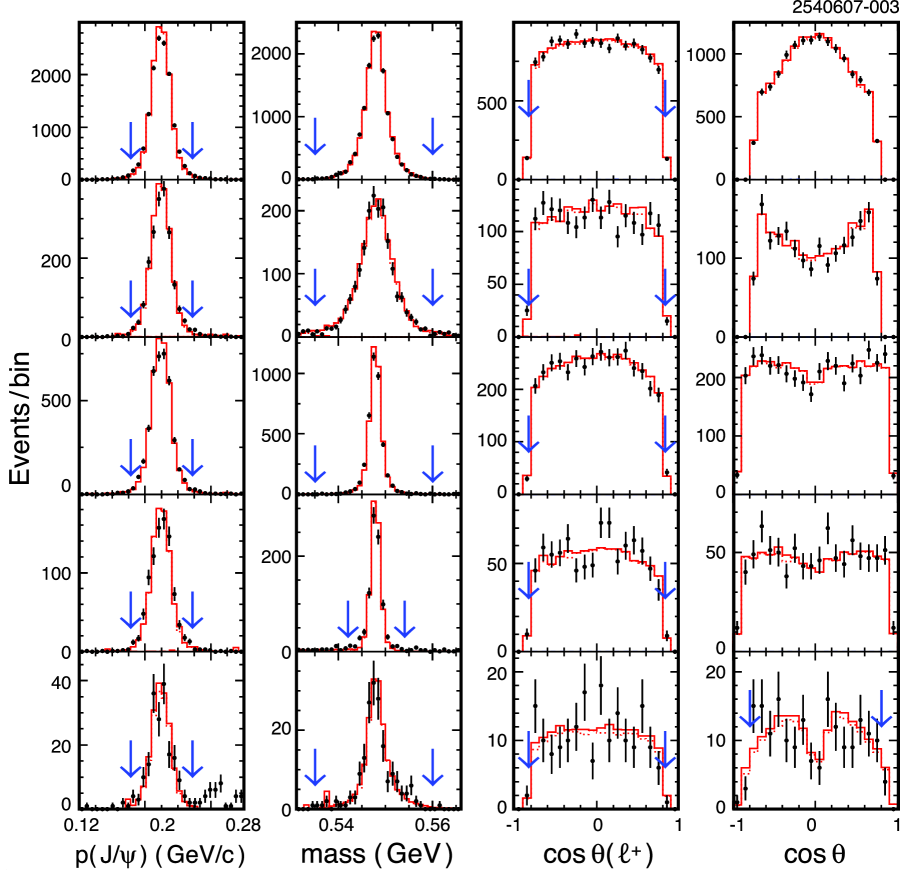
All inspected experimental observables show good agreement between data and the sum of our MC samples, normalized according to their relative population in the data. A selection of comparisons is shown in Figs. 2 and 3.
Table 1 lists observed yields and the estimated background. We observe significant, clean, and unambiguous signals for all our target modes.
Our measurements are performed as ratios between efficiency-corrected event yields of pairs of final states, separately for and . This allows cancellation of all lepton-related systematic uncertainties, such as track finding, lepton identification, and fitting. We then proceed to combine the two measurements of each ratio, where the -related uncertainties are treated as fully correlated. We note that the absolute detection efficiency for , , is about one third.
Sources of systematic uncertainty and the values assigned are: Track finding ( per track, added linearly xjpsi ), photon finding ( per photon, added linearly xjpsi ), sideband subtraction (, only), trigger (-, mode-dependent), and MC statistics (-, mode-dependent), other effects in the detector simulation (). We also make reasonable variations in decay modeling at the MC generator level and assign uncertainties accordingly: for to account for the slight deviation from phase-space-prescribed decay observed in Ref. threepizero , for based on the experimental uncertainty of the slope parameter in Ref. threepi , for to include a slightly different lineshape parameterization of the intermediate meson, and for to allow for changes in the polar angle distribution of the from the decay and in the spectrum that remain consistent with our measurements. All uncertainties are added in quadrature, except where correlations between modes have to be observed.
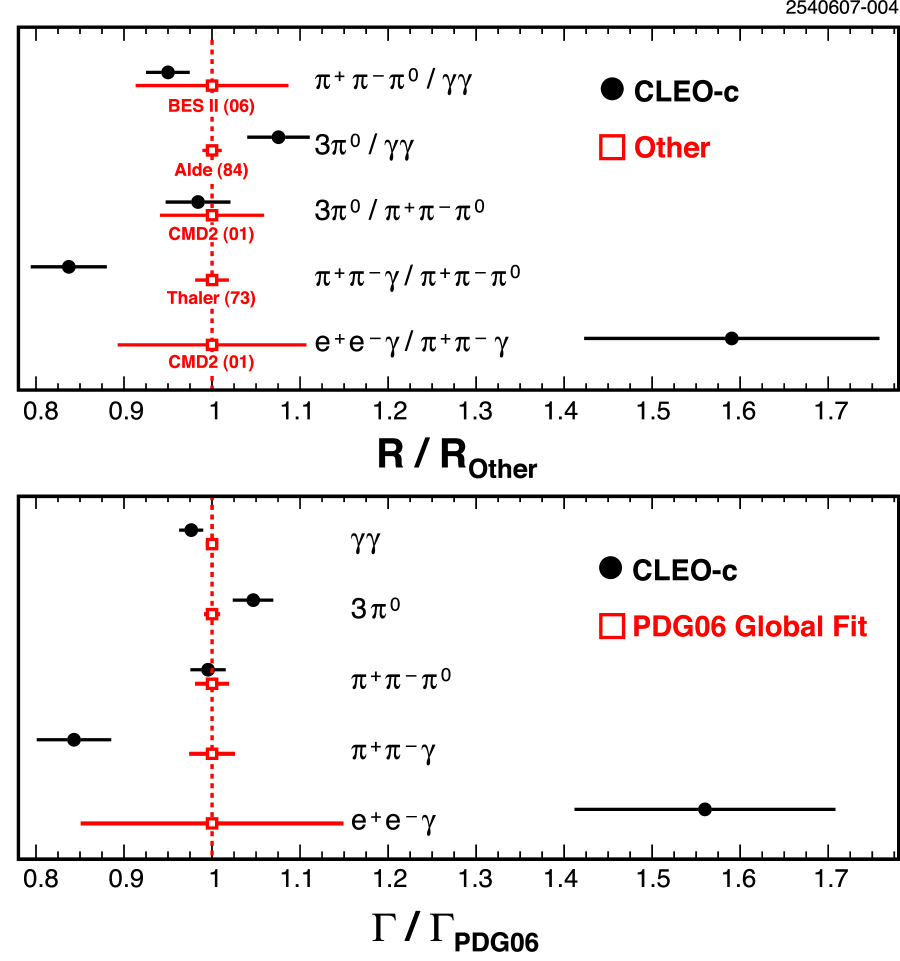
The results for ratios of branching fractions are shown in Table 2. The for the ratios relative to to agree between and is 5.9 for four degrees of freedom, corresponding to a confidence level of . We designate the following four ratios as constituting a complete set, having minimal systematic correlation with each other: , , , and . We compare to the single most precise other measurements in Fig. 4.
Under the assumption that our five signal modes account for all of the decay modes, we combine the ratios between them to form absolute branching fraction measurements. Correlations between uncertainties are taken into account. Other possible decay modes are either forbidden and/or have been found to be below 0.2% in branching fraction Yao:2006px : We include as a systematic uncertainty in the absolute branching fraction results. The results are presented in Table 3, together with those from PDG 2006 Yao:2006px for the global fit to all measurements. In all five modes, the statistical uncertainty is larger than or comparable to the systematic error. A visual comparison can be found in Fig. 4.
To summarize, we have studied five decay modes using the decay chain , and : , , , , and . We have presented ratios between these modes as well as absolute branching fractions to these final states. This is the first analysis that covers this range of decay modes, summing up to of the known decays, and determines their absolute branching fractions in the same experiment. Several of the relative and derived absolute branching fractions obtained in this analysis are either the most precise to date or first measurements. In particular, we note that our result for is about () smaller than previous measurements, and for is () larger.
We gratefully acknowledge the effort of the CESR staff in providing us with excellent luminosity and running conditions. D. Cronin-Hennessy and A. Ryd thank the A.P. Sloan Foundation. This work was supported by the National Science Foundation, the U.S. Department of Energy, and the Natural Sciences and Engineering Research Council of Canada.
References
- (1) A. Pevsner et al., Phys. Rev. Lett. 7, 421 (1961).
- (2) W. M. Yao et al. [Particle Data Group], J. Phys. G 33, 1 (2006).
- (3) R.A. Briere et al. (CESR-c and CLEO-c Taskforces, CLEO-c Collaboration), Cornell University, LEPP Report No. CLNS 01/1742 (2001) (unpublished); G. Viehhauser, Nucl. Instrum. Methods A 462, 146 (2001); M. Artuso et al., Nucl. Instrum. Meth. Phys. Res., Sect A 554, 147 (2005); D. Peterson et al., Nucl. Instrum. Methods Phys. Res., Sect. A 478, 142 (2002).
- (4) R. R. Akhmetshin et al. [CMD-2 Collaboration], Phys. Lett. B 501, 191 (2001).
- (5) M. N. Achasov, V. M. Aulchenko, K. I. Beloborodov and A. V. Berdyugin, Phys. Lett. B 504, 275 (2001).
- (6) D.J. Lange, Nucl. Instrum. Methods Phys. Res., Sect. A 462, 152 (2001).
- (7) R. Brun et al., Geant 3.21, CERN Program Library Long Writeup W5013 (1993), unpublished.
- (8) J.G. Layter et al., Phys. Rev. D 7, 2565 (1973).
- (9) A. Faessler, C. Fuchs, and M.I. Krivoruchenko, Phys. Rev. C 61, 035206 (2000).
- (10) The beam spot is the center of the ellipsoidal collision region, and is determined from finding a common vertex position in hadronic events that occur in contiguous 30-60 minute periods of stable beam conditions.
- (11) N. E. Adam et al. (CLEO Collaboration), Phys. Rev. Lett. 94, 232002 (2005).
- (12) W. B. Tippens et al. (Crystal Ball Collaboration), Phys. Rev. Lett. 87, 192001 (2001).
- (13) Although PDG06 Yao:2006px lists two absolute measurements eeg_cmd2 ; eeg_snd for , both rely on previously measured exclusive branching fractions and therefore are inherently relative, not absolute, measurements.
- (14) M. Ablikim et al. (BES Collaboration), Phys. Rev. D 73, 052008 (2006); D. Alde et al., Z. Phys. C25, 225 (1984); Yad. Fiz. 40 1447 (1984); R.R. Akhmetshin et al. (CMD-2 Collaboration), Phys. Lett. B509, 217 (2001); J.J. Thaler et al., Phys. Rev. D 7, 2569 (1973).
| Channel | ||||||
|---|---|---|---|---|---|---|
| 6324 | 0 | 66 | 7376 | 0 | 114 | |
| 850 | 0 | 18 | 1004 | 0 | 15 | |
| 1884 | 4 | 12 | 2052 | 5 | 0 | |
| 403 | 3 | 17 | 498 | 2 | 20 | |
| 82 | 4 | 0 | 100 | 6 | 0 | |
| Channel | eff. ratio | branching fraction ratio | ||||
|---|---|---|---|---|---|---|
| 0.884 | 0.022 | 0.019 | ||||
| 0.587 | 0.011 | 0.009† | ||||
| 0.103 | 0.004 | 0.004† | ||||
| 0.024 | 0.002 | 0.001† | ||||
| 1.496 | 0.043 | 0.035† | ||||
| 0.175 | 0.007 | 0.006 | ||||
| 0.041 | 0.003 | 0.002† | ||||
| 0.237 | 0.021 | 0.015 | ||||
| Channel | this work (%) | PDG Yao:2006px (%) | |||
|---|---|---|---|---|---|
| 39.38 | 0.26 | ||||
| 32.51 | 0.28 | ||||
| 22.7 | 0.4 | ||||
| 4.69 | 0.11 | ||||
| 0.60 | 0.08 | ||||