Polarized Parton Densities and Higher Twist in the Light of the Recent CLAS and COMPASS data
Abstract
The impact of the recent very precise CLAS and COMPASS data on polarized parton densities and higher twist effects is discussed. We demonstrate that the low CLAS data improve essentially our knowledge of higher twist corrections to the spin structure function , while the large COMPASS data influence mainly the strange quark and gluon polarizations which slightly decrease. We find also that the present inclusive DIS data cannot rule out a negative polarized and changing in sign gluon densities.
1 Introduction
One of the features of polarized DIS is that a lot of the present data are in the preasymptotic region (). This is especially the case for the experiments performed at the Jefferson Laboratory. As was shown in [2], to confront correctly the QCD predictions to the experimental data including the preasymptotic region, the non-perturbative higher twist (powers in ) corrections to the nucleon spin structure functions have to be taken into account too.
In this talk we discuss the impact of the recent very precise CLAS [3] and COMPASS [4] inclusive polarized DIS data on the determination of both the longitudinal polarized parton densities (PDFs) in the nucleon and the higher twist (HT) effects. These experiments give important information about the nucleon structure in quite different kinematic regions. While the CLAS data entirely belong to the preasymptotic region and as one can expect they should mainly influence the higher twist effects, the COMPASS data on the spin asymmetry are large data and they should affect mainly the polarized parton densities. In addition, due to COMPASS measurements we have for the first time accurate data at small , where the behaviour of the spin structure function should be more sensitive to the sign of the gluon polarization.
2 Results of analysis
The method used to extract simultaneously the polarized parton densities and higher twist corrections to is described in [2]. According to this method, the and data have been fitted using the experimental data for the unpolarized structure function
| (1) |
As usual, is replaced by its expression in terms of the usually extracted from unpolarized DIS experiments and and the phenomenological parametrizations of the experimental data for [5] and the ratio of the longitudinal to transverse cross-sections [6] are used. Note that such a procedure is equivalent to a fit to , but it is more precise than the fit to the data themselves actually presented by the experimental groups because here the data are extracted in the same way for all of the data sets. In Eq. (1) ”LT” denotes the leading twist contribution to (logarithmic in NLO pQCD expression where the target mass corrections are taken into account), while corresponds to the first term in the expansion of higher twist effects.
Let us discuss now how inclusion of the CLAS EG1 proton and deuteron data [3] and the new COMPASS data on [4] influence our previous results [7] on polarized PDFs and higher twist obtained from the NLO QCD fit to the world data (see the references in [7]), before the CLAS and the latest COMPASS data were available.
2.1 Impact of CLAS data
As the CLAS data are mainly low data where the role of HT becomes important, they should help to fix better the higher twist effects. Indeed, due to the CLAS data, the determination of HT corrections to the proton and neutron spin structure functions, and , is significantly improved in the CLAS region, compared to the values of HT obtained from our LSS’05 analysis [7] in which a NLO() QCD approximation for was used. This effect is illustrated in Fig. 1. One can conclude now that
the HT corrections for the proton target are definitely different from zero and negative in the region: 0.1-0.4. Also, including the CLAS data in the analysis, the HT corrections for the neutron target are better determined in the region: 0.2-0.4. Note that at was already fixed very precisely from the JLab Hall A data on the ratio . As expected, the central values of the polarized PDFs are practically not affected by the CLAS data. This is a consequence of the fact that at low the deviation from logarithmic in pQCD behaviour of is accounted for by the higher twist term in . However, the accuracy of the determination of polarized PD is essentially improved. This improvement (see [1, 8]) is a consequence of the much better determination of higher twist contributions to the spin structure function , as discussed above. Because of the good accuracy of the CLAS data, one can split the measured region of the world+CLAS data set into 7 bins instead of 5, as used up to now, and therefore, can determine more precisely the -dependence of the HT corrections to . As seen in Fig. 1, the more detailed -space behaviour of the HT contribution, obtained when using 7 -bins, suggests a smoother function dependence in and will help us to calculate more precisely their first moments in the experimental region and to compare them with the predictions given by different theoretical models.
The main message from this analysis is: It is impossible to describe the very precise CLAS data if the HT corrections are NOT taken into account. Note that if the low data are not too accurate, it would be possible to describe them using only the leading twist term (logarithmic in ) in , i.e. to mimic the power in dependence of with a logarithmic one (using different forms for the input PDFs and/or more free parameters associated with them) which was done in the analyses of another groups before the CLAS data have appeared.
2.2 Impact of new COMPASS data
In contrast to the CLAS data, the COMPASS data are mainly at large and the only precise data at small . The new data are based on 2.5 times larger statistics than those of COMPASS’05 and give more precise and detailed information about at small (see Fig. 2a).
The QCD theoretical curves for corresponding to the best fits with positive and negative lie above the old one at . As a result, the COMPASS’06 data do not influence and parton densities, while the magnitudes of both the polarized gluon and strange quark sea densities and their first moments slightly decrease (see Refs. [1, 8]). As a consequence, increases from (0.165 0.044) to (0.207 0.040) for and (0.243 0.065) for .
As expected, the values of HT are practically not affected by COMPASS data excepting the small where are also small. We have found that the HT effects at small are large, up to 40% of the magnitude of (see Fig. 2b) and therefore, in the presence of HT, , as well as (Fig. 1a), are not too sensitive to the sign of the gluon polarization at small . These results are in contrast to those obtained in the COMPASS analysis [4] where the higher twist corrections are not taken into account (for details see [1, 8]).
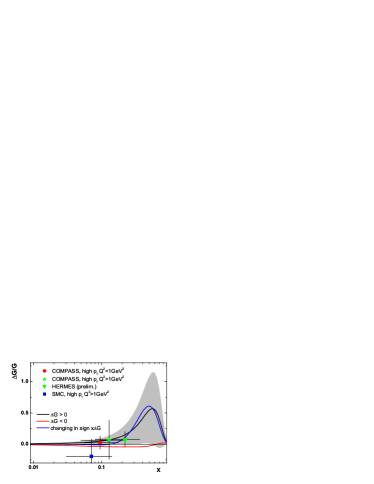
We have observed that the present inclusive DIS data cannot rule out the solutions with negative and changing in sign gluon polarizations. The shape of the negative gluon density differs from that of positive one. In all the cases the magnitude of is small: and the corresponding polarized quark densities are very close to each other. In Fig. 3 the ratio calculated for the different obtained in our analysis and using for the unpolarized gluon density, is compared to the existing direct measurements of . The most precise value for , the COMPASS one, is well consistent with any of the polarized gluon densities determined in our analysis.
In conclusion, it was demonstrated that the inclusion of the low CLAS data in the NLO QCD analysis of the world DIS data improves essentially our knowledge of HT corrections to and does not affect the central values of PDFs, while the large COMPASS data influence mainly the strange quark and gluon polarizations, but practically do not change the HT corrections. These results strongly support the QCD framework, in which the leading twist pQCD contribution is supplemented by higher twist terms of .
References
-
[1]
Slides:
http://indico.cern.ch/contributionDisplay.py?contribId=136&sessionId=4&confId=9499 - [2] E. Leader, A.V. Sidorov and D.B. Stamenov, Phys. Rev. D67 074017 (2003).
- [3] K.V. Dharmwardane et al. (CLAS Collaboration), Phys. Lett. B641 11 (2006).
- [4] V.Yu. Alexakhin et al. (COMPASS Collaboration), Phys. Lett. B647 8 (2007).
- [5] M. Arneodo et al. (NMC Collaboration), Phys. Lett. B364 107 (1995).
- [6] K. Abe et al. (SLAC E143 Collaboration), Phys. Lett. B452 194 (1999).
- [7] E. Leader, A.V. Sidorov and D.B. Stamenov, Phys. Rev. D73 034023 (2006).
- [8] E. Leader, A.V. Sidorov and D.B. Stamenov, Phys. Rev. D75 074027 (2007).