Spitzer IRAC observations of newly-discovered planetary nebulae from the Macquarie-AAO-Strasbourg H Planetary Nebula Project
Abstract
We compare H, radio continuum, and Spitzer Space Telescope (SST) images of 58 planetary nebulae (PNe) recently discovered by the Macquarie-AAO-Strasbourg H PN Project (MASH) of the SuperCOSMOS H Survey. Using InfraRed Array Camera (IRAC) data we define the IR colors of PNe and demonstrate good isolation between these colors and those of many other types of astronomical object. The only substantive contamination of PNe in the color-color plane we illustrate is due to YSOs. However, this ambiguity is readily resolved by the unique optical characteristics of PNe and their environs. We also examine the relationships between optical and MIR morphologies from 3.6 to 8.0 m, and explore the ratio of mid-infrared (MIR) to radio nebular fluxes, which is a valuable discriminant between thermal and nonthermal emission. MASH emphasizes late evolutionary stages of PNe compared with previous catalogs, enabling study of the changes in MIR and radio flux that attend the aging process. Spatially integrated MIR energy distributions were constructed for all MASH PNe observed by the GLIMPSE Legacy Project, using the H morphologies to establish the dimensions for the calculations of the Midcourse Space Experiment (MSX), IRAC, and radio continuum (from the Molonglo Observatory Synthesis Telescope and the Very Large Array) flux densities. The ratio of IRAC 8.0-m to MSX 8.3-m flux densities provides a measure of the absolute diffuse calibration of IRAC at 8.0 m. We independently confirm the aperture correction factor to be applied to IRAC at 8.0 m to align it with the diffuse calibration of MSX. The result is in accord with the recommendations of the Spitzer Science Center, and with our results from a parallel study of Hii regions in the MIR and radio. However, these PNe probe the diffuse calibration of IRAC on a spatial scale of 9, as opposed to the many arcmin scale from the study of Hii regions.
1 Introduction
The recent availability of the SuperCOSMOS AAO/UKST H survey of the Southern Galactic Plane; SHS (Parker et al. 2005) has led to a substantial 60% increase in the numbers of Galactic planetary nebulae (PNe) identified. This is largely due to the excellent combination of resolution ( arcsecond), sensitivity ( Rayleigh) and areal coverage (4000 sq.degrees) offered by this powerful online survey111http://www-wfau.roe.ac.uk/sss/halpha/. These 905 new PNe have recently been published as the Macquarie/AAO/Strasbourg H PN project (MASH) by Parker et al. (2006). In this paper we describe a multiwavelength examination of a subset of these objects for which Spitzer Space Telescope (Werner et al. 2004: hereafter SST) observations are available between 3.6 and 8.0 m from the GLIMPSE survey of portions of the Galactic Plane (Benjamin et al. 2003; Churchwell et al. 2004). We compare multiwavelength images of PNe in H, the 8.3-m band of the Midcourse Space Experiment (MSX: Price et al. 2001), the four InfraRed Array Camera (IRAC: Fazio et al. 2004) bands, and radio continuum from either the Molonglo Galactic Plane Survey in the south (MGPS2: Green 2002) or the NVSS in the north (Condon et al. 1998).
MASH PNe lie within Galactic latitudes of . MSX imaged the entire Galactic Plane within 5∘ while GLIMPSE is confined to 1∘. For the present multiwavelength study of PNe we investigated both regions of the GLIMPSE survey, covering the longitudes from 10∘ to 65∘ and 295∘ to 350∘. As part of the final culling of MASH candidates prior to publication, various multiwavelength comparisons were made between MASH PN candidates and other extant data from MSX, 2MASS and, for the area of overlap, GLIMPSE. There were 85 PNe candidates in the MASH/GLIMPSE overlap zone to begin with. Mid-infrared (MIR) data are valuable to study the properties of these objects as well as to remove misidentifications from the MASH (Cohen & Parker 2003). Parker et al. (2006) discuss in detail how non-PN contaminants were eliminated from the MASH catalog. An environment with the indicators of active star-formation or heavy dust obscuration, or an optical morphology showing multiple patches of nebulosity, possibly linked, suffice to remove many Hii regions. Any object that lacks H emission will appear the same in the narrowband H and accompanying broadband red continuum exposures, precluding reflection nebulae and normal galaxies. Compact Hii regions were eliminated by optical spectroscopy based on the weakness of [Nii](6548+6584) relative to H emission (hereafter [Nii]/H). Additional emission-line objects that are not PNe were rejected by optical spectroscopy if they lacked the characteristic PN lines (e.g. [Oiii] in the blue; [Oi], [Nii], and [Sii] in the red) or showed a continuum. MIR morphology is often sufficient to discriminate between PNe and Hii regions.
MASH PNe are generally distinguishable from previously known nebulae by their larger size and faintness. This distinction translates to large proportions of highly evolved objects of large apparent size and low surface brightness that have almost dissolved into the interstellar medium (ISM), and of compact faint PNe. This complementarity between the MASH and old PN catalogs is important because only a small fraction of the estimated 30,000 Galactic PNe (e.g. Frew & Parker 2005) is known. To understand PNe it is vital to identify more of this population and to have access to a broad representation of different evolutionary stages. This helps to gauge the relationship between morphology and age and to quantify the gradual chemical enrichment of the Galaxy.
Careful consideration of MASH optical spectra, and of MSX and Spitzer imagery of MASH PN candidates resulted in the rejection of a total of 27 candidates: 4 objects were found to correspond to portions of known supernova remnants; 4 are inconclusive identifications following consideration of the available optical and IR data; one is a symbiotic star; 2 are “likely” PNe; and the remaining 16 are probably Hii regions and were anyway never classified as more than “possible” PNe. Fifty-eight nebulae survived this cull, composed of 28 true, 16 likely, and 14 possible PNe (from the classification categories of Parker et al. 2006). Objects inconclusive in nature have been placed in the MASH Miscellaneous Emission Nebulae (MEN) catalog until their true character can be revealed. Some of these may later turn out to be PNe and will return to MASH.
In this paper we present the sample of PNe and summarize their multiwavelength characteristics (§2); describe the tools we use to confirm true MIR counterparts of the 58 objects (§3); compare the ratio of IRAC 8.0-m to MSX 8.3-m fluxes to investigate further the accuracy of IRAC’s absolute diffuse calibration on smaller spatial scales than probed by Cohen et al. (2006) in their study of Hii regions (§4); compare the IRAC colors of the MASH PNe with those found by Hora et al. (2004) to provide a diagnostic color-color plot which distinguishes PNe from other sources in the GLIMPSE data (§5); examine the ratio of spatially-integrated MIR/radio flux density for PNe (§6); and compare MIR and optical morphologies of PNe (§7). §8 gives our conclusions.
2 The sample of PNe
2.1 Removing non-PNe from the MASH
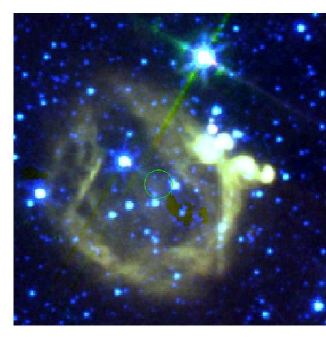
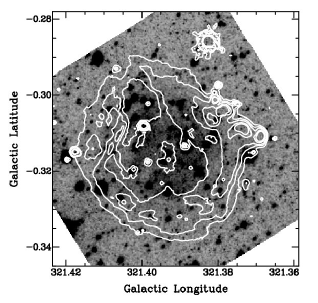
Fig. 1 compares the H appearance with the IRAC morphology of a PN candidate that has now been reclassified as an Hii region. It was initially considered a PN candidate because of its plausible optical morphology and its reasonable optical red spectrum (Fig. 2, with [Nii]/H) of 0.60, close to the cut-off value for Hii regions, of 0.70 (Kennicutt et al. 2000). High extinction precluded blue spectroscopy that might have revealed the absence of PN lines. However, the relative locations of H and 8-m emission (see Fig. 1), and what appear to be possible secondary star formation regions (several compact Hii regions on the north-western rim) are much more consistent with an Hii region.
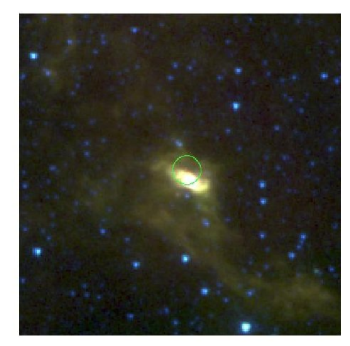
Further examples of more subtle contaminants in the MASH are found among highly collimated bipolar nebulae that contain dusty equatorial disks producing thermal emission from warm dust with temperatures typically in the range 250-400 K. One such interesting object is PHR12536350, previously identified as a possible highly collimated bipolar PN with a bright central star (CS). Fig. 3 presents both MIR and H morphologies. (The MIR image is a 3-band false color image as described in §3.2.) The nebular spectrum (Fig. 4) is PN-like with [Oiii]/H10, [Nii]/H0.1, but with an obvious blue, and a weaker red, continuum. The CS is not blue but is bright in the near-infrared (NIR) with 2MASS photometry yielding 1.43 and 1.41. Combining these with a magnitude at 3.6 m of 7.35, and [3.6] of 2.87 indicates that the stellar photosphere is overwhelmed by thermal emission from 700 K dust (see Allen & Glass 1974, their Fig. 2). The optical outflows coincide exactly with a strong elongated emission ridge of a much more extensive underlying MIR structure which extends in filamentary form for several arcminutes from NE-SW. These structures are clearly related and certainly atypical of PNe, as are the rising continua. In its H structure and the shape of its MIR core, this nebula is strongly redolent of the highly collimated, high-density nebulae discussed by Corradi (1995). He linked these systems to interacting binaries containing a symbiotic star. Among the usual nebular lines, and those from H and Hei, one sees four [Feii] lines that are associated with symbiotic spectra. Hence a more likely identification would be a highly collimated bipolar outflow, perhaps from a symbiotic nucleus. Characterizing PHR12536350 as a bipolar symbiotic outflow does not explain the relationship between this object and its environment. Does the geometry of the extended MIR emission indicate the passage of this star through the ISM, represented by the filaments? Or was the object born within the material traced by the halo of MIR emission that surrounds it and that is excited by the bright bipolar nebula inside? This intriguing object is the subject of a separate paper (Parker, Cohen & Frew, in preparation). Although we regard it as a non-PN, the influence of environment on the evolution of PNe is still a relevant issue, as shown by the work of Villaver et al. (2006) on the potential contribution of the ISM to PN morphology.
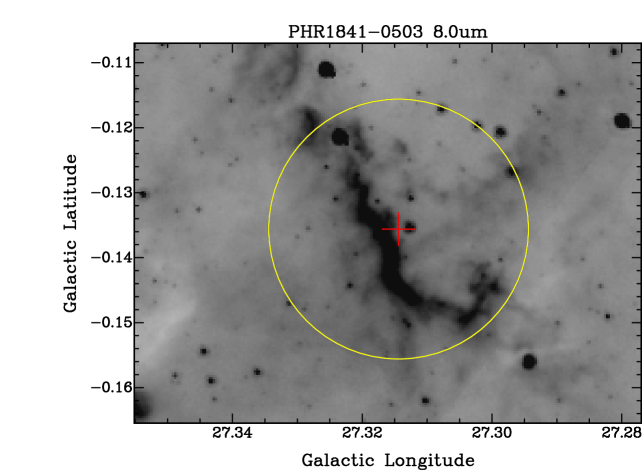
One caveat relates to the constraint imposed by the GLIMPSE survey parameters on MASH PNe in this paper. The narrow latitude range, around the Galactic Equator, of GLIMPSE should result in relatively few PNe because of the heavy extinction. The MASH survey has found new PNe in the plane because of the excellent sensitivity of the AAO/UKST H survey, where the longer central wavelength of the interference filter compared with more traditional PN search techniques based on [Oiii] detection, is less affected by extinction. Part of this success also stems from the evident patchiness of the optical obscuration. However, only 6% of the MASH catalogued PNe lie within one degree of zero latitude. In fact, one might well identify an H emission region along an unusually clear line-of-sight as an isolated PN when it is merely a less obscured part of a larger entity. A good example of this phenomenon that again emphasizes the value of MIR maps of the plane is shown by Fig. 5. PHR18410503’s location is identified by the cross in this 8.0-m Spitzer image. One can now recognize that the candidate corresponds only to a local optical brightening along an extended ridge of polycyclic aromatic hydrocarbon (PAH) emission. If the small westerly offset from the center of the MIR ridge were significant then one might argue for the ridge to represent a photodissociation region (PDR) created by ionizing radiation from some star(s) to the west of the sinuous bright 8.0-m filament.
2.2 The available data
Table 1 contains the following information: Column (1) – source name; Column (2) – status of the PN as true (T), likely (L), or possible (P); Columns (3-4) – Galactic coordinates in degrees; Columns (5-6) – J2000 Equatorial coordinates with units shown; Column (7) – optical dimensions in arcsec; Column (8) – optical morphology code, described in §2.4 and in Parker et al. (2006); Column (9) – shows the presence (“y”) or absence (“n”) of a clear MIR false-color counterpart (from IRAC) to the PN; Column (10) – indicates if an IRAC counterpart (in any or all of the 4 bands) is linked morphologically to the H nebular image; Columns (11-13) – list any MSX 8.3-m or radio continuum counterparts, with the presence (“y”) or absence (“n”) of detections listed and “…” indicating that no image from MGPS2 or NVSS was available; Column (14) – notes if the likely central star of the PN is detected, with “o” implying an optically identified CS candidate in an appropriate position (for three PNe that candidate is optically blue and is footnoted), “i” signifying a CS candidate found in 2MASS images, “m” indicating a possible stellar candidate in at least one IRAC band, and “N” denoting nebular emission seen in 2MASS. One of the MASH PNe, PHR1815-1457, designated as a likely PN, lies so close to the upper limit of latitude in the GLIMPSE coverage that it was unobserved at 3.6 and 5.8 m, although images are available in the other band pair (4.5 and 8.0 m) because of the different fields of view observed through IRAC’s two dichroic beamsplitters.
When looking for the MIR counterpart morphologically, one may see a resolved source exactly matching the ionized gas as traced by the H image. If this occurred in the two short IRAC wavelengths (3.6 and 4.5 m) it would suggest that recombination lines dominated the emission in these two filters (e.g. Pf at 3.3 m and Br at 4.05 m, respectively). Alternatively, if there is 5.8 and 8.0-m emission that follows the form of the ionized gas but with a greater extent, then we would attribute the MIR emission in these two bands to radiation from fluorescing PAHs in a PDR that wraps around the PN. Only five nebulae are detected by 2MASS as extended NIR objects: PHR14575812, PHR18310805, PHR18430325, PHR1857+0207, and PHR16194914 (PM 5, the only known Galactic [WN] central star of a planetary nebula (Morgan, Parker & Cohen 2003)).
The position of a potential CS might be close to the optical centroid (i.e. the coordinates provided in Table 1) for a ring, an elliptical or a bipolar nebula. For arcuate or partial ring nebulae the relevant location would be the center of curvature of the arc. Ten of the PNe, or 17% of the sample, show optical CS candidates; 12% NIR; and 24% MIR.
2.3 GLIMPSE residual images
Unlike with the MSX images, we have worked from GLIMPSE “residual images”. These are 3.1∘ images with 1.2′′ pixels from which all GLIMPSE point sources have been removed. The residual images are ideal for enhancing the recognition of diffuse nebulosity in regions of high point source density and enable a far more reliable photometry of such emission. The residual images use our adaptation of daophot ii (Stetson 2000) for all GLIMPSE sources detected down to 2, deeper than the publicly released Catalog and Archive point source lists that are required to meet higher reliability criteria by sources being detected multiple times at a 5 level in one or more channels. No measurements less than 3 are ever listed in either the GLIMPSE Catalogs or Archives. Thus there are faint 23 point sources that are subtracted from the residual images but which are not listed in GLIMPSE enhanced products. Residual images may contain sources not extracted by daophot, such as saturated sources and sources that peak beyond the non-linearity limit for each band. These objects were analysed individually and their integrated flux densities were subtracted.
2.4 Nebular morphology descriptors
A detailed description of the morphological classifications applied to the sample and some of the subsequent analysis form the basis of a separate paper (Parker et al., in preparation). However, after review of the existing categories, an adaptation of the current Corradi & Schwarz (1995) scheme was employed, which is based on a system developed by Schwarz, Corradi & Stanghellini (1993). A basic “ERBIAS” classifier is used to indicate PNe which are Elliptical, Round, Bipolar, Irregular, Asymmetric or quasi-Stellar (point source). We add a distinction between elliptical and circular PNe, based on interest in their canonical Strömgren spheres (e.g. Soker 2002) where an object is considered to be Round (circular) if the difference between estimated major and minor axes is 5%. In uncertain cases a dual classification might be applied such as “E/B?”. We then add a sub-classifier “amprs” to indicate an asymmetry “a”, multiple shells or external structure “m”, point-like structure “p”, a well-defined ring structure “r” or resolved internal structure “s”. Typically, only one “ERBIAS” classifier is given, but several “amprs” sub-classifications, listed alphabetically, may be applicable. Our sample of 58 PNe is comprised of elliptical nebulae (51%), bipolar (28%), round (9%), asymmetric (7%), and irregular nebulae (5%). The fraction of bipolar objects in the entire MASH is 12.5%. Limiting our sample to the very low latitude coverage of GLIMPSE has more than doubled the fraction of bipolar nebulae in our sample.
The correlation between highly bipolar PNe and strongly enhanced He and N abundances is now well-known (e.g. Corradi & Schwarz 1995) but the linkage between chemistry and morphology was first noted by Greig (1967, 1971). Subsequently Peimbert (1978) and Peimbert & Serrano (1980) defined Type I PNe in terms of threshold values of He or N abundance. Most Type I PNe were found to be bipolar (Peimbert 1978; Peimbert & Torres-Peimbert 1983), while surveys of bipolar PNe (Corradi & Schwarz 1995) confirmed their chemical peculiarities and added enhanced Ne abundance to these. As a class, Type I PNe have larger than average diameters and expansion velocities (Corradi & Schwarz 1995), hotter and more massive CS (Tylenda 1989), smaller scale heights (e.g. Stanghellini 2000), and deviate from the circular rotation of the Galaxy. Their association with more massive progenitors than typical PNe is widely acknowledged on theoretical grounds too (e.g. Becker & Iben 1980; Kingsburgh & Barlow 1994). This is consistent with the high proportion of new Type I PNe found by the MASH, with its low-latitude coverage.
3 MIR counterparts of the MASH PNe
3.1 8.0-m IRAC imagery
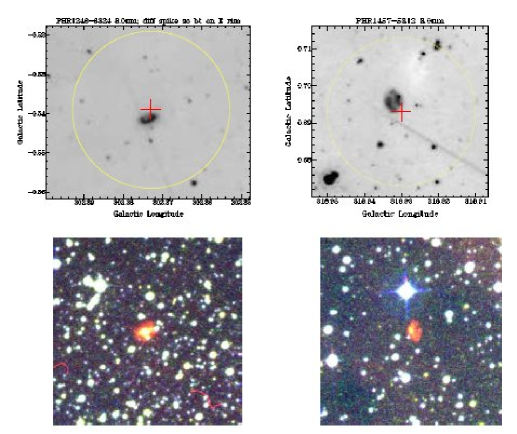
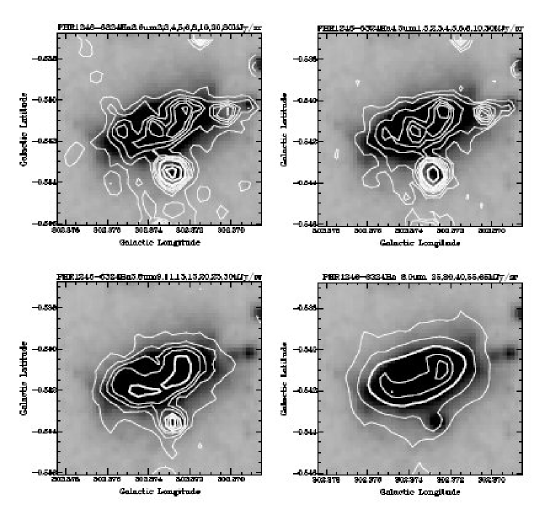
To find the PAH emission commonly associated with carbon-rich PNe (e.g. Cohen et al. 1989) we searched for MIR counterparts at 8 m. Hence, as part of the rigorous checking of all MASH candidate PNe prior to finalization of the catalog, an initial check against available MIR data from MSX was made. This was later supplemented at the lowest latitudes, by the new GLIMPSE data. As a consequence of this combined effort a significant number of Hii contaminants were culled from the MASH database before its publication. However, there are also a significant number of obviously spatially extended 8.0-m counterparts of PNe. Fig. 6 illustrates two such objects, both classified as true PNe: PHR12466324 and PHR14575812. Both were detected by MSX but no morphology could be discerned. The figure compares MIR structures (upper images) with their corresponding H images (lower images). PHR12466324 has a clear, tight, bipolar morphology while PHR14575812 is compact but asymmetric. Yet the similarities between the MIR and optical are clear. The angular sizes of the MIR and H images are in close agreement, with identical position angles of the main axis of symmetry.
3.2 False-color Spitzer imagery
MIR spectra of PNe are not always dominated by PAH emission bands. To eliminate the potential bias against any PN for which thermal emission from dust or ionic fine-structure lines might be the major contributor to radiation in the IRAC bands we made a second comparison. False-color images were produced using IRAC’s 4.5, 5.8, and 8.0-m bands shown in blue, green, and red, respectively. This particular trio avoids the clutter due to the high stellar density in the 3.6-m band.
The MSX data at 8.3 and 12.1 m also measure PAH emission, but 12.1-m was generally not sensitive enough to provide a confirming detection. By contrast, the IRAC results offer three sensitive bands capable of sampling PAH emission (3.6, 5.8 and 8.0-m). The 3.3-m PAH band lies within IRAC’s 3.6-m band but its strength is typically only 10% of that of the 7.7-m PAH band, while the 6.2-m PAH feature attains 56% of the 7.7-m band in PNe, reflection nebulae, and Hii regions (Cohen et al. 1986; their Table 5). Therefore, 3.6-m imagery is not a sensitive tracer of PAHs, and we looked for similar morphologies in the 5.8 and 8.0-m bands to confirm the existence of PAHs, that are often the dominant spectral features in PNe. Furthermore, it is well-known that PNe also produce emission from lines of H2 (ro-vibrational and pure rotational lines; e.g. Cox et al. 1998). H2 lines can contribute to emission in several IRAC bands. They are chiefly seen at 8.0 m (Hora et al. 2004) but can be responsible for over 90% of the flux detected in IRAC’s 3.6, 4.5, and 5.8-m bands (Hora et al. 2006). This molecular emission in PNe can arise either in the warm molecular zone of a PDR or in shocks. In NGC 6302 the molecular gas is photo-dissociated (Bernard-Salas & Tielens 2005) while, in the main ring of the Helix, 90% of the H2 emission is in shocks and only 10% in PDRs (Hora et al. 2006). Such PNe could appear red but might have different morphologies at 5.8 and 8.0 m, rather than identical structures as with pure PAH emission.
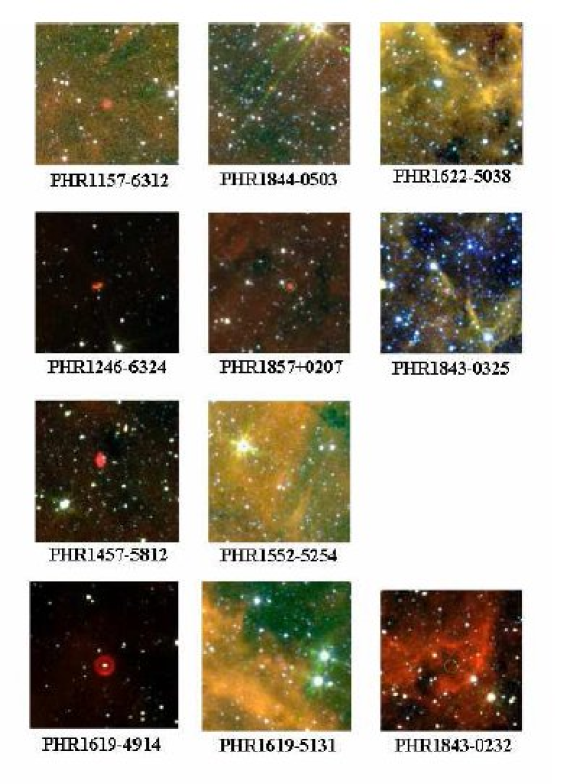
We intended the 3-color image to be a simple pragmatic tool that treats every PN’s trio of images identically. We used SAOImage ds9 in its RGB mode. Each of the three color images for a given PN was displayed with the same stretch: linear and zscale. These images were examined for evidence of an extended counterpart to each PN, that had a distinctive color compared with its surroundings. Clearly, MIR-bright PNe will stand out against a dark sky background, whatever their false color (typically red). Fig. 7 displays 10 PNe that are recognizable by this technique. Six are very obvious examples demonstrating the power of this identification technique, while 4 others illustrate its capability for robustness in the presence of complicated MIR background emission. Indeed, we are investigating the prospects for discovering new PNe, too obscured to be visible in the SHS, by using GLIMPSE 3-color imaging alone.
PHR18440503 (top image of second column of MIR composite images in Fig. 7), whose position is indicated by the small green circle based on the optical position, epitomizes the obvious matches, despite confusion with a diffraction spike from a bright source at the northern edge of the image. The orange periphery and yellow core distinguish the PN from artifacts and from the many stars seen in the field.
PHR11576312 (top image of first column in Fig. 7) lies in a field that is relatively sparse in stars but suffers from bright MIR “cirrus” emission that permeates almost the entire 44 arcmin field that we show. The PN is the scarlet diffuse patch just below the field center, strongly contrasting with the widespread orange diffuse emission and predominantly green noise. Twenty one nebulae (36% of the 58) have definite, resolved, counterparts that are distinguishable from their environs by false color imaging. The dominant colors associated with these 21 MIR counterparts separate into three groups: 8 are red; 10 are violet; and 3 are orange.
Red most likely represents dominant 7.7 and 8.7-m PAH band emission. Orange could imply either of two explanations: PAH emission with strong 6.2-m emission (comparable intensities in the 5.8 and 8.0-m bands would lead to orange or yellow in false color) or H2 emission lines which are strongest in IRAC’s 8.0-m band but also contribute to the 5.8-m band chiefly through the 00 S(7) line (e.g. Hora et al. 2006). Violet objects could also represent two types of PN. In high-excitation PNe, ionic lines of heavy elements such as [Mgiv] (4.485 m) and [Arvi] (4.530 m) are very strong and fall in IRAC’s 4.5-m band. However, such an object would also emit strongly in the 8.99-m [Ariii], 7.90-m [Arv], and 7.65-m [Nevi] lines in the 8.0-m band. A combination of high-excitation lines would increase emission in both the 4.5-m and 8.0-m bands, leading to violet in the false-color image. As a second scenario we suggest another possibility, namely low-excitation PNe in which the H recombination lines are the dominant spectral features. The combination of Br and Pf (in the 4.5-m band) would overwhelm Pf and lines such as Hi 68 (in the 5.8-m band). Flux density ratios 4.5-m/8.0-m in typical PNe are very small except when H lines are dominant. Ratios of 5.8-m/8.0-m emission without substantial extinction, for PNe dominated by (i) PAH bands, or (ii) H2 lines, or (iii) H recombination would be about 0.5 (Cohen & Barlow 2005, Tables 2,3), 0.3 (Hora et al. 2006, Table 2), and 0.1 (using the H recombination lines in IC 418: Pottasch et al. 2004), respectively. Bernard-Salas & Pottasch 2001), respectively.
Although the statistics are very limited, we note from the available MASH optical spectroscopy that the average ratio of [Nii]/H for the seven PNe with red 3-color images (excluding PM 5 which has Heii rather than H) is 2.40.5, the three orange PNe give 6.31.7, while that for ten nebulae with violet images is 1.00.5. It appears that the false color combination of IRAC bands 2, 3 and 4 can differentiate between PNe of high and low [Nii]/H. Thus we propose the following model to explain the MIR false colors and optical excitations of PNe. “Red” PNe are PAH-dominated and of modest excitation, “orange” objects are dominated by H2 or high-excitation fine-structure lines and “violet” nebulae are dominated by H recombination lines and are of low or very low excitation.
For the 22 PNe with [Nii]/H 3, 9 objects (41%) have a bipolar morphology, suggesting that this line ratio may be a valuable proxy for selecting Type I PNe (see also Parker et al., in preparation). No such patterns emerge in the smaller sample of PNe with measured ratios of [Oiii]/H intensities.
3.3 Overlays of MIR on H images
To locate the MIR counterparts the H images were regridded to Galactic coordinates with the same projections as the GLIMPSE maps and each of the four IRAC images was overlaid as contours on the H image. “Quartets” of these overlays were inspected. Most of these IRAC counterparts are clearly resolved and many have similar morphologies to that shown by the PNe in H, at least at the shorter IRAC wavelengths. The lowest contours displayed in all quartets were set as the mean off-source level of emission plus 3 standard deviations. Filaments of PAH emission (in the 5.8 and 8.0-m bands) that might represent limb-brightened PDRs will appear displaced from the periphery of a PN. In addition, one can readily recognize potential MIR counterparts to the PN central stars. For 9 of the 58 PNe (16%) we could identify a candidate central star in one or more IRAC bands. Generally these are blue; i.e. they become monotonically fainter with increasing IRAC wavelength.
To illustrate how the quartets were used to determine the MIR counterparts to PNe, we present four such quartets, chosen to highlight different features in the nebulae, their probable MIR emission processes, and their central stars.
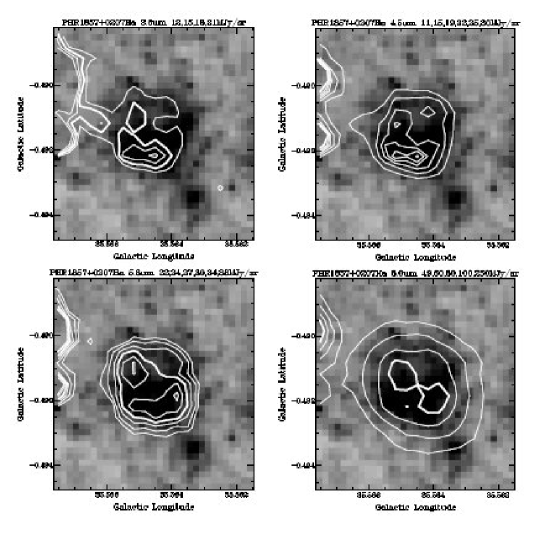
The first quartet, presented in Fig.8, shows the small nebula PHR1857+0207 that appears in an otherwise empty field. Note the progressive increase in size of this likely PN with increasing wavelength, and the change in its morphology from the asymmetric enhanced brightness of the southern limb in the three shortest bands to the large circular appearance at 8.0 m. We identify the 8.0-m structure and the increase in size at 5.8 m as due to a substantial PDR that envelops the entire ionized zone. Ionic fine structure lines probably account for the changing size from 3.6 to 5.8 m.
The second quartet, Fig. 9, offers an optically and MIR-bright true PN, PHR12466324. This field has several blue stars at 3.6 and 4.5 m, in particular one bright star just below the PN’s center, which seems to be unrelated to the nebula. The number of stars detected falls with increasing wavelength (as expected for random stars in their Rayleigh-Jeans domain) and only the brightest one is still detected at 8.0 m. The PN is bipolar and the bright H axis is filled across the pinched waist. This elongation is also seen in the MIR. Unlike in Fig. 8, the 3.6 and 4.5-m bands are almost identical in appearance and dimensions, which closely match the distribution of ionized gas traced by H. This is due either to recombination lines in these two short bands (e.g. Pf and Br, respectively) or to thermal emission from dust grains, close to the central star, which are heated by direct starlight. In both the longer bands the PN is markedly larger in latitude extent, reflecting the contribution by PAHs in the PDR in the outer portions of the nebula. The inner contours suggest thermal emission by cooler grains in a somewhat tilted dust disk. This dust emission must be optically thin to produce the two peaks, presumably from limb-brightening along the line-of-sight to the circumstellar dust disk. The U-shaped curvature of the second highest 8.0-m contours strongly suggests that IRAC has resolved a tilted dusty disk.
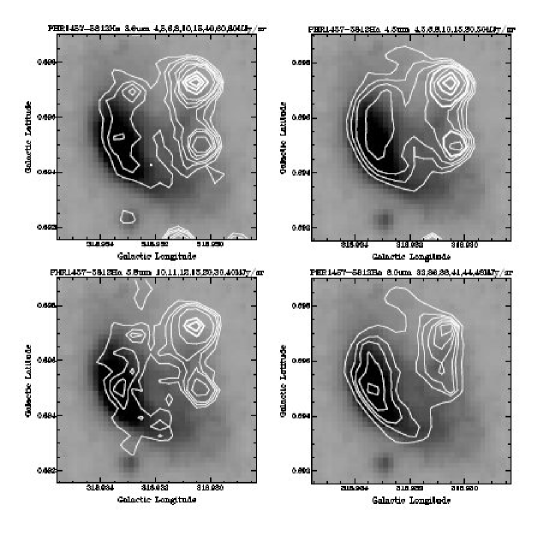
Fig. 10 presents PHR14575812, in the third quartet; a true PN with a very different MIR structure, also shown in Fig. 6 and in Fig. 7 (left column, third image down). One must ignore the two unrelated point sources projected against the western edge of the PN. It is a compact but asymmetric PN with a strongly enhanced eastern edge. The curving eastern portion with the bright H emission coincides with the peaks of MIR counterparts in the three longer IRAC bands. These MIR peaks shift slightly with wavelength but the spatial extent of the resolved structure is remarkably similar at 3.6 and 5.8 m where it lies inside the H image, and again at 4.5 and 8.0 m, where it is slightly more extensive with a boundary very well-matched to that of the ionized gas. Despite the redness (Fig. 7) this pattern does not suggest the presence of PAHs. It seems more indicative of strong emission by the pure (=0-0) rotational lines of H2 within the IRAC bands. These lines dominate the MIR emission of the Helix Nebula (Cox et al. (1998); Hora et al. (2006)) and are strong in high-excitation PNe (Bernard-Salas & Tielens 2005). This would also account for the nebular detection by 2MASS, which is brightest in the Ks band that includes H2 from the strong S(1) 1-0 line. Optical spectra available from MASH for this object show [Nii]/H 4 but only weak [Oiii] in the blue due to high extinction. There is also weak [Ariii] at 7136Å but no evidence of higher excitation Heii.
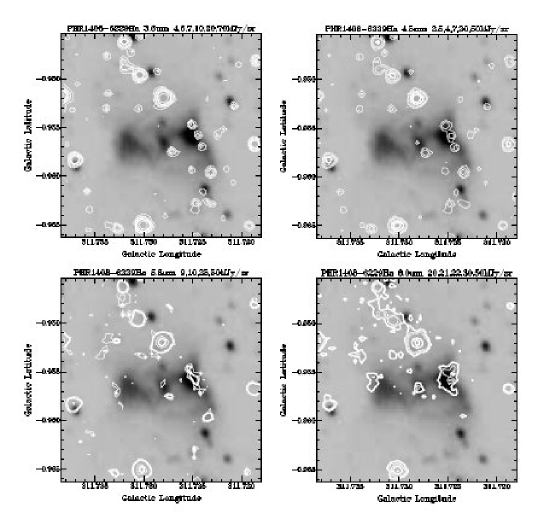
The fourth quartet appears in Fig. 11, which represents the inner parts of the bipolar true PN PHR14086229, whose brightest H component is the east-west edge-on disk that is shown in each figure. The two flanking regions represent optically-thin, limb-brightened, ionized gas viewed at the extreme edges of a circumstellar torus of gas. The bipolar lobes are much fainter and extend far to the north and south of this disk. Three stars appear against the western side of the torus at 3.6 and 4.5 m but disappear at 5.8 m, to be replaced by a small diffuse patch. This becomes more prominent at 8.0 m. We interpret this, and its fainter eastern counterpart, as PDRs lying just outside the bright ionized edges of the central disk. The peak of the eastern PDR is clearly displaced from the H emission. The PN has a size in H of 82′′46′′. Large PNe lack PAHs, perhaps because these lower density nebulae are optically thin to ionizing radiation and have no PDRs. The only large PNe in which PAHs have been detected are bipolar, high-excitation PNe in which PAHs are found in a high-density central circumstellar disk. We note that PHR14086229 has [Nii]/H of 8, and shows [Oiii] H so it may well be another high-excitation bipolar PN. It is fortunate that a blue spectrum of this object exists to support this conclusion. Often the MASH PNe have lower quality blue spectra because the heavy extinction so close to the Plane requires extremely long integrations to detect a useful result.
3.4 The fraction of PNe with the most convincing MIR counterparts
Not every PN that can be recognized by false-color imaging can be meaningfully extracted from its surroundings; for example, PHR18430325 (Fig. 7; bottom right corner). We focus now on the most convincing MIR counterparts of MASH nebulae. These are PNe for which robust quantitative estimates can be made of 8-m emission above their surroundings. Among the 58 PNe we found 14 (24%) such MSX counterparts and 19 (33%) using GLIMPSE images due to the higher sensitivity and resolution of IRAC. These seem like small numbers of MIR counterparts detected compared to the success rates enjoyed by the MIR surveys made in the 1980s of the then known PNe, later compiled into the highly heterogeneous catalogs of Acker et al. (1992,1996) and Kohoutek (2000). What differentiates the MASH PNe from the traditional, but highly heterogeneous compilations of PNe first assembled at Strasbourg?
Firstly, the previously known PNe catalogued by Acker and colleagues and independently by the various compilations of Perek and Kohoutek (e.g. Kohoutek 2000), were largely detected originally in the optical from broadband, narrow-band, or objective-prism photography. Unsurprisingly, these samples represent the bright end of the PN luminosity function and those nearest the sun which are less extinguished. It is only recently, with the advent of new surveys in the infrared and optical using, for example, combinations of selected narrow-band filters and CCD imaging, that more extinguished, lower surface brightness and more evolved PNe have been detected in significant numbers. A brief summary of these small-scale projects appears in the main MASH paper of Parker et al. (2006) but it is the MASH survey itself that has changed the situation most dramatically (see later).
Early MIR work drew upon the previously published PN compilations and found all the IR-bright nebulae amongst the known optical PNe. For example, at 10 m Cohen & Barlow (1974,1980) detected 52% of their combined total of 145 of the optically best-known PNe with apparent diameters 30′′. Consequently, a large fraction would be expected to have MIR counterparts. Cohen & Barlow (1974) also noted that those PNe whose central star showed an optical emission-line spectrum were more likely to have MIR detections. Other programs have made use of the specific colors of PN candidates through the far-infrared (60 and 100 m) excess associated with the cool dust in the nebulae. Ratag & Pottasch (1991) and van de Steene & Pottasch (1995) identified 63 new PNe and 67 possible PNe. There is always a question mark over such candidates until confirmatory spectroscopy and high resolution optical, NIR, or radio imaging are obtained.
Young compact PNe are dense, surrounded by dust grains that are heated dominantly by direct starlight. Most of these were already known from early optical searches. Mature PNe that have expanded significantly derive most of their MIR thermal emission by absorbing resonantly trapped Ly- photons (Cohen & Barlow 1974). This mechanism acts as a thermostat so that all grains in the ionized zone of a PN see approximately the same intensity of UV radiation and attain the same temperature, typically around 120 K. At this temperature, the bulk of the thermal dust emission is radiated at wavelengths longer than 25 m and does not lead to bright emission near 8 m from PNe. The dominant emission processes that can be observed in PNe by IRAC are fluorescent PAH bands from the PDR, fine structure lines from the ionized zone, stratified outward in the nebula according to decreasing excitation level, and H2 lines that arise chiefly in the warm regions of the PDR. Forbidden atomic lines also emit in the PDR but these radiate principally between 35 and 158 m, outside the range of the IRAC.
MASH has greatly increased the number of the most highly evolved optical PNe known. Indeed, it has discovered even more extreme examples of the phenomenon of PNe that are dissolving into the interstellar medium, e.g. Pierce et al. (2004). Such PNe are inherently of low surface brightness, except at possible shock fronts, and so become undetectable at increasing distance from the sun and as the interstellar extinction levels become significant. MASH PNe span a broader evolutionary range than the previously published PNe and are generally more evolved, obscured, of lower surface brightness and greater angular extent than those of most other PN catalogs. These combined properties naturally lead to lower levels of MIR detectability with current survey sensitivities including GLIMPSE, though the success rate here is higher than for the same region covered by MSX. These characteristics and the implications for MIR detectability are explored in more detail below.
3.5 The MIR attributes of MASH PNe
As a PN ages many factors affect its MIR-detectability. When the density drops below Ne1000 cm-3, Ly- photons are no longer trapped in the ionized zone and dust grains can absorb only dilute starlight that provides little thermal heating, particularly as the central star descends the white dwarf cooling track. Lower density nebulae are optically thin to ionizing radiation and have no PDRs unless they are also bipolar and surrounded by dense circumstellar disks (Cohen & Barlow 2005). Extensive neutral and molecular material resides outside many PNe from previous mass lost while the star was on the asymptotic giant branch (AGB). Indeed, the bulk of the stellar ejecta in PNe must occupy extensive, but optically-faint, AGB halos that are created by slow AGB winds and are either neutral or only weakly ionized. Advancing age also increases the fraction of total PN mass in the form of ionic gas, while decreasing the atomic and molecular gas masses (Bernard-Salas & Tielens 2005), reducing PAH and H2 emission and lessening nebular detectability by IRAC. While these authors emphasize the importance of the PDRs around PNe they state explicitly that these regions are thin compared with the ionized zones. Therefore, they do not treat extended halos in their analysis so their “total mass” excludes AGB halo material. However, their overall results are robust as regards the PDRs and the ionized regions of these nebulae to which the MASH, IRAC, and radio continuum are sensitive. As a nebula ages and expands, the radiation field at large radii is more dilute even as the nebula itself becomes optically thin. Those PAHs that still survive are bathed in a diminishing far-UV radiation field, which can be quantified by plotting incident far-UV flux against PN diameter (Bernard-Salas & Tielens 2005: their Fig. 3). Recombination occurs if denser clumps remain in the inner nebula and previously neutral gas continues to expand slowly outwards.
Not every PN is carbon-rich, containing PAHs. Oxygen-rich PNe also have dust grains, identified by their silicate spectral features, which peak near 10 m. These contribute relatively little to the IRAC 8.0-m band, whose relative spectral response curve drops abruptly beyond 9 m. Furthermore, for a PN with a low gas-phase ratio of C/O, the fraction of total nebular IR luminosity emitted in PAHs is correspondingly decreased (Cohen & Barlow 2005: their Fig. 3). Therefore, fewer 8-m counterparts should be found among PNe that are highly evolved, or physically large, or of low C/O abundance ratio, and among those for which the central stars exhibit no stellar winds (seen via Wolf-Rayet or Of emission lines). Of our 58 PNe, only PM 5 has a known emission-line central star. Consequently, a much smaller proportion of MASH PNe are expected to have MIR counterparts, as has been found.
Preliminary central star identifications have been made for about 15%-20% of the MASH catalog nebulae, mostly based on a method in which all the available photometric images (SuperCOSMOS Sky Survey, H, blue and red images, etc.) have been examined. Central (blue) star candidates were identified by combining the UKST (IIIaJ), UKST Short Red, and H, images as the blue, green and red elements of a false-color composite and blinking this composite with differences or ratios between and (UKST Red, IIIaF) images. On close inspection, many of the fainter stars in these tri-color composites are “blueish”, a consequence of the fainter limiting magnitude of the blue IIIaJ emulsion in general. In a crowded field there is a good chance of one of these faint “blue” stars appearing close to the geometric center of an extended PN and being identified as the true CS. photometry is, therefore, needed in all doubtful cases. However, because there are so few candidate blue stars in this paper (most PNe in GLIMPSE are at very low-latitudes and suffer high extinction), it is not really a factor. PHR1447-5838 and PHR12446231 are currently the only really clear cases of a blue CS candidate.
3.6 Notes on individual objects
Individual MASH PNe are detailed below if they illustrate aspects of the process of establishing multiwavelength identifications.
PHR18131543: the radio counterpart appears to be a double source, perhaps a background radio galaxy. There is no MIR counterpart within the PN nor around its periphery.
PHR18260953: The radio source is located exactly at the H centroid of the PN. The MSX counterpart of a bright star fills much of the area of the PN. In the IRAC mosaic image the stellar diffraction vanes make accurate analysis impossible. However, the GLIMPSE residual images indicate that the star is not associated with the PN because it lies far from the optical centroid of this oval bipolar nebula. Bright diffuse emission lies across the PN so that it is difficult to provide a useful upper limit with MSX (160 mJy at 8.3 m is given in Table 2). There is clearly an excess of MIR emission within the PN and this can be measured using the residual images to give an IRAC 8.0-m detection of 170 mJy.
PHR18430232: The NVSS radio source in this vicinity is not associated with the PN. There are clear indications of a surrounding PDR that wraps around 270∘ of the PN’s outer rim at 8.0 m. However, the region is suffused by bright streamers and extended 8.0-m emission so that an estimate of the MIR emission from the PDR is impossible. This situation occurs frequently and emphasizes the impossibility of undertaking any uniformly flux-limited survey within the Galactic plane. The problem is illustrated for this PN in the final panel of the montage of 3-band false-color images in Fig. 7 (bottom right corner). The 8-m sky brightness in the immediate vicinity of the PN is about 70 MJy sr-1.
PHR14575812: The MSX Point Source Catalog ver.2.3 (PSC2.3: Egan et al. 2003) offers only an upper limit at 8.3 m of 110 mJy, consistent with our detection of a spatial integral of 78 mJy above local background in a region encompassing the PN’s H extent.
PHR16194914: This object is “PM 5”, the only PN known in the Galaxy to have a central Wolf-Rayet star of type [WN] (Morgan, Parker, & Cohen 2003). Although the MSX PSC2.3 lists a value of 600 mJy at 8.3 m this is not of the entire PN, which is substantially larger than the MSX point spread function (PSF), nor does it reflect an accurate estimate of the CS which lies in bright PN nebulosity. An estimate using the IRAC images suggests that the CS contributes about 25% of the PN’s total integrated flux at 8.0 m. A more detailed examination of this PN with Spitzer will be presented by Cohen, Shupe, & Parker (in preparation).
PHR12236236: This object shows weak evidence for an association between the PN and diffuse patches of 5.8 and 8.0-m emission on the NE and SW rims. A bright star is projected against the NE rim making it difficult to distinguish between artifacts of this point source and MIR extended emission. However, the residual image definitively shows diffuse 8.0-m emission distinct from the stellar PSF.
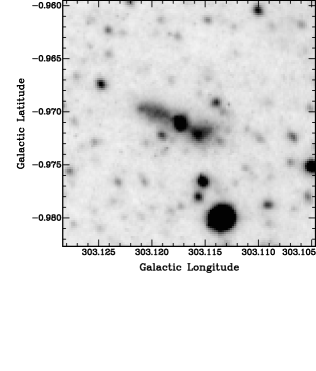
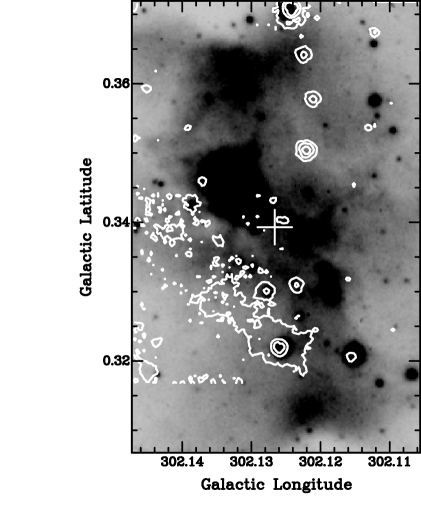
RCW 69 (PHR12446231) is a relatively nearby, evolved Type I bipolar PN (Frew, Parker, & Russeil 2006), viewed through the Coalsack. RCW 69 is one of the closest PNe in the GLIMPSE sample (1.30.2 kpc) and it is also intrinsically large (1.61.5 pc2). It has an elongated central bar in optical images which likely represents a thick edge-on torus similar to the ring seen in the Helix nebula (O’Dell, McCullough, & Meixner 2004), but it is much fainter in H surface brightness than the Helix and is more evolved. Frew et al. (2006) identify the =18.4 CS and demonstrate that it is on the white dwarf cooling track. This star is undetected in GLIMPSE images. Fig. 12 overlays 8.0-m contours on an H greyscale image of the PN. The location of the CS is marked by a cross. There is evidence for a PDR in the form of a bar of 8.0-m emission displaced to the east of the obvious nebular bar, making RCW 69 another example of a large bipolar PN associated with PAH emission. Frew et al. (2006) discuss the possible detection of CO (1-0) and CO (2-1) emission which indicates the presence of molecular material in the PN although its location is unknown.
PHR12506346: The association (in Table 1) between MIR emission and this moderately large PN seems likely because there are indications of a peripheral PDR around the western rim in the form of diffuse emission at 5.8 and especially at 8.0 m.
4 The diffuse calibration of IRAC
Cohen et al. (2006) have recently examined the diffuse 8.0-m calibration of IRAC using a sample of 43 Hii regions observed by MSX and by the Spitzer Telescope. For an angular spatial scale of up to they found a median ratio of IRAC 8.0-m to MSX 8.3-m spatially integrated fluxes of 1.550.15. A factor of 1.14 is caused by the different contributions made by PAH emission in the two very different space-based bandpasses. The remaining component corresponds to an overestimate by 36% in the instrumental calibration of IRAC at 8.0 m, as was independently noted by Reach et al. (2005). The Spitzer Science Center (SSC) has recommended that extended source 8.0-m fluxes be scaled down by a factor of 0.74 (see also comparable work based on the light distributions of elliptical galaxies 222http://ssc.spitzer.caltech.edu/irac/calib/extcal/).
The MASH PNe have been used to check the absolute diffuse calibration of IRAC at 8.0 m on smaller spatial scales than in our study of Hii regions, spanning the range from PNe only slightly larger then the IRAC PSFs (but smaller than the MSX PSFs) to a scale of a few arcmin. Details of the method adopted to calculate directly comparable integrated fluxes from the MSX images of the PNe and the GLIMPSE residual images are given by Cohen et al. (2006). To represent the PNe we utilized the H images from the SHS (Parker et al. 2005). The outer H contours of each PN were overlaid on its quartet of IRAC images and the flux density integrated over the identical area for all bands, while including any peripheral PDR apparent at 8.0 m. The same approach was used with MSX 8.3-m images. Multiple estimates were made of the sky background for each PN. For the measurements of sky background for each PN, specific areas were selected from the IRAC 8.0-m residual images. The same areas were used for the three other bands. It must be emphasized that it is critical to understand the contribution of the interstellar medium at 8.0 m in defining what is sky emission and what is a MIR counterpart of a PN.
Extraneous stars (not CS candidates) within the PN boundary were removed from the MSX PN images using the MSX PSC2.3 and the Reject Catalog. For the study of Hii regions (Cohen et al. 2007) the areas were as large as 1.5 deg2, and we used a validated statistical method for the removal of contaminating point sources. Many of these sources were undetected by MSX with its lower sensitivity but were automatically removed from the GLIMPSE residual images. Therefore, in order to make a meaningful comparison between IRAC and MSX spatially integrated fluxes, one needs to subtract the contribution from the contaminants to the same depth for both datasets. A more complete explanation is given in Cohen et al. (2007), section §4.1. The method utilizes the total surface brightness mode (Cohen 2001) of the “SKY” model for the point source sky (Wainscoat et al. 1992), operating in the 8.3-m MSX band using its embedded library of 235-m archetypal spectra (Cohen 1993). SKY calculates the diffuse sky surface brightness due to smearing of unresolved point sources.
The largest PN in our sample of 58 MASH objects (PHR14086106) encompasses an area of 18 arcmin2. Within the H boundary there are two unresolved 8.3-m sources from the MSX PSC2.3 catalog above the 5 level and none listed in the corresponding Reject Catalog. The background emission would permit detection of an 8.3-m source at magnitude 7.5 (60 mJy). SKY predicts that an additional 2% of the sky background surface brightness should be subtracted from the integrated PN flux to account for the sources (to a magnitude of 8.0) that were removed in producing the GLIMPSE residual image in this field. Such a small adjustment is well within the uncertainties of our MIR flux measurements. The remainder of the MASH sample have smaller areas and correspondingly smaller corrections to their observed 8.3-m integrated fluxes. Consequently, we have subtracted only those point sources listed in the PSC2.3 and the Reject catalog to ensure equivalence of the PN fluxes estimated from the MSX and GLIMPSE residual images.
We also estimated upper limits for PNe undetected by MSX and/or IRAC as three times the root-sum-squared 1 uncertainties in the fluxes measured for both PN and sky background locations at each wavelength.
Table 2 summarizes the MIR integrated fluxes for 19 PNe. Objects listed first have MIR detections from MSX and IRAC, together with a radio detection. Later entries are PNe without radio detections but with both MSX and IRAC data. PNe with fewer than two detections among MSX, IRAC, and the radio continuum are excluded.
A total of fourteen PNe have both MSX and IRAC MIR detections. This sample spans a dynamic range at 8 m from below 30 mJy to about 1000 mJy. Fig. 13 compares these results and plots a formal linear least squares regression line (with uncertainties in both variables). The slope of this logarithmic plot is 0.90.1, consistent with a linear proportionality between IRAC and MSX fluxes. The offset is poorly defined as 0.40.2, corresponding to a ratio of IRAC/MSX of 2.91.5. More accurate determinations come from the unweighted mean of the ratios of IRAC/MSX (1.30.2) and the median of the sample of fourteen PNe (1.20.2), which are consistent with the factor of 1.55 found for this ratio from Hii regions (Cohen et al. 2007).
The fourteen PNe also span a wide range in spatial scale. We used the geometric mean of the MASH measurements of the major and minor axes of the nebulae in H to calculate a representative “diameter”, which varies from 9″ to 77″. Several PNe are smaller than the MSX PSF and several are smaller in the MIR than in H even when resolved by IRAC. A plot of the ratio of IRAC/MSX against nebular radius will reveal if the calibration of IRAC diverges with increasing PN radius from the expectation of a ratio of 1.0 at small scale (the point source calibration of IRAC is good to 3% absolute) to a value close to 1.55 for the largest scale at which we can probe the diffuse calibration. Fig. 14 illustrates this comparison.
Three lines are overlaid on the plotted points: the formal regression line (solid) and the limiting relationships that couple the mean+1 slope with the mean1 offset, and vice versa (dashed lines). The regression was derived by assigning 10% uncertainties to the diameters of the PNe, and using the 1 errors in the ratios of MIR fluxes determined from the root-sum-squared errors in both IRAC and MSX flux integrals. The slope is 0.0050.005, with an offset of 1.10.1. The results are, therefore, marginal but would accommodate a gradual change between a point source calibration factor of 1.0 at small nebular size to a diffuse factor 1.4 by 77″.
5 PN colors with IRAC
Table 3 summarizes the six color indices in Vega-based magnitudes derived from 41 of the 58 MASH PNe for which spatially integrated fluxes were estimated. Not every band was measureable above the sky for every nebula. The median colors and the standard errors of the median (sem) are given after applying the SSC recommended aperture correction factors in each IRAC band. The color offsets that these cause are given by Cohen et al. (2007: their Table 5, col.4). For comparison we have synthesized the same six colors for a set of 26 optically well-known PNe taken from Acker et al. (1992), based on low-resolution spectra obtained with the Short Wavelength Spectrometer (SWS) of the Infrared Space Observatory (ISO). There is excellent agreement within the 1 joint uncertainties.
Fig. 15 illustrates the ([3.6]-[4.5],[5.8]-[8.0]) color-color plane with 87 types of sources plotted. This diagram too was synthesized from the spectral library embedded in the “SKY” model (Cohen 1993). Overlaid on this plane are three boxes for PNe. The solid box is for the median2 sem for the sample of MASH PNe. The dashed box is for the ISO/SWS sample of PNe but is based on median1 sem colors due to the poor signal-to-noise ratios at short wavelengths. The third (dotted) box corresponds to the entire range of colors for the small sample of PNe from Hora et al. (2004: their Fig. 3). There is good overlap between the three boxes of Galactic PNe. The intersection of these color-color regions includes the two large filled circles, that represent SKY’s predictions for ensemble averaged colors for “blue” and “red” PNe. Cohen (1993) lists the nebulae used to produce these PN spectra and Walker et al. (1989) explain how they are distinguished from one another in color-color planes.
Can we distinguish PNe from the plethora of other MIR sources using this color-color plane? Only a single category among the 87 compact MIR sources in SKY is expected to contaminate any of the three color zones observed for planetaries, shown by the cross near (1.7,0.4) in Fig. 15. That category corresponds to one type of reflection nebula. This contaminant is easily removed by comparing H and red continuum exposures. Compact Hii regions (small filled circle in the figure) cannot be confused with PNe but some extended Hii regions do overlap the lower right portion of the solid box for MASH PNe (see Cohen et al. 2007; their Fig. 8). We attribute this similarity of colors to PAHs that dominate the MIR spectra of many Hii regions and of some PNe. However, these two classes can be readily separated by MIR morphology and/or by optical spectroscopy. Spiral galaxies (both normal and interacting), ellipticals, and irregulars all show minimal overlap with MASH PNe and none with the other PN samples, while QSOs do not overlap any PN color-color zone. (Smith et al. 2007).
Young stellar objects (YSOs) span a very wide range of GLIMPSE colors. From a large grid of pre-computed models (Robitaille et al. 2006) one finds that some younger YSOs would overlap with PN colors. The energy distributions of bona fide PNe are never even quasi-continua. This can lead to real ambiguity when model energy distributions are compared with solely broadband measurements of spectra that contain strong emission lines, and broad emission or absorption bands. Consider a confirmed PN whose MIR spectral energy distribution is well-matched in the IRAC range by that of a YSO from this grid (Robitaille et al. 2007). Currently, a true PN must be optically detected, suffer no unusual reddening, be isolated from obvious star-forming regions, emit the appropriate optical forbidden lines with the correct intensities, and have a morphology plausible for a PN. Thus, no MASH PN is actually a YSO. Conversely, one could discriminate between a true PN and a YSO, whose IRAC photometry places it within the color-color domain that we have identified for MASH PNe, by the application of these additional criteria. Perhaps the simplest test is to examine the extinction required to match a YSO model to the IRAC photometry. Good fits of YSO models to PN energy distributions often involve high reddening (AV5) and the existence of an optical counterpart makes it less likely that one has found such a YSO. Colors alone cannot uniquely identify new IR-discovered PNe. The goal is simply to isolate plausible candidates for future follow-on spectroscopy.
6 MIR/radio flux density ratios
Radio flux densities were obtained from the MGPS2 (Green 2002, Murphy et al. 2007) and NVSS (Condon et al. 1998) surveys. MGPS2 covers the sky south of 30∘ Dec. at 843 MHz and NVSS covers the sky north of 40∘ Dec. at 1.4 GHz.
For MGPS2, flux densities were calculated using the using the miriad imfit task to fit elliptical Gaussians above a planar background. For the NVSS the source catalog was queried and imfit was also run on the survey images as confirmation. The images were inspected to reject multiple source detections and unrelated chance alignments. Mauch et al. (2003) and Murphy et al. (2007) determined that the flux density calibration of NVSS and MGPS2 agreed to within 2%, based on a comparison of 7000 sources in the overlap zone between these two surveys.
All MGPS2 detections of our PN sample were unresolved (as defined in Mauch et al. 2003) and hence the fitted peak flux density is used as a good measure of the integrated radio fluxes. NVSS detections were treated identically.
All the PNe should have thermal spectra in the radio continuum and the difference between flux densities of an optically thin PN at these two frequencies is about 5% (after allowance for the Gaunt factor). If the PN are optically thin, then this change is smaller than the uncertainties in the radio flux determinations. If the nebulae were fully optically thick in the radio domain (), then the flux ratios between 1.4 GHz and 843 MHz would be 2.8. Taking even this most extreme case, the range of values for either one of the frequencies is more than any global change in the ratios due to any mild optical depth effects. Furthermore, the significant difference between the present PN sample and the previous estimate using bright PNe from the Acker et al. (1992) database remains. For the present analysis, we do not distinguish between results from these two surveys. The reason for the small number of radio detections found partly reflects the confusion from high source density along the Galactic Plane, but is also due to the intrinsic radio weakness of the MASH PNe.
Might the MASH PNe be optically thick around 1 GHz? Forty-five objects in the compilation of radio measurements of 557 PNe by Higgs (1971) have either detections or useful limits below 1 GHz. We examined the uniform set of models for which Higgs adopted Te=12000 K and fitted for (10 GHz). The median value of (10 GHz) for these 45 PNe is 0.0017. Free-free radio optical depth is so (1.4 GHz) would be 0.10, and (843 MHz) 0.30. If MASH PNe were similar to these 45 nebulae, then their NVSS flux densities would be converted to those at 843 MHz by multiplying by or 0.82. But many MASH PNe are more evolved, fainter, and probably of lower density than previously studied objects. This too lowers their radio optical depths (N).
Ten PNe detected by MSX at 8.3 m also have radio fluxes. Fifteen detected by IRAC at 8.0 m also have radio fluxes. We have examined the relationships between these two pairs of flux densities. The regression lines for MSX and radio fluxes have a roughly linear proportionality with an unweighted mean of 61.4 and a median ratio of 51.5. The corresponding regression between IRAC and radio fluxes has a mean of 92 and a median of 52.5. Given the factor of 0.74 to be applied to IRAC at 8.0 m to correct its diffuse calibration, the IRAC mean and median would become 6.51.5 and 42, in the validated MSX calibration basis. Within their uncertainties, the MSX/radio and IRAC/radio ratios agree at the 1 level. Combining them with inverse-variance weighting yields an overall MIR/radio ratio of 4.61.2 for the MASH PNe.
Cohen & Green (2001) took a set of 21 PNe from the Acker et al. (1992) catalog and derived a median ratio of MSX/radio of 12. This is half the median value of 255 they obtained for Hii regions, which has been confirmed by more detailed analysis (Cohen et al. 2007). The values for the MASH PNe are more than a factor of 2 smaller than these selected known PNe from Acker et al. To find an explanation, firstly the MSX/radio flux ratio and PN diameters for the 21 previously known PNe, together with our 10 MASH nebulae, were compared. No trends are seen and the plotted points for the MASH PNe overlap the distribution for the sample taken from Acker et al. (1992). Then we examined the two populations to see whether the samples were comparable in angular size. The 21 PNe have a median diameter of 125′′ while the 10 MASH PNe for which we have MSX and radio detections have a median of 203′′. As reported by Parker et al. (2006), the typical MASH PN is significantly larger (and hence generally more evolved) than those previously listed in the previously known PN compilations (the average diameter of all 905 MASH PNe is 51′′ compared with 10′′ for the 1500 previously known PNe in Acker et al. (1992)).
If the PNe in the two samples are considered to remain with the same ionized fraction, but the Acker et al. nebulae were to increase their diameters by 1.67 to match those of the MASH objects, then the mass of ionized gas in those expanded nebulae would be unchanged although the electron densities would fall substantially. The beam size of the Molonglo Observatory Synthesis Telescope would still exceed the median diameter of the MASH PNe so the observed radio fluxes would be unchanged. However, the increase in diameter would diminish the far-UV radiation required to sustain the PDRs, roughly as the square of the expansion factor (see Fig. 3 of Bernard-Salas & Tielens (2005)), or a factor of 2.8. Therefore, one might expect the median MIR/radio ratio to fall by this factor as fewer UV photons would be available to pump the PAHs into MIR fluorescence. This would imply a median ratio for the typically larger MASH PNe of 12/2.8 by comparison with the smaller Acker et al. (1992) objects, or a ratio of 4.3. This is almost exactly what we observe. Consequently, unlike Hii regions, in which there is relatively little evolution in MIR/radio flux once they are past the ultra-compact phase, PN evolution is marked by a progressively diminishing MIR/radio ratio as nebulae expand, their stars cool, and their PDRs dwindle. It is not possible to probe this evolution at the level of individual PNe using the present data, but the ensemble averages provide adequate evidence of this phenomenon.
7 Optical and MIR PN morphologies
For 17 of the 58 PNe there is simply no hint of either a MIR central star nor of diffuse MIR emission associated with the H object. The remaining 41 PNe (71%) are extended IR objects with a MIR morphology that either matches or complements that in H. The most frequent type is that of a PDR in which 8.0-m emission occurs around parts of the nebular rim but is displaced to the outside of the ionized gas. In 11 of the 41 PNe two or three of the shorter IRAC bands appear to follow the distribution of H emission across the PN. In 5 of the 41 nebulae with MIR extension, all four IRAC bands trace the ionized gas. We have noted the possible presence of a candidate central star in the IRAC images for 11 of the 41 PNe.
8 Conclusions
Forty-one PNe of our sample of 58 MASH PNe observed by GLIMPSE have MIR counterparts. For many of these, it is not possible to extract meaningful quantitative spatially-integrated fluxes because of the complex structured background in the MIR.
We have shown that optically confirmed PNe exhibit IRAC colors that distinguish them from other astronomical sources in the [3.6]-[4.5] vs. [5.8]-[8.0] plane.
The ratio of integrated diffuse 8-m and radio fluxes is a discriminator between thermal and nonthermal emission regions (Cohen & Green 2001). A ratio of MIR/radio fluxes of about 25 implies thermal emission, while very small values around 0.06 indicate nonthermal processes (Cohen et al. 2007). PNe are thermal emitters and we have compared the MASH sample with the set of bright PNe for which a ratio of 12 was calculated (Cohen & Green 2001). The difference in evolutionary state between a typical MASH PN and a nebula drawn from old catalogs causes the median MIR/radio ratio for our sample of MASH PNe to be about 5. Evolved PNe are of lower density, lower UV optical depth, and have only weak or negligible PDRs, reducing the contribution of PAH emission in bands near 8 m, and hence their MIR detectability with IRAC. The recognition of this evolutionary trend in MIR properties emphasizes the importance of the MASH catalog of newly-discovered PNe.
The fraction of bipolar nebulae within our subset of 58 MASH PNe is 28%, more than twice the fraction found for the entire MASH catalog. This reflects the low scale heights and short lives of the higher-mass stars that are the progenitors of Type I PNe. These are preferentially observed by the GLIMPSE survey due to its restriction to Galactic latitudes of only 1∘. The MIR emission in Type I nebulae is likely to come from the warm dust in the associated circumstellar disks.
False-color IRAC imagery (encoding bands at 4.5, 5.8, 8.0 m as blue, green, and red, respectively) reveals MIR counterparts of PNe that are often clearly distinct from the color of their surroundings. The three types of false color found in our survey appear to differentiate between the degree of excitation of the optical nebular spectra as determined by [Nii]/H. The most frequently encountered false color is violet, which represents the weakest optical excitation. This probably corresponds most frequently to PNe that contain only H recombination lines. By combining false color MIR information with the relationship between MIR and H morphologies of PNe (i.e. whether MIR emission in IRAC bands mimics or is found outside the H distribution), one could assess the excitation of the nebula and decide whether fine-structure lines produce the emission in the IRAC bands. For example, the [Arii] and [Ariii] lines at 6.99 and 8.99 m, respectively, would contribute to IRAC’s 8.0-m band as would the 7.64-m [NeVI] in very high-excitation PNe.
The ratio of IRAC and MSX flux densities in PNe confirms that a multiplicative correction factor of 0.74 should be applied to IRAC 8.0-m diffuse emission fluxes to match the absolutely validated calibration of MSX. These MASH PNe probe the diffuse calibration on a spatial scale up to 1.3′, complementing our work on Hii regions that explored IRAC calibration up to a scale of 24′ (Cohen et al. 2007). This factor is already recommended by the Spitzer Science Center, and has been derived from knowledge of the instrument and from elliptical galaxies. We independently confirm this value for the 8.0-m correction factor on a spatial scale between slightly resolved PNe and well-resolved Hii regions.
9 Acknowledgments
MC thanks NASA for supporting this work under ADP grant NNG04GD43G with UC Berkeley. MC is also grateful for support from the School of Physics in the University of Sydney through the Denison Visitor program, and from the Distinguished Visitor program at the Australia Telescope National Facility in Marsfield. We thank the referee, Eric Lagadec, for his careful reading of our manuscript. The MOST is owned and operated by the University of Sydney, with support from the Australian Research Council and Science Foundation within the School of Physics. Support for this work, part of the Spitzer Space Telescope Legacy Science Program, was provided by NASA through contracts 1224653 (Univ. of Wisconsin, Madison), 1224988 (Space Science Institute), 1259516 (UC Berkeley), with the Jet Propulsion Laboratory, California Institute of Technology under NASA contract 1407. RI acknowledges his funding as a Spitzer Fellow. This work made use of data products from the Midcourse Space eXperiment. Processing of the data was funded by the Ballistic Missile Defense Organization with additional support from NASA’s Office of Space Science. This research has also made use of the NASA/IPAC Infrared Science Archive, which is operated by the Jet Propulsion Laboratory, California Institute of Technology, under contract with the National Aeronautics and Space Administration. This research made use of Montage, funded by the National Aeronautics and Space Administration’s Earth Science Technology Office, Computational Technnologies Project, under Cooperative Agreement Number NCC5-626 between NASA and the California Institute of Technology. This research made use of SAOImage ds9, developed by Smithsonian Astrophysical Observatory.
References
- (1) Acker A., Marcout, J., Ochsenbein, F., Stenholm, B., Tylenda, R. 1992, “Strasbourg - ESO catalogue of galactic planetary nebulae” (ESO, Garching)
- (2) Acker A., Marcout J., & Ochsenbein F., 1996, First supplement to the Strasbourg-ESO Catalogue of Galactic Planetary Nebulae, Observatoire de Strasbourg
- (3) Allen, D.A., & Glass, I.S. 1974, MNRAS, 167, 337
- (4) Becker S.A., & Iben I., 1980, ApJ, 237, 11
- (5) Benjamin, R.A. et al. 2003, PASP, 115, 953
- (6) Bernard-Salas, J., Pottasch, S.R., Feibelman, W.A., Wesselius, P.R 2002, A&A, 387, 301
- (7) Bernard-Salas, J., & Tielens, A.G.G.M 2005, A&A, 431, 523
- (8) Bock, D., Large, M., & Sadler, E. 1999, AJ, 117, 1578
- (9) Churchwell, E.B. et al. 2004, ApJS, 154, 322
- (10) Cohen, M. 1993, AJ, 105, 1860
- (11) Cohen, M. 2001, The Extragalactic Infrared Background and its Cosmological Implications, Proceedings of IAU Symposium 204, held 15-18 August 2000, at Manchester, United Kingdom. Edited by M. Harwit, 2001, p.35; Astronomical Society of the Pacific (San Francisco, USA), 1st edition (February 2001)
- (12) Cohen, M., & Barlow, M.J. 1974, ApJ, 193, 401
- (13) Cohen, M., & Barlow, M.J. 1980, ApJ, 238, 585
- (14) Cohen, M., & Barlow, M.J. 2005, MNRAS, 362, 199
- (15) Cohen, M., & Green, A. 2001, MNRAS, 325, 531
- (16) Cohen, M. et al. 1986, ApJ, 302, 737
- (17) Cohen, M. et al. 1989, ApJ, 341, 246
- (18) Cohen, M. et al. 2007, MNRAS, 374, 979
- (19) Cohen, M., & Parker, Q.A. 2003, Proc. IAU Symp. 209, “Planetary Nebulae: their Evolution and Role in the Universe”, eds. M.A. Dopita, S. Kwok & R. Sutherland, ASP Conf. Ser., p.33
- (20) Condon, J.J., Cotton, W.D., Greisen, E.W., Yin, Q.F., Perley, R.A., Taylor, G. B., & Broderick, J.J. 1998, AJ, 115, 1693
- (21) Corradi, R.L.M. 1995, MNRAS, 276, 521
- (22) Corradi, R.L.M., & Schwarz, H.E. 1995, A&A, 293, 871
- (23) Cox, P. et al. 1998, ApJ, 495, 23
- (24) Egan, M.P., Price, S.D., Kraemer, K.E., Mizuno, D.R., Carey, S.J., Wright, C.O., Engelke, C.W., Cohen, M., & Gugliotti, G.M. 2003, “The Midcourse Space Experiment Point Source Catalog Version 2.3 Explanatory Guide, AFRL-VS-TR-3004-1589
- (25) Fazio, G.G. et al. 2004, ApJS, 154, 10
- (26) Frew D.J. & Parker Q.A., 2005, in Szczerba R., Stasinska G., Gorny S., eds, AIP Conf. Proc. 804, Planetary Nebulae as Astronomical Tools, Am. Inst. Phys., New York, p. 11
- (27) Frew, D.J., Parker, Q.A., Russeil, D. 2006, MNRAS, 372, 1081
- (28) Green, A.J. 2002, Proc. IAU Symp. 199, eds. A. Pramesh Rao, G. Swarup, & Gopal-Krishna, p.259
- (29) Greig, W. E., 1967, AJ, 72, 801
- (30) Greig, W. E., 1971, A&A, 10, 161
- (31) Higgs, L.A. 1971, NRC 12129, Pub. Astrophys. Branch, Vol. 1, No.1 (NRC, Canada)
- (32) Hora, J.L., Latter, W.B., Allen, L.E., Marengo, M., Deutsch, L.K., & Pipher, J.L. 2004, ApJS, 154, 296
- (33) Hora, J.L., Latter, W.B., Smith, H.A., & Marengo, M. 2006, ApJ, 652, 426
- (34) Kennicutt R. C., Bresolin F., French H., Martin P., 2000, ApJ, 537, 589
- (35) Kingsburgh R. L., & Barlow M. J., 1994, MNRAS, 271, 257
- (36) Kohoutek, L. 2001, A&A, 378, 843
- (37) Mauch, T. et al. 2003, MNRAS, 342, 1117
- (38) Murphy, T., Mauch, T., Green A., Hunstead R. W., Kels, A. P. & Sztajer P. 2007, submitted to MNRAS
- (39) Morgan, D.H., Parker, Q.A., & Cohen, M. 2003, MNRAS, 346, 719
- (40) O’Dell, C.R., McCullough, P.R., & Meixner, M. 2004, AJ, 128, 2339
- (41) Parker, Q.A. et al. 2005, MNRAS, 362, 689
- (42) Parker, Q.A. et al. 2006, MNRAS, 373, 79
- (43) Peimbert M., 1978, in Terzian, Y., ed., IAU Symp.Vol. 76, Planetary Nebulae: Observations and Theory (D. Reidel, Dordrecht), p.215
- (44) Peimbert M., & Torres-Peimbert S., 1983, in Flower D. R., ed, IAU Symp. Vol. 103, Planetary Nebulae. Dordrecht, Reidel, p.233
- (45) Peimbert M., & Serrano A., 1980, RMxA&A, 5, 9
- (46) Pierce, M.J., Frew, D.J., Parker, Q.A., & Koeppen, J. 2004, PASA, 21, 334
- (47) Pottasch, S. R., Bernard-Salas, J., Beintema, D. A. & Feibelman, W. A. 2004, A&A, 423, 593
- (48) Price, S.D., Egan, M.P., Carey, S.J., Mizuno, D., & Kuchar, T. 2001, A&A, 121, 2819
- (49) Ratag, M. A., & Pottasch, S. R. 1991, A&AS, 91, 481
- (50) van de Steene, G. C., & Pottasch, S. R. 1995, A&A, 299, 238
- (51) Robitaille, T.P., Whitney, B.A., Indebetouw, R., Wood, K., & Denzmore, P. 2006, ApJS, 167, 256
- (52) Robitaille, T.P., Whitney, B.A., Indebetouw, R., & Wood, K. 2007, ApJS, 169, 328
- (53) Russell, R.W., Soifer, B.T., & Willner, S.P. 1977, ApJL, 217, L149
- (54) Schwarz, H.E., Corradi, R.L.M., & Stanghellini, L. 1993, Proc. IAU Symp. 155, (Kluwer Academic Publishers; Dordrecht), p.214
- (55) Smith, B.J., Struck, C., Hancock, M., Appleton, P.N., Charmandaris, V., & Reach, W.T. 2007, AJ, 133, 791
- (56) Soker, N. 2002, A&A, 386, 885
- (57) Stanghellini, L. 2000, ApSS, 272, 181
- (58) Stetson P.B. 2000, http://www.astro.wisc.edu/sirtf/daophot2.pdf
- (59) Tylenda, R., 1989, in Torres-Peimbert S., ed, IAU Symp. Vol. 131, Planetary Nebulae (Kluwer; Dordrecht), p.175
- (60) Villaver, E., Manchado, A., Garciá-Segura, G., & Stanghellini, L. 2007, Proc. IAU Symp. #234. Edited by Michael J. Barlow and Roberto H. Meńdez. Cambridge: Cambridge University Press, 2006., p.333
- (61) Wainscoat, R., Cohen, M., Volk, K.,Walker, H.J., & Schwartz, D.E. 1992, ApJS, 83, 111
- (62) Walker, H.J., Cohen, M., Volk, K., Wainscoat, R., & Schwartz, D.E. 1989, AJ, 98, 2163, 1989
- (63) Werner, M.W. et al. 2004, ApJS, 154, 1


.


| Name | PN | GLON | GLAT | RAJ2000 | DecJ2000 | Size | Morph. | SST | SST | MSX | MGPS | NVSS | Star |
|---|---|---|---|---|---|---|---|---|---|---|---|---|---|
| PHR | status | arcsec | type | col | H | ||||||||
| 18061956 | T | 10.2111 | 0.3433 | 18h06m55.3s | 19d56m18s | 6150 | Bams | n | n | n | … | n | … |
| 18071827 | P | 11.5293 | 1.0039 | 18h07m11.7s | 18d27m54s | 76 | E | n | y | y | … | n | … |
| 18131543 | T | 14.6575 | 1.0115 | 18h13m29.0s | 15d43m19s | 2721 | Eas | n | n | n | … | n | … |
| 18151457 | P | 15.5185 | 1.0342 | 18h15m06.5s | 14d57m21s | 98 | Es | n/a | y | n | … | y | … |
| 18181526 | L | 15.5378 | 0.0195 | 18h18m59.2s | 15d26m22s | 5511 | Br? | n | y | n | … | n | ..m? |
| 18241505 | T | 16.4158 | 0.9312 | 18h24m02.1s | 15d05m33s | 3018 | Bps | n | n | n | … | n | … |
| 18211353 | P | 17.2190 | 0.1272 | 18h21m43.9s | 13d53m13s | 206 | As | n | n | n | … | n | … |
| 18260953 | T | 21.2911 | 0.9803 | 18h26m26.1s | 09d53m26s | 5442 | Bs | n | n | n | … | y | … |
| 18310805 | L | 23.4401 | 0.7449 | 18h31m19.6s | 08d05m43s | 139 | Eas | y | y | n | … | n | N |
| 18340824 | T | 23.5513 | 0.1362 | 18h34m41.6s | 08d24m20s | 3126 | Ea | n | y | n | … | n | … |
| 18420539 | L | 26.8632 | 0.5529 | 18h42m17.9s | 05d39m13s | 9065 | Ias | n | y | n | … | n | … |
| 18430541 | T | 26.9222 | 0.7630 | 18h43m10.4s | 05d41m51s | 4839 | B?/Eas | n | y | n | … | n | … |
| 18440517 | P | 27.4764 | 0.9616 | 18h44m54.0s | 05d17m36s | 3126 | Es | n | n | n | … | n | … |
| 18380417 | P | 27.5860 | 1.0186 | 18h38m02.2s | 04d17m24s | 1513 | Em | y | y | n | … | n | … |
| 18440503 | T | 27.6643 | 0.8265 | 18h44m45.7s | 05d03m54s | 3512 | Bm?/Em | y | y | y | … | n | oi |
| 18440452 | L | 27.7721 | 0.6350 | 18h44m17.3s | 04d52m56s | 3838 | Rar | n | n | n | … | n | m |
| 18450343 | L | 28.8931 | 0.2907 | 18h45m06.0s | 03d43m33s | 5130 | As | y | y | n | … | n | oi? |
| 18430325 | P | 28.9519 | 0.2570 | 18h43m15.3s | 03d25m27s | 109 | Ea | y | y | y | … | y? | N |
| 18420246 | L | 29.5024 | 0.6246 | 18h42m57.1s | 02d46m01s | 2413 | Em | y | y | n | … | n | … |
| 18430232 | T | 29.8197 | 0.5073 | 18h43m56.9s | 02d32m08s | 6154 | Ear | n | y | n | … | n | … |
| 18460233 | T | 30.0485 | 0.0357 | 18h46m02.7s | 02d33m09s | 3631 | Ear | n | y | n | … | n | |
| 18470215 | T | 30.5060 | 0.2200 | 18h47m47.4s | 02d15m30s | 2014 | Bs | y | n | n | … | n | m? |
| 1856+0028 | L | 33.9770 | 0.9860 | 18h56m51.1s | +00d28m53s | 87 | Er | y | y | y | … | n | … |
| 1857+0207 | L | 35.5650 | 0.4910 | 18h57m59.5s | +02d07m07s | 1111 | Ea | y | y | y | … | y | N |
| 11506226 | L | 295.9050 | 0.4110 | 11h50m07.0s | 62d26m32s | 8977 | R | n | n | n | n | … | … |
| 11526234 | L | 296.2510 | 0.4580 | 11h52m55.7s | 62d34m10s | 2724 | R | n | n | n | n | … | … |
| 11576312 | L | 296.8490 | 0.9840 | 11h57m03.2s | 63d12m44s | 1513 | B? | y | y | y | y | … | … |
| 12066122 | T | 297.5680 | 1.0230 | 12h06m25.5s | 61d22m44s | 211 | E | y | y | n | n | … | … |
| 12186245 | L | 299.1190 | 0.1360 | 12h18m00.9s | 62d45m38s | 4231 | Es | n | y | n | … | … | … |
| 12236236 | T | 299.7780 | 0.0980 | 12h23m58.0s | 62d36m21s | 4843 | E | n | y | n | n | … | … |
| 12446231 | T | 302.1330 | 0.3510 | 12h44m28.5s | 62d31m19s | 300235 | B | n | y | n | n | … | ob |
| 12466324 | T | 302.3730 | 0.5390 | 12h46m26.5s | 63d24m28s | 3119 | B | y | y | y | y | … | oim |
| 12506346 | T | 302.7840 | 0.9080 | 12h50m04.4s | 63d46m52s | 8374 | Ea | n | y | n | n | … | ob?m |
| 12556251 | L | 303.3725 | 0.0173 | 12h55m18.0s | 62d51m04s | 18581 | B | n | y | n | n | … | oi |
| 12576216 | P | 303.6783 | 0.5923 | 12h57m51.3s | 62d16m12s | 1913 | E | y | y | n | n | … | m |
| 14086229 | T | 311.7300 | 0.9500 | 14h08m47.3s | 62d29m58s | 8246 | B | n | y | n | n | … | m |
| 14086106 | T | 312.1525 | 0.3741 | 14h08m51.7s | 61d06m27s | 307264 | Es | n | y | n | n | … | m? |
| 14296043 | P | 314.6780 | 0.1290 | 14h29m52.8s | 60d43m57s | 167131 | E | n | n | n | n | … | m |
| 14296003 | L | 314.9220 | 0.5180 | 14h29m43.9s | 60d03m17s | 141110 | Ems | n | y | n | n | … | … |
| 14375949 | T | 315.9480 | 0.3320 | 14h37m53.2s | 59d49m25s | 10363 | Ba | n | y | n | y | … | … |
| 14475838 | P | 317.5785 | 0.8845 | 14h47m41.8s | 58d38m41s | 200200 | I/Ba | n | n | n | n | … | obi |
| 14575812 | T | 318.9300 | 0.6930 | 14h57m35.8s | 58d12m09s | 3125 | A | y | y | y | y | … | N |
| 15075925 | T | 319.5050 | 1.0140 | 15h07m50.2s | 59d25m14s | 2217 | Ea | y | y | y | y | … | o |
| 15445607 | P | 325.4480 | 1.0270 | 15h44m56.7s | 56d07m07s | 1410 | E | n | n | n | n | … | … |
| 15525254 | T | 328.3570 | 0.7670 | 15h52m56.8s | 52d54m12s | 3126 | Es | y | y | y | y | … | … |
| 16105130 | P | 331.2780 | 0.0600 | 16h10m21.1s | 51d30m54s | 2011 | Es | n | n | n | n | … | m |
| 16195131 | P | 332.3493 | 0.9814 | 16h19m57.6s | 51d31m48s | 1111 | E | y | y | n | y | … | … |
| 16225038 | L | 333.2746 | 0.6547 | 16h22m40.6s | 50d38m42s | 2119 | Ear | y | y | y | n | … | … |
| 16194914 | T | 333.9279 | 0.6858 | 16h19m40.1s | 49d14m00s | 3632 | Rs | y | y | y | y | … | oiNm |
| 16194907 | T | 334.0350 | 0.7560 | 16h19m50.1s | 49d06m52s | 4847 | Ra | n | y | n | n | … | … |
| 16334650 | T | 337.3141 | 0.6361 | 16h33m58.0s | 46d50m07s | 248 | B | y | y | y | y | … | … |
| 16354654 | P | 337.4831 | 0.3524 | 16h35m51.9s | 46d54m10s | 7734 | Ia/B? | n | n | n | n | … | ob |
| 16344628 | T | 337.6825 | 0.7684 | 16h34m51.2s | 46d28m28s | 2217 | E | n | y | n | n | … | m |
| 16394516 | T | 339.0980 | 0.9880 | 16h39m22.3s | 45d16m35s | 3825 | Er | n | n | n | n | … | … |
| 16444455 | P | 339.9730 | 0.5280 | 16h44m36.2s | 44d55m23s | 3434 | E | n | y | y | n | … | m |
| 16464402 | L | 340.8600 | 0.8500 | 16h46m27.6s | 44d02m25s | 7172 | A | n | y | n | n | … | … |
| 17093931 | T | 347.0320 | 0.3500 | 17h09m10.8s | 39d31m06s | 5113 | B | n | n | n | n | … | oi |
| 17144006 | T | 347.2000 | 0.8720 | 17h14m49.3s | 40d06m09s | 2011 | B? | y | y | n | y | … | m |
| PN NAME | Status | Diam. | Morph. | [M]GPS2 | Radio | MSX8.3 | IRAC8.0 | IRAC/ | MSX/ | IRAC/ |
|---|---|---|---|---|---|---|---|---|---|---|
| PHR | arcsec | type | [N]VSS | mJy | mJy | mJy | MSX | radio | radio | |
| 18440503 | T | 20 | Bm?/Em | N | 3.2(0.9) | 43 | 78 | 1.8 | 13.0 | 24.0 |
| 18430325 | P | 9 | Ea | N | 16.0(2.0) | 210 | 210 | 1.0 | 13.0 | 13.0 |
| 1857+0207 | L | 11 | Ea | N | 78.3(2.4) | 160 | 180 | 1.1 | 2.0 | 2.3 |
| 12466324 | T | 24 | B | M | 14.3(1.4) | 120 | 140 | 1.2 | 8.2 | 10.0 |
| 14575812 | T | 28 | A | M | 79.8(2.7) | 78 | 160 | 2.1 | 1.0 | 2.0 |
| 15075925 | T | 19 | Ea | M | 24.2(1.3) | 110 | 100 | 0.9 | 5.4 | 4.8 |
| 15525254 | T | 28 | Es | M | 20.9(2.2) | 110 | 150 | 1.4 | 4.2 | 5.9 |
| 16194914 | T | 34 | Rs | M | 240.(8.0) | 1000 | 970 | 1.0 | 4.3 | 4.1 |
| 16195131 | P | 11 | E | M | 20.2(1.8) | 90 | 99 | 1.1 | 4.5 | 4.9 |
| 16334650 | T | 14 | B | M | 26.9(3.1) | 55 | 63 | 1.2 | 2.0 | 2.3 |
| 17144006 | T | 15 | B? | M | 9.7(1.3) | 31 | 27 | 2.8 | ||
| 11576312 | L | 13 | B? | M | 6.4(1.0) | 20 | 30 | 4.7 | ||
| 14375949 | T | 181 | Ba | M | 11.7(1.8) | 160 | 320 | 27.0 | ||
| 18151457 | P | 8 | Es | N | 9.2(0.6) | 26 | 16 | 1.7 | ||
| 18260953 | T | 48 | Bs | N | 8.4(0.6) | 160 | 170 | 20.0 | ||
| 16444455 | P | 34 | E | M | 5 | 150 | 150 | 1.0 | ||
| 18430541 | T | 43 | B?/Eas | N | 1.5 | 130 | 180 | 1.4 | ||
| 16225038 | L | 20 | Ear | M | 28 | 51 | 110 | 2.2 | ||
| 18420539 | L | 77 | Ias | N | 2.5 | 280 | 370 | 1.3 |
| Color | MASH | Acker et al. |
|---|---|---|
| Index | Corrected | synthesized |
| mediansem | mediansem | |
| 0.680.22 | 1.160.31 | |
| 2.120.25 | 2.370.20 | |
| 3.840.28 | 3.910.28 | |
| 1.250.16 | 1.070.28 | |
| 2.760.19 | 2.570.34 | |
| 1.660.11 | 1.620.23 |