Evidence for short-lived SN Ia progenitors
We use the VESPA algorithm and spectra from the Sloan Digital Sky Survey to investigate the star formation history of the host galaxies of 257 Type Ia supernovae. We find 5 evidence for a short-lived population of progenitors with lifetimes of less than 180 Myr, indicating a Type Ia supernova channel arising from stars in the mass range 3.5-8 . As standardizeable candles, Type Ia supernovae play an important role in determining the expansion history of the Universe, but to be useful for future cosmological surveys, the peak luminosity needs to be free of uncorrected systematic effects at the level of 1-2%. If the different progenitor routes lead to supernovae with even moderately small differences in properties, then these need to be corrected for separately, or they could lead to a systematic bias in future supernovae surveys, as the prompt route is likely to increase in importance at high redshift. VESPA analysis of hosts could be a valuable tool in this, by identifying which progenitor route is most likely.
Key Words.:
supernovae: general — galaxies: stellar content — distance scale1 Introduction
The relationship between apparent peak brightness and redshift of Type Ia supernovae (SNe Ia) depends on the cosmological model; this has provided the most direct evidence for the accelerated expansion of the Universe (Riess et al., 1998; Perlmutter et al., 1999). Current SN Ia surveys such as SNLS (Astier et al., 2006), ESSENCE (Wood-Vasey et al., 2007), and GOODS-SN (Riess et al., 2007) are contributing to current constraints on cosmological parameters, and SNe Ia will continue to be important for cosmological constraints in the next generation of surveys such as the JDEM candidates ADEPT, DESTINY (Bendford & Lauer, 2006) and SNAP (Aldering et al., 2004).
Type Ia supernovae are interpreted as the thermonuclear explosion of a white dwarf that has reached the Chandrasekhar mass and thus has become unstable, probably through accretion from a companion star (the single-degenerate scenario) or merging with another white dwarf (the double-degenerate scenario). However, no fully consistent model of a SN Ia explosion has yet been built.
The natural scatter in SNe Ia peak luminosities covers roughly one magnitude; the rms peak luminosity is 0.45 mag after excluding outliers. Empirical correlations based on light curve shape (Phillips, 1993) or intrinsic color (van den Bergh, 1995; Tripp & Branch, 1999) allow reduction of the intrinsic scatter to about 0.13 mag (Astier et al., 2006), making them usable for cosmological measurements.
However, it is not yet known how much of the residual scatter is correlated with physical parameters that could evolve with redshift, and thus bias the measurement of cosmological parameters. In order for SNe to be useful for constraining dark energy at the level expected in future SN satellite experiments, the evolution of luminosity at a given light-curve shape over the probed redshift range must be less than 1-2% (Howell et al., 2007; Sarkar et al., 2008).
There are several observational indications for a range of delay times between the birth of the progenitor system and the explosion of the SN Ia, leading some authors to envision the existence of at least two different populations of SN Ia populating slightly different regions of stretch-brightness parameter space (Sullivan et al. 2006). It is not yet known if they are described (at the percent level) by the same Phillips relation; if they correspond to different production channels there is no reason for the Phillips relations to be identical. In any case, the SN population may not be a one-dimensional family, but may depend on other parameters (at an as-yet unknown level) such as metallicity and delay time. This would result in a source of scatter in the SN Ia Hubble diagram that could be reduced with measurements of those additional parameters. Moreover, if the Phillips relations are different and the relative numbers of SNe in the two putative populations evolve with redshift, the values of cosmological parameters derived from the Hubble relation will be biased if we do not determine population-dependent corrections. More generally, any extra parameter (age, metallicity, production channel…) in the Phillips relations that is correlated with redshift will bias cosmological measurements. It is therefore essential to assess the size of such effects. Measuring them by looking for correlations between Hubble diagram residuals and intrinsic properties such as delay time, progenitor metallicity, etc. could help correct for them (at least statistically if not event-by-event) in future surveys.
The brightest supernova events only occur in actively star-forming galaxies (Hamuy et al. 1995, 1996a,b), suggesting prompt explosions, while under-luminous events are most often found in spirals and E/S0 galaxies, whose old stellar populations would suggest delayed explosions (Howell, 2001). Mannucci et al. (2006) and Scannapieco & Bildsten (2005) have proposed a two-component model for SNe Ia, and several authors (Sullivan et al., 2006; Mannucci et al., 2005) have shown that the supernova rate can be expressed as a sum of a term proportional to the total mass of the galaxy and a term proportional to the recent star formation rate. In the Mannucci et al. model, some of the supernovae would explode several Gyr after the birth of the progenitor system, while others would after a fraction of a Gyr. Moreover, those two populations have different luminosities, the “prompt” component being brighter with broader light-curves (Sullivan et al. 2006). The prompt component will dominate at higher redshifts when the Universe’s age (or the time since star formation began) was less than the lifetime of the longer-lived progenitors. Determining the relative numbers of supernovae in the two populations is the first step in understanding any possible bias these populations might cause. Given the 13% scatter in the calibrated peak luminosities of supernovae, measuring systematic effects in the Phillips relation at the percent level will take samples of a few hundred supernovae (Sarkar et al., 2008).
Hamuy et al. (2000) used 62 SN Ia host galaxies to study the impact of host morphology, magnitude and colors on the decline rate , which allows one to estimate the SN peak luminosity. They found a correlation with age but not with metallicity (see also the erratum to their paper). However, their sample was very small and most of their estimates of age and metallicity were based on photometry only, without spectra of the host galaxies, and therefore their accuracy was limited. Moreover, although they investigated various environmental effects, their methodology was not sensitive to a second parameter in the Phillips relation, since they used the decline rate as a “reddening-free and distance-free estimate of the SN peak brightness”, and thus assumed a priori the universality of the relation.
Gallagher et al. (2005) carried out a similar analysis with spectra of 57 SN Ia hosts, and put tentative constraints on the SN progenitor lifetime using an estimate of current-to-average star formation rate. They claimed to see hints of both a bimodal behavior and a lower limit of the progenitor lifetime. They admitted that their findings were rather inconclusive.
Sullivan et al. (2006) used 100 SNe from the SNLS and broadband spectral energy distributions of the host galaxies to estimate stellar masses and star formation rates. They found a component proportional to the stellar mass, and a component proportional to the recent star formation rate, averaged over the last 0.5 Gyr.
Our study improves on these earlier papers by using a larger sample of SNe, with spectra of their host galaxies from the Sloan Digital Sky Survey (SDSS; York et al. 2000). We use a sophisticated stellar population code called VESPA (Tojeiro et al., 2007) which allows us to determine the stellar formation history of the hosts. We also determine the star formation history of a large sample of normal galaxies from the SDSS as a control. Differences in those star formation histories will yield information on SN progenitor lifetime: short lifetimes for instance should statistically enrich the host sample in galaxies with recent star formation.
2 Host galaxies and reference sample
We gathered a sample of about 1300 confirmed SNe Ia from IAU circulars111http://www.cfa.harvard.edu/iau/cbat.html, the CfA supernovae list222http://cfa-www.harvard.edu/iau/lists/Supernovae.html and the SDSS-SN public list of supernovae333http://sdssdp47.fnal.gov/sdsssn/sdsssn.html. We cross-referenced this list with the SDSS DR5 (Adelman-McCarthy et al., 2007) spectroscopic survey of galaxies: 256 galaxies with spectra were identified as SN Ia hosts, corresponding to 257 supernovae (one galaxy hosted two supernovae). The list of hosts used in this paper is available online444http://sn.aubourg.net/hosts/. A large fraction of our sample comes from surveys like SDSS (104 SNe), LOSS and LOTOSS (49 SNe for the two surveys). The rest have various origins (Puckett555http://www.cometwatch.com : 17 SNe, Pollas (1994) : 12 SNe, etc.).
The detection efficiency of this sample is unknown, as it depends in detail on the way in which the SNe were found. To account for the selection function of SN Ia discovery, we also process a control sample of DR5 galaxy spectra, chosen randomly in the survey release, and weighted to reproduce the redshift distribution of the host sample — this is the parameter which could most significantly bias delay time measurements. We plan to handle these effects more accurately with a full Monte Carlo treatment in a future paper.
As a cross check, we did the same analysis, keeping only supernovae at . The reduction in the sample size (from 257 to 190) increases the error, but does not change the result (see table 2 below). Other effects will be discussed in section 4.
3 Reconstructing the star formation and metallicity history of SN host galaxies
The spectrum of a galaxy is a superposition of spectra of single stellar populations which formed at a given age with a given metallicity. Since it is not possible to recover the star formation and metallicity history with infinite precision (e.g. Jimenez et al., 2004), it is only sensible to attempt to recover the star formation and metallicity history with a certain time resolution. The VESPA algorithm (Tojeiro et al., 2007) does this, providing a detailed history only where the data warrant it. Note that broad-band colors are not sufficient to determine the star formation histories of galaxies, as they suffer from significant age-metallicity degeneracies (e.g. Jimenez et al., 2004).
In brief, VESPA uses singular value decomposition to calculate the number of significant components in the spectrum of a given galaxy. VESPA then uses an algorithm to determine the best-fitting non-negative values of the star formation fractions. Extensive tests of the performance of VESPA on synthetic spectra as a function of wavelength coverage and signal-to-noise ratio can be found in Tojeiro et al. (2007), along with a study of age-metallicity degeneracy. To limit the search to a manageable amount of parameters, and because currently available spectra never have the quality or spectral range to justify going beyond this choice, VESPA’s finest resolution consists of 16 age bins, logarithmically spaced in lookback time between 0.002 and 14 Gyrs. Specifically, the lower limit in age of the 16 bins are: 0.002, 0.02, 0.03, 0.0462, 0.074, 0.115, 0.177, 0.275, 0.425, 0.6347, 1.02, 1.57, 2.44, 3.78, 5.84, and 9.04 Gyr.
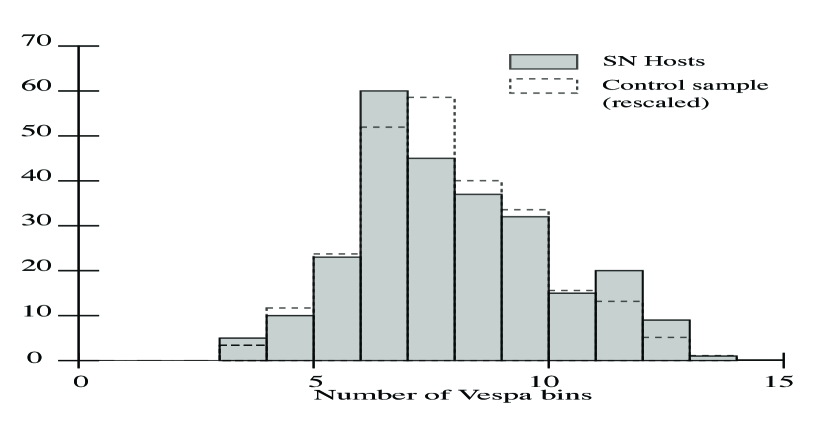
VESPA chooses the number of stellar populations to model depending on the quality of the data. The SDSS galaxy spectra typically allow between 7 and 10 age bins in both the SN host sample and the control sample, showing there are no significant differences in the two samples (Fig. 1; see also Tojeiro et al. 2007), although there is non-zero star formation in only 3-5 of those bins. The relatively large number of bins implied by Fig. 1 is an indication that in most cases the star formation which is recovered is localised to narrow time intervals. The metallicity for each population is a free parameter, so there are as many metallicity values recovered as there are star formation fractions.
Following Sullivan et al. (2006), we parametrize the total supernova rate with a two-component model, , where is the total stellar mass and is the mass formed in some time range that we can vary. and reflect, respectively, the SNR per unit stellar mass of an old population of progenitors (roughly proportional to the total stellar mass), and the SNR per unit stellar mass of a young population of progenitors (proportional to the mass in recently formed stars). Because we do not have a calibration of the selection function of the supernova surveys we have used, we normalize with our control sample, representative of the whole SDSS spectroscopic catalog (our reference sample), and can determine only up to a proportionality constant. That is, we fit the data to a model
| (1) |
where is an unnormalized proportionality constant. Thus the quantity quantifies the fraction of the supernova rate with progenitor stars that formed in the chosen time range. The constant is the product of the “slow” rate introduced in the Mannucci et al. two-component model, and an unknown global SN detection efficiency factor averaged over all SN surveys which contribute to our reference sample.
We estimate the SNR per unit stellar mass, as a function of as follows. For any unbiased sample of galaxies, the observed SNR per unit stellar mass is equal to the number of supernovae divided by the total stellar mass in the sample, multiplied by an efficiency factor : . We can divide them into bins of their star formation fraction in the recent time range, , as determined by the VESPA analysis. Within each bin we can therefore calculate , by simply counting the number of SNe in each subset and dividing it by the total stellar mass in galaxies with this value of . The latter is calculated from the much larger control sample.
We repeated this exercise for a variety of ages for the young component, and also varying the dust model details in VESPA and the bin boundaries. We find a significant contribution to the SN rate from recent stellar populations (in the sense that is significantly positive), where we vary the definition of “recent” between 74 and 180 Myr. The contribution of stars in the 180-250 Myr range is lower by at least a factor of five. The value of is robust to setting the boundary anywhere between 74 and 180 Myr, and thus here we quote the most conservative value of 180 Myr, since starburst duration and internal degeneracies in VESPA could make age bins “leak” one into another.
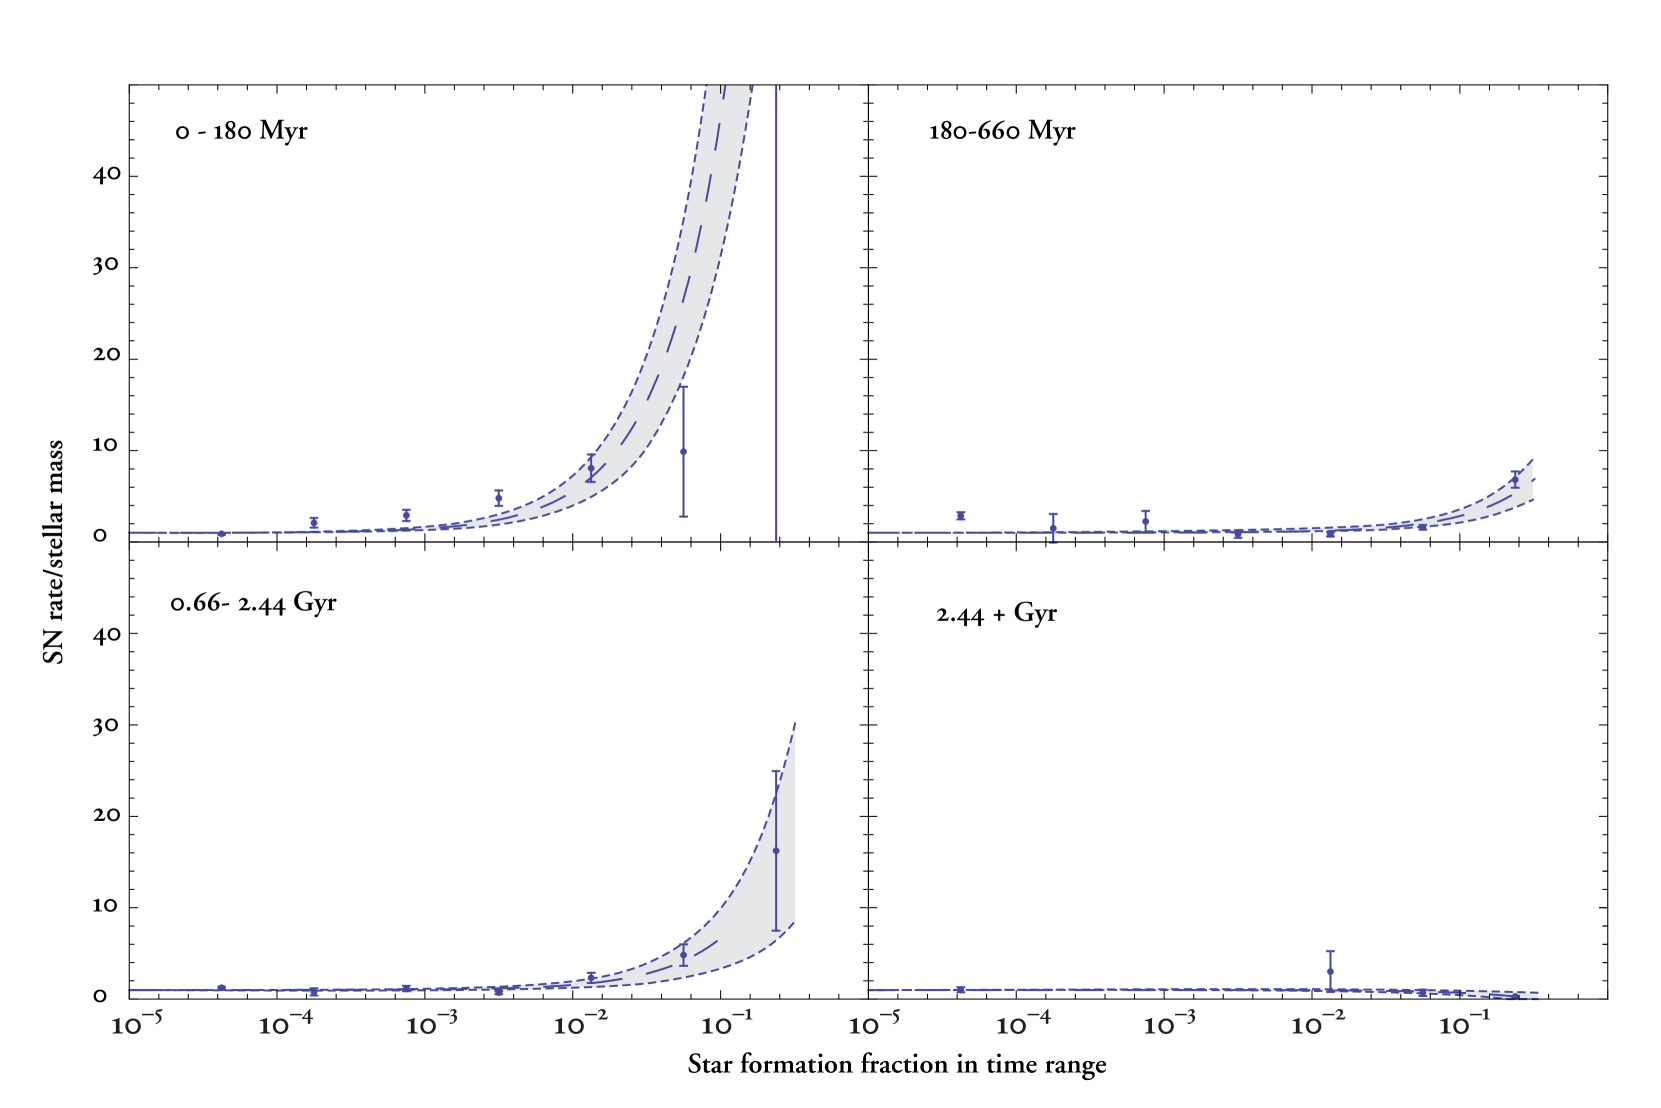
We illustrate this in Figure 2. We have divided our 16 time bins into four broader bins, and asked for the correlation of the supernova rate with the fraction of star formation that occurred in each bin. The four panels show the un-normalized Type Ia supernova rate per stellar mass as a function of the fraction of stellar mass formed each of these broad time bins [0-180] Myr (top-left panel), [180-660]Myr (bottom-left panel), [0.66-2.44] Gyr (top-right panel), and [2.44-13] Gyr (bottom-right panel). The resulting best-fit value of and the corresponding correlations are given in Table 1.
For the youngest range, 0-180 Myr, we measure , which is five-sigma evidence for a short duration component. Since in older bins is significantly lower, the positive signal we find in the most recent age range cannot be due to correlation (“leakage”) from older bins.
| Age (Myr) | Error on | Significance () | |
|---|---|---|---|
| 0-180 | 454 | 78 | 5.8 |
| 180-660 | 56 | 16 | 3.4 |
| 660-2440 | 18.4 | 3.5 | 5.2 |
| 2440-13700 | -3 | 1.0 | – |
| Age (Myr) | Error on | Significance () | |
| 0-180 | 347 | 75 | 4.6 |
| 180-660 | 43 | 20 | 2.2 |
| 660-2440 | 46 | 8 | 5.8 |
| 2440-13700 | -3 | 1.0 | – |
Our results should be robust against possible spectroscopic calibration errors: because we compare the host population to a control sample of spectra taken with the same telescope and instrument, and processed with the same spectroscopic pipeline and the same star formation history recovery algorithm (VESPA), systematic errors anywhere in the chain would be shared by the two samples.
The selection function of our SN sample is also irrelevant as long as it is not strongly dependent on host properties which are correlated with SFR; the effect of possible efficiency biases in the SN host sample will be discussed in more detail in §4 below. We do not consider supernovae without a SDSS host but this is fully consistent with our approach of comparing to a SDSS reference population : our reference sample is, by definition, complete, and we compare, among that sample, hosts without SN to hosts with SN.
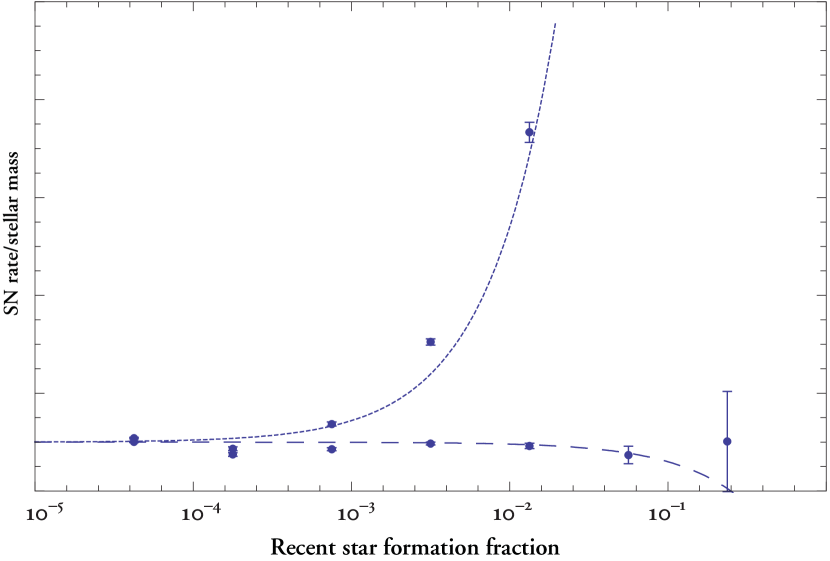
A bias will be introduced in our results if there is a correlation between galaxy mass and specific star formation rate. Indeed, most massive galaxies in the present-day universe have little star formation; most of the star formation in the present-day universe is in low-mass galaxies (Heavens et al. 2004). We have tested this bias with a Monte-Carlo simulation, as follows.
We generated an artificial SN sample in our control sample following the rule . In the absence of correlations between recent star formation and mass in this reference sample, applying our method recovers the input values. However, our reference sample has an anti-correlation between mass and recent star formation. With the input set equal to zero, we recover , compatible with zero (dashed line in Fig. 3). Using (dotted line in Fig. 3), we recover , of the simulated value (and close to our observed value). Therefore we conclude that the anti-correlation between galaxy mass and star formation rate causes us to underestimate the contribution of a prompt component to the supernova rate.
The ratio is compatible with previous estimates, for which the “recent” SFR is estimated in general from colors, broadband SED fitting, core-collapse SN rate or cosmic SFR. These results represent an average over half a gigayear, and are thus only a rough match to our results. We can roughly convert our mass estimate ( for the last 180 Myr) to recent SFR through . With this, the Neill et al. (2006) values (a “slow” rate SN and a “prompt” rate SN ) yield , the Sullivan et al. (2006) values ( SN and SN ) yield , and the two values quoted by Scannapieco & Bildsten (2005) yield and 150, respectively. However since “recent” star formation is estimated differently in each case, and on an difference recent time range, the figures are not expected to match closely.
4 Discussion and conclusion
Our result would be sensitive to any systematic effect enriching the SN host sample in blue galaxies (i.e., those with large ), for reasons unrelated to SN physics (bias in efficiency, or bias in the monitored galaxy sample for targeted searches). Some targeted supernova searches have focused on star-forming galaxies (e.g., Richmond, Filippenko, & Galisky 1998). In our sample, the main targeted search is the Lick Observatory Supernova Search (LOSS, Filippenko et al. 2001). There is no indication this search is biased in this way, and our results change insignificantly if we remove those hosts.
Blue galaxies are fainter, and one could naively expect to detect SNe more easily in those faint hosts, but with modern image differencing techniques, the effect should be minor. One also expects such a bias to occur in surveys that rely on spectroscopic typing of SNe, since the fainter, low-stretch SN, that occur preferencially in bright galaxies, will be more difficult to characterize spectroscopically. Star-forming galaxies tend to produce brighter events. On the other hand, star-forming hosts tend to be dustier, making supernovae harder to detect or characterize. If such an efficiency effect had an impact on our analysis, in the sense of enhancing or simulating what we observe, we would expect the host galaxy sample to exhibit lower typical masses than the reference sample, or lower dust content. VESPA yields an estimate of dust content and luminosity of the hosts. We see no significant difference in luminosity and dust distributions between the host and control samples. Rather, the host stellar mass distribution is shifted towards slightly higher masses, as we would expect given that the SN rate should increase with the mass. We are thus confident this effect does not significantly bias our results.
Such an efficiency effect would also be more important at high redshift. As we noted above, restricting our sample to SNe occurring at does not change our findings. In our next paper, we plan to use the lightcurve characteristics in our analyses for those objects for which they are available.
Following Mannucci et al. (2005, 2006) and Sullivan et al. (2006), we have shown that SNe Ia can occur through short-lived progenitors, hinting at a variety of stellar evolution paths with different lifetimes. We have given the first estimate of the lifetime of the “fast” component, by reconstructing the star formation history of SN host galaxies and finding an increased contribution to the SN Ia rate from stars evolving in less than 180 Myr.
Such a short time delay strongly constrains the nature of possible progenitors. They must be stars that evolve fast enough, i.e. with a mass above , but must be below the super-AGB mass threshold (about 8 ) above which one gets electron-capture supernovae (Poelarends et al., 2008). Pinsonneault & Stanek (2006) have also suggested that a significant fraction of binaries are twins (i.e., pairs of stars with essentially identical masses), and that such twin binaries could produce a short ( Gyr) path to SN Ia. Considering common envelope evolution phenomena, Pinsonneault & Stanek (2006) argue that such twin systems could yield double degenerate SNe Ia in a way that would be both fast and efficient (see also Hachisu et al. 2007).
Are there enough high-mass progenitors to account for the observed SN Ia rate? These progenitors have to have masses between (in order to explode within 180 Myr) and . Only a fraction of these stars will actually explode as a SN Ia progenitor. We take into account five factors: the fraction of stars in binaries (), the fraction of the binaries both of whose components lie in the range 3.5 to 8 (), the fraction of stars at a suitable separation for mass transfer (), the fact that every binary yields a single explosion, (), and an overall efficiency (, as not all possible progenitors may explode). Maoz (2007) has estimated the first four factors, and finds and . Crudely multiplying these factors together gives the fraction of objects in the appropriate mass range that explode as prompt SNe Ia: .
The fraction of stars which will explode as a SN Ia progenitor, is then given by where is the total number of SNe Ia from the fast route, and is the total number of stars in the correct mass range. Our result only allows us to estimate the ratio of the two components. We can however use published values of in order to infer an absolute value of from our ratio—we call this value . Using as published by Neill et al. (2006) gives . We can now estimate and , assuming a Salpeter IMF of the form . This gives , within the values given by Maoz (2007). Using a value of from Sullivan et al. (2006) gives a value of and . Similarly, as published by Scannapieco & Bildsten (2005) results in roughly and .
With the slow rate of Neill et al (2006) there is complete consistency with the theoretical expectations of SN Ia rates from Maoz (2007). However, with the higher rates of Sullivan et al (2006) or Scannapieco & Bildsten (2005), there is some tension with our results, which would require high efficiency. It is hard to know how worried one should be about this: firstly we are relying on external measurements of the delayed rate, and secondly an excess of SNIa explosions with respect to the predicted number of progenitors is observed in a large number of SNIa studies (Maoz 2007). This tension can be alleviated in a number of ways—some of which discussed in the above paper—but generally indicates that the efficiency of the mechanism which produces SNIa explosions must be high.
A crucial question for the use of SNe Ia as standard candles in cosmology is whether these different routes yield objects which are standardizeable to high accuracy via the same empirical corrections. Current data find no evidence for a difference (Hamuy et al., 2000; Sullivan et al., 2003; Bronder et al., 2008), but the requirements for using SNe Ia as a Dark Energy probe are stringent, and it will be important to establish this point accurately. VESPA should be able to assist directly with the correction, first by determining the standardization for each route at the required percent level accuracy, and then allowing to apply the correct standardization at least statistically if not for individual supernovae. Furthermore, VESPA provides metallicity estimates for the hosts, which may correlate with peak luminosity, and thus allow us to reduce the scatter in the distance indicator. This will be the subject of a future study.
We plan to expand our sample by obtaining spectra of a larger number of SN hosts, allowing us to deconvolve the delay time function. Future papers will address more quantitatively the long duration component, the downsizing bias, the metallicity effects (see also Prieto et al. 2007), and stellar evolution models compatible with our findings.
EA acknowledges the importance of numerous discussions with the late Bohdan Paczyński, to whom we dedicate this paper. RT is funded by the Fundação para a Ciência e a Tecnologia under the reference PRAXIS SFRH/BD/16973/04. RJ and DNS acknowledge support from the NSF PIRE-0530095. This work was supported in part by DOE grant DE-FG02-07ER41514.
References
- Adelman-McCarthy et al. (2007) Adelman-McCarthy, J. K. et al. 2007, ApJS, 172, 634
- Aldering et al. (2004) Aldering, G. et al. 2004, arXiv:astro-ph/0405232
- Astier et al. (2006) Astier, P., Guy, J., Regnault, N., Pain, R., Aubourg, E., et al. 2006, A&A 447, 31
- Bendford & Lauer (2006) Benford, D. & Lauer, T. 2006, SPIE, 6265, 626528
- Bronder et al. (2008) Bronder, T. J., et al. 2008, A&A 477, 717
- Filippenko et al. (2001) Filippenko, A.V., Li, W.D., Treffers, R.R., & Modjas, M. 2001, ASPC, 246, 121
- Gallagher et al. (2005) Gallagher, J. S., Garnavich, P. M., Berlind, P., Challis, P., Jha, S. & Kirshner, R. P., 2005, ApJ 634, 210.
- Guy et al. (2005) Guy, J., Astier, P., Nobili, S., Regnault, N. & Pain, R., 2005, A&A 443, 781
- Hachisu et al. (2007) Hachisu, I., Kato, M., & Nomoto, K., 2008, ApJ, 679, 1390
- Hamuy et al. (1995) Hamuy, M., Phillips, M.M., Maza, J, Suntzeff, N.B., Schommer, R. A., & Aviles, R., 1995, AJ 109, 1
- Hamuy et al. (1996a) Hamuy, M., Phillips, M. M., Suntzeff, N. B., Schommer, R. A., Maza, J., & Aviles, R. 1996a, AJ 112, 2391
- Hamuy et al. (1996b) Hamuy, M., Phillips, M. M., Suntzeff, N. B., Schommer, R. A., Maza, J., & Aviles, R. 1996b, AJ, 112, 2398
- Hamuy et al. (2000) Hamuy, M., Trager, S. C., Pinto, P. A., Phillips, M. M., Schommer, R. A., Ivanov, V. & Suntzeff, N. B., 2000, AJ 120, 1479, erratum 2001 AJ 122, 3506
- Howell (2001) Howell, D. A., 2001, ApJ 554, L193
- Howell et al. (2007) Howell, D. A., Sullivan, M., Conley, A. & Carlberg, R., 2007, ApJ, 667, L37
- Jimenez et al. (2004) Jimenez, R., MacDonald, J., Dunlop, J. S., Padoan, P., & Peacock, J. A. 2004, MNRAS, 349, 240
- Mannucci et al. (2005) Mannucci, F., Della Valle, M., Panagia, N., Cappellaro, E., Cresci, G. et al., 2005, A &A 433, 807
- Mannucci et al. (2006) Mannucci, F., Della Valle, M. & Panagia, N., 2006, MNRAS 370, 773
- Maoz (2008) Maoz, D. 2008, MNRAS 384, 267
- Neill et al. (2006) Neill, J. D., et al. 2006, AJ, 132, 1126
- Oemler & Tinsley (1979 ) Oemler, A., Jr., & Tinsley, B. M. 1979, AJ, 84, 985
- Perlmutter et al. (1999) Perlmutter, S., Aldering, G., Goldhaber, G., Knop, R. A. & Nugent, P., 1999, ApJ 517, 565
- Phillips (1993) Phillips, M., 1993, ApJ 413, L105
- Pinsonneault & Stanek (2006) Pinsonneault, M.H. & Stanek, K.Z., 2006, ApJ 639, L67
- Poelarends et al. (2008) Poelarends, A.J.T., Herwig, F., Langer, N., & Heger, A. 2008, ApJ, 675, 614
- Pollas, (1994) Pollas, C., 1994, IAU Symposium 161, 37
- Prieto et al. (2008) Prieto, J.L., Stanek, K.Z., & Beacom, J.F., 2008, ApJ 673, 999
- Richmond et al. (1998) Richmond, M.W, Filippenko, A.V., & Galisky, J. 1998, PASP, 110, 553
- Riess et al. (1998) Riess, A. G., Filippenko, A. V., Challis, P., Clocchiatti, A., Diercks, A. et al., 1998, AJ, 116, 1009
- Riess et al. (2007) Riess, A. G., Strolger, L.-G., Casertano, S., Ferguson, H. C., Mobasher, B. et al., 2007, ApJ 659, 98
- Sarkar et al. (2008) Sarkar, D., Amblard, A., Cooray, A. & Holz. D.E., arXiv:0806.3267
- Scannapieco & Bildsten (2005) Scannapieco, E., Bildsten, L., 2005, ApJ, 629, L85
- Sullivan et al. (2003) Sullivan, M., et al, 2003, MNRAS, 340, 1057
- Sullivan et al. (2006) Sullivan, M., Le Borgne, D., Pritchet, C. J., Hodsman, A. , Neill, J. D. et al., 2006, ApJ, 648, 868
- Timmes et al. (2003) Timmes, F. X., Brown, E. F., & Truran, J. W. 2003, ApJ, 590, L83
- Tojeiro et al. (2007) Tojeiro, R., Heavens, A. F., Jimenez, R., & Panter, B. 2007, MNRAS, 381, 1252
- Tripp & Branch (1999) Tripp, R. & Branch, D., 1999, ApJ 525, 209
- van den Bergh (1995) van den Bergh, S. 1995, ApJ, 453, L55
- Wood-Vasey et al. (2007) Wood-Vasey, W. M., Miknaitis, G., Stubbs, C. W., Jha, S., Riess, A. G. et al, 2007, ApJ, 666, 694
- York et al. (2000) York, D.G. et al. 2000, AJ, 120, 1579
- Zheng & Ramirez-Ruiz (2007) Zheng, Z., & Ramirez-Ruiz, E. 2007, ApJ, 665, 1220