Charm Dalitz Analyses
Abstract
A review of recent experimental results of Dalitz analyses of charmed meson decays into three-body final states is presented. These analyses can help in understanding the strong interaction dynamics leading to the observed light mesons spectrum (low mass scalar , , ). A model for the decay amplitude into such states is very important for the extraction of the angle of the CKM unitarity triangle. Implications for such measurement are discussed.
I Introduction
A meson is as a unique ”laboratory” to study light quark spectroscopy. It has a well defined spin-parity = , constraining the angular momentum of the decay products in multibody final states which can be analyzed with the Dalitz plot technique dalitz .
Investigations of the low mass scalar mesons can be pursued in three-body decays of pseudoscalar mesons giving their large coupling to such states. The nature of such low mass scalar states is still under discussion pennington , since scalar mesons are difficult to resolve experimentally because of their large decay width. There are claims for the existence of broad states close to threshold such as and e791 . On the theory side the scalar meson candidates are too numerous to fit in a single nonet and therefore alternative interpretations are proposed. For instance, or may be 4-quark states due to their proximity to the threshold q4 .
These hypotheses can be tested through an accurate measurement of branching fractions and couplings to different final states. In addition, comparison between the production of these states in decays of differently flavored charmed mesons , and chconj can yield new information on their possible quark composition. Another benefit of studying charm decays is that, in some cases, partial wave analyses are able to isolate the scalar contribution almost background free.
Results of Dalitz analyses can be an input for extracting the -violating phase of the quark mixing matrix by exploiting interference structure in the Dalitz plot from the decay abi . Modeling of the and S-wave in decays is therefore an important element in such measurement, since the systematic uncertainty on due to the Dalitz model is dominated by such components babar-kspp . Model independent approaches using special Dalitz charm analyses are discussed and a projected systematic error on in future experiments evaluated.
II Dalitz analysis formalism
The amplitudes describing meson weak-decays into three-body final states are dominated by intermediate resonances that lead to highly non-uniform intensity distributions in the available phase space.
Neglecting violation in meson decays, we define the ( ) decay amplitude () in a Dalitz plot, as:
| (1) | |||
| (2) |
The complex quantum mechanical amplitude is a coherent sum of all relevant quasi-two-body resonances (”isobar model” isobar ), . Here , and is the resonance amplitude. The coefficients and are usually obtained from a likelihood fit. The probability density function for the signal events is . Sub-modes branching fractions (”fit fractions”) are defined as
The fractions do not necessarily add up to 1 because of interference effects among the amplitudes.
For well established resonances of the spin-1 (P-wave) and spin-2 states, the Breit-Wigner amplitude is used
| (3) | |||||
| (4) |
where () is the resonance mass (width) pdg ,
is the angular momentum quantum number, is the momentum of either
daughter in the resonance rest frame, and is the value of when s =
. The function is the Blatt-Weisskopf barrier
factor bw : = 1, =
, and =
, where we take the meson radial parameter is usually set to
1.5 GeV-1 valR . The spin part of the amplitude,
, is defined as: = , =
-2 , and = [
]
, where is the nominal mass, and
is the 3-momentum of particle in the resonance rest frame.
The parameterization of the scalar resonance, whose mass, , is close to the production threshold, uses the Flatté Flatte formula
| (5) |
where and are the coupling constants of the resonance to the and final states, and is a phase space factor, calculated for the decay products momentum, , in the resonance rest frame. A similar formula is used for the scalar resonance.
Different models for the low mass S wave, (called or ) are used. In e791 a simple spin-0 Breit-Wigner is tried. Alternatively a complex pole amplitude proposed in Ref. Oller_2005 can be used
| (6) |
where GeV is a pole position in the complex plane estimated from the results of several experiments.
More comprehensive parameterizations of the low mass S wave has been proposed and tested Schechter_2005 Achasov_D3pi . A K-matrix approach ref:Kmatrix ; ref:aitchison , which gives a description of S wave resonances treating the and contributions in a unified way has been used giving comparable results to the isobar technique FOCUS_Dp-pipipi .
III S-wave.
III.1 CLEO-c
A study of charged decay to three charged pions has been carried out with the CLEO detector cleoc-Dp3pi . This mode has been studied previously by E687 E687_Dp-pipipi , E691 E691_Dp-pipipi , E791 e791 , and FOCUS FOCUS_Dp-pipipi .
E791 uses the isobar technique, where each resonant contribution to the Dalitz plot is modeled as a Breit-Wigner amplitude with a complex phase. This works well for narrow, well separated resonances, but when the resonances are wide and start to overlap, solutions become ambiguous, and unitarity is violated. In contrast, FOCUS uses the K-matrix approach. The two techniques give a good description of the observed Dalitz plots and agree about the overall contributions of the resonances. Both experiments see that about half of the fit fraction for this decay is explained by a low mass S wave.
The CLEO analysis utilizes 281 pb-1 of data collected on the resonance at 3773 MeV at the Cornell Electron Storage Ring, corresponding to a production of about pairs. mesons are produced close to the threshold, and are thus almost at rest. Events from the decay , which has a large rate and contributes to the same final state, are isolated with the invariant mass even without clearly detached vertexes as in the fixed target experiments.
An isobar model is used to parametrize the signal decay where the description of the from Ref. Oller_2005 and the Flatté parameterization for the threshold effects on the Flatte are included. Alternative models are also tried and give comparably good fit results Schechter_2005 Achasov_D3pi .
The decay tracks are selected with requirements on their impact parameters with respect to the beam spot. This removes 60% of events with decays. The remaining events from represent about one third of those selected for the Dalitz plot. Selection of events from the decay is done with two signal variables: and , where is a beam energy, and and are the energy and momentum of the reconstructed meson candidate, respectively. This gives 6991 events in the signal box, 215918 of these estimated to be background.
The presence of two mesons impose a Bose-symmetry of the final state. The Bose-symmetry when interchanging the two same sign charged pions is explicitly accounted for in the amplitude parameterization. Dalitz plot is analyzed by choosing and as the independent (,) variables. The third variable is dependent on and through the energy-momentum balance equation.
In the Dalitz plot analysis events in the band (GeV/)2 are excluded which is approximately ten times our mass resolution. This leaves for the Dalitz plot analysis 4086 events 2600 of which are signal events.
CLEOc was able to reproduce the fit results E791 e791 . The amplitude normalization and sign conventions are different from E791, in particular the inclusion of a contribution gives a fit probability of . Possible contributions form all known resonances listed in Ref. PDG_2004 were tried, including high mass resonances giving asymptotic “tails” at the edge of the kinematically allowed region.
For the the Flatté formula, Eq. II, is used with parameters taken from the recent BES II measurement BES_2005 . For the a complex pole amplitude, Eq. 6, was eventually tried rather than the spin-0 Breit-Wigner.
| Mode | Amplitude (a.u.) | Phase (∘) | Fit fraction (%) |
|---|---|---|---|
| 1(fixed) | 0(fixed) | 20.02.30.9 | |
| 1.40.20.2 | 12105 | 4.10.90.3 | |
| 2.10.20.1 | –12363 | 18.22.60.7 | |
| 1.30.40.2 | –211514 | 2.61.80.6 | |
| 1.10.30.2 | –441316 | 3.41.00.8 | |
| pole | 3.70.30.2 | –342 | 41.81.42.5 |
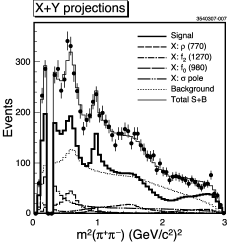
Table 1 shows the list of surviving contributions with their fitted amplitudes and phases, and calculated fit fractions after a procedure of addition and removal of resonances to improve the consistency between the model and data. The sum of all fit fractions is 90.1%, and the fit probability is 28% for 90 degrees of freedom. The two projections of the Dalitz plot and selected fit components are shown in Fig. 1
For contributions that are not significant upper limits at the 95% confidence level are set.
The systematic uncertainties, shown in Table 1, are estimated from numerous fit variations, by adding or removing degrees of freedom, changing the event selection, and varying the efficiency and background parameterizations.
For the poorly established resonances as the pole, their parameters are allowed to float and the variations of the other fit parameters contribute to the systematic errors. The fitted values for the pole are (MeV/) = 46618 and (MeV/) = –22328.
 |
 |
III.2 BaBar
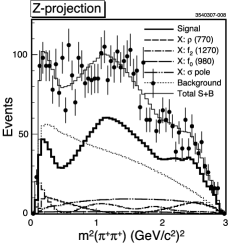
BaBar analyzed 240 fb-1 taken at the center of mass energies near the resonance. Events are selected in a sample of events having at least three reconstructed charged tracks with two well identified kaons and one pion. The three tracks are fit to a common vertex with the constraint they come from the beamspot. The decay chain helps in discriminating signal from combinatorial background. Additional requirements based on kinematic and geometric information are combined to further suppress the background. The final sample contains 100850 events with a purity of 95%. An unbinned maximum likelihood fit of the Dalitz plot (Fig.2) is performed to extract the relative amplitudes and phases of the intermediate resonances as shown in Tab. 2. The decay is dominated by the and . The is parametrized with a coupled channel Breit-Wigner BES_2005 and its contribution is large but it is subject to a large systematic error due to the poor knowledge of its parameters and possible contributions that are difficult to disentangle in the projection. Analysis of the angular moment distribution confirms such picture with a big S-wave–P-wave interference in the channel in the region of the . On the other hand very small activity is present in the region suggesting a small S-wave, and therefore no evidence of a .
| Mode | Amplitude (a.u.) | Phase (∘) | Fit fraction (%) |
|---|---|---|---|
| (fixed) | (fixed) | ||
| Sum |
III.3 BaBar
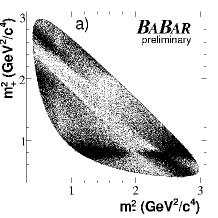
The data sample used in the BaBar analysis consists of 91.5 recorded with the BABAR detector at the SLAC PEP-II storage rings babar-Dkkk0 . The PEP-II facility operates nominally at the resonance, providing collisions of 9.0 electrons on 3.1 positrons. The data set includes 82 collected in this configuration (on-resonance) and 9.6 collected at a c.m. energy 40 MeV below the resonance (off-resonance).
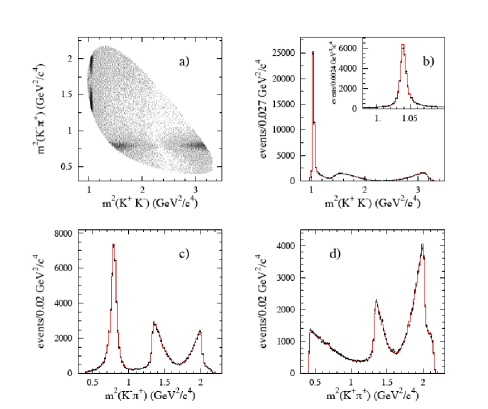
Selecting events within of the fitted mass value, a signal fraction of 97.3% is obtained for the 12540 events selected. The Dalitz plot for these candidates is shown in Fig. 3.
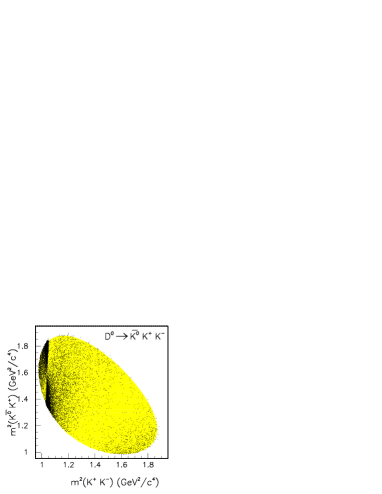
In the threshold region, a strong signal is observed, together with a rather broad structure. A large asymmetry with respect to the axis can also be seen in the vicinity of the signal, which is most probably the result of interference between and -wave amplitude contributions to the system. The and -wave resonances are, in fact, just below the threshold, and might be expected to contribute in the vicinity of . An accumulation of events due to a charged can be observed on the lower right edge of the Dalitz plot. This contribution, however, does not overlap with the region and this allows the scalar and vector components to be separated using a partial wave analysis in the low mass region.
The helicity angle, , is then defined as the angle between the for (or for ) in the rest frame and the direction in the (or ) rest frame. The mass distribution has been modified by weighting each candidate by the spherical harmonic (L=0-4) divided by its (Dalitz-plot-dependent) fitted efficiency. It is found that all the moments are small or consistent with zero, except for , and .
In order to interpret these distributions a simple partial wave analysis has been performed, involving only - and -wave amplitudes. This results in the following set of equations chung :
where and are proportional to the size of the - and -wave contributions and is their relative phase. Under these assumptions, the moment is proportional to so that it is natural that the appears free of background, as is observed. This distribution has been fit using the following relativistic -wave Breit-Wigner, yielding the following parameters:
= 1019.63 0.07, = 4.28 0.13 MeV/
in agreement with PDG values (statistical errors only).
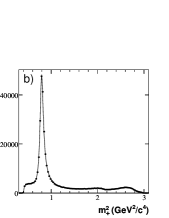
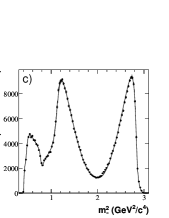
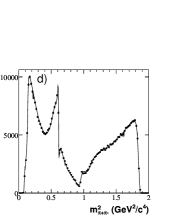
The above system of equations can be solved directly for , and and corrected for phase space distribution. The phase space corrected spectra are shown in Fig. 4.
The distributions have been fitted using a model with for the P-wave , a scalar contribution in the mass projection entirely due to the , mass distribution is entirely due to and the described with BW models.
The scalar resonance has a mass very close to the threshold and decays mostly to . It has been described by a coupled channel Breit Wigner of the form:
where while and describe the couplings to the and systems respectively.
The best measurements of the parameters come from the Crystal Barrel experiment cbar , in annihilations, with a value of (MeV)1/2. and have been fixed to the Crystal Barrel measurements, but , on the other hand, has been fit (stat only) = 464 29 (MeV)
The determination of has been redone in a complete Dalitz plot analysis with an evaluation of the systematic error. The fit produces a reasonable representation of the data for all of the projections. The computed on the Dalitz plot gives a value of =983/774. The sum of the fractions is %. The regions of higher are distributed rather uniformly on the Dalitz plot. Attempts to improve the fit quality by including other scalar amplitudes caused the fit to diverge, producing a sum of fractions well above 200% along with small improvements of the fit quality.
The final fit results showing fractions, amplitudes and phases are summarised in Table 3. For and (DCS), being consistent with zero, only the fractions have been tabulated. For the Dalitz plot analysis the contribution is found to be consistent with zero,
| Final state | Amplitude | Phase (radians) | Fraction (%) |
|---|---|---|---|
| 1. | 0. | 66.4 1.6 7.0 | |
| 0.437 0.006 0.060 | 1.91 0.02 0.10 | 45.9 0.7 0.7 | |
| 0.460 0.017 0.056 | 3.59 0.05 0.20 | 13.4 1.1 3.7 | |
| 0.435 0.033 0.162 | -2.63 0.10 0 .71 | 3.8 0.7 2.3 | |
| 0.4 0.2 0.8 | |||
| 0.8 0.3 0.8 | |||
| Sum | 130.7 2.2 8.4 |
A test has been performed by leaving as a free parameter in the Dalitz plot analysis, the resulting central value of being
This value differs significantly from the Crystal Barrel measurement. An improvement of this measurement can be foreseen by adding data from the decay mode such as .
It must be noticed that reliable estimate of the expected contribution of the in decay is not possible until more accurate measurements of the parameters and couplings become available. This can be performed, for example, by using high statistics samples of and decays.

IV S-wave
The systems from the decay can provide information on the S-wave (spin-0) amplitude in the mass range 0.6–1.4 , and hence on the possible existence of the , reported to date only in the neutral state () e791 . If the has isospin , it should be observable also in the charged states.
IV.1 BaBar
 |
 |
 |
 |
| State | Amplitude, | Phase, (∘) | Fraction, (%) |
|---|---|---|---|
| 1.0 (fixed) | 0.0 (fixed) | 45.20.80.6 | |
| 2.290.370.20 | 86.712.09.6 | 3.71.11.1 | |
| 1.760.360.18 | -179.821.312.3 | 16.33.42.1 | |
| 0.690.010.02 | -20.713.69.3 | 19.30.60.4 | |
| 0.510.070.04 | -177.513.78.6 | 6.71.41.2 | |
| [0.480.080.04] | [-154.014.18.6] | [6.01.81.2] | |
| 1.110.380.28 | -18.719.313.6 | 0.080.040.05 | |
| 0.6010.0110.011 | -37.01.92.2 | 16.00.80.6 | |
| 2.630.510.47 | -172.06.66.2 | 4.81.81.2 | |
| 0.700.270.24 | 133.222.525.2 | 2.71.40.8 |
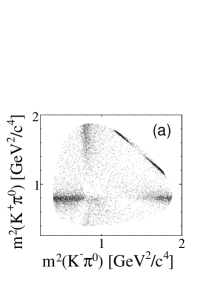
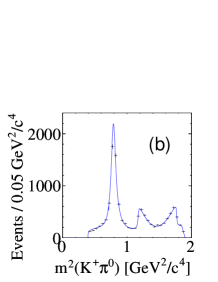
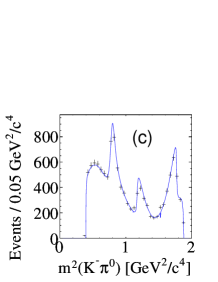
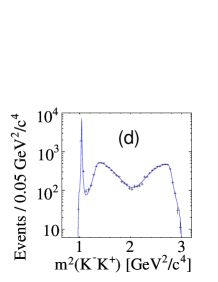
BaBar analyzed 385 fb-1 of collision data and reconstructed the decays with babar-kkpi0 . Requirements on the center-of-mass momentum of the candidate and on yields in the signal region, signal events with a purity of about 98.1%.
For decays to S-wave states, three amplitude models have been considered. One model uses the LASS amplitude for elastic scattering LASS ,
| (7) | |||
| (8) |
where () refers to the mass (width), GeV, and GeV. The unitary nature of Eq. 7 provides a good description of the amplitude up to 1.45 (i.e., threshold). In Eq. 8, the first term is a non-resonant contribution defined by a scattering length and an effective range , and the second term represents the resonance. The phase space factor converts the scattering amplitude to the invariant amplitude.
A second model uses the E791 results for the S-wave
amplitude from an energy-independent partial wave analysis in the
decay brian . The third model uses a coherent
sum of a uniform non-resonant term, and Breit-Wigner terms for the
and resonances.
The decay to a S-wave state is described by a coupled-channel Breit-Wigner amplitude for the and resonances, with their respective couplings to , and , final states Flatte ,
| (9) |
Several models are used incorporating various combinations of intermediate states. In each fit, the is included and the complex amplitude coefficients of other states relative to it is measured.
The LASS S-wave amplitude gives the best agreement with data and it is uses it in the nominal fits. The S-wave modeled by the combination of (with parameters taken from Ref. kappa ), a non-resonant term and has a smaller fit probability ( probability 5%). The best fit with this model ( probability 13%) yields a charged of mass (870 30) , and width (150 20) , significantly different from those reported in Ref. kappa for the neutral state. This does not support the hypothesis that production of a charged, scalar is being observed. The E791 amplitude brian describes the data well, except near threshold ( probability 23%). Analysis of moments of confirms little variation in S-wave phase up to about 1.02-1.03 GeV/c2 and matched the behaviour obtained with the isobar model.
The results of the best fit are summarized in Table 4. Neglecting violation, the strong phase difference, , between the and decays to state and their amplitude ratio, , are given by
| (10) |
Combining the results of models I and II, we find =
(stat) (syst) and = 0.599
0.013 (stat) 0.011 (syst). These results are consistent with the
previous measurements cleo , = (stat)
(syst) and = 0.52 0.05 (stat) 0.04 (syst).
The measurement of and is a prerequisite to extract the CKM angle from the analysis of decays ref:GLWADS , where the symbol indicates either a or a meson decaying into a CP-eigenstate as or as we will see in more detail in the next Section.
V Dalitz model and CKM extraction
| Component | Fit fraction (%) | ||
|---|---|---|---|
| 1 (fixed) | 0 (fixed) | ||
| sum of S-wave |
Assuming no asymmetry in decays the , , decay chain rate can be written as
| (11) | |||
where and are the squared invariant masses of the and combinations respectively from the decay, and , with () the amplitude of the () decay. In Eq. (11) the following definitions are used, and . Here, is the magnitude of the ratio of the amplitudes and and is their relative strong phase.
 |
 |
 |
 |
Once the decay amplitude is known, the Dalitz plot distributions for from and decays can be simultaneously fitted to and as given by Eq. (11), respectively, and the angle can be extracted.
Since the measurement of arises from the interference term in Eq. (11), the uncertainty in the knowledge of the complex form of can lead to a systematic uncertainty.
Two different models describing the decay have been used in this analysis. The first model (also referred to as Breit-Wigner model) ref:cleomodel expresses as a sum of two-body decay-matrix elements and a non-resonant contribution. In the second model (hereafter referred to as the S-wave K-matrix model) the treatment of the S-wave states in uses a K-matrix formalism ref:Kmatrix ; ref:aitchison to account for the non-trivial dynamics due to the presence of broad and overlapping resonances. The two models have been obtained using a high statistics flavor tagged sample () selected from events recorded by BaBar.
In the Breit-Wigner model a set of several two-body amplitudes is used, including five Cabibbo-allowed amplitudes: , , , and , their doubly Cabibbo-suppressed partners, and eight channels with a and a resonance: , , , , , , and . The Breit–Wigner masses and widths of the scalars and are left unconstrained, while the parameters of the other resonances are taken to be the same as in ref:cleomodel . The parameters of the resonances obtained in the fit are as follows: MeV/, MeV/, MeV/ and MeV/ (the errors are statistical only). The alternative model is based on a fit to scattering data (K-matrix ref:AS ) used to parametrize the S-wave component. This variation is used to estimate the model systematic uncertainty on since it gives an equally good fit to data.
The error due to the resonance model can be avoided by using the model-independent measurement proposed in abi . In this approach, the Dalitz plot is partitioned in bins symmetric with respect to the axis. Counting the number of events in such bins from entangled decay samples, in addition to the already utilized flavour-tagged decay samples, can determine the strong phase variation over the Dalitz plot. For this the data of a -charm factory is needed. Useful samples consist of events where one of the mesons decays into a eigenstate (such as or ), while the meson going in the opposite direction decays into . Using also a similar sample where both mesons from the decay into the state provides enough information to measure all the needed hadronic parameters in decay up to one overall discrete ambiguity (this can be resolved using a Breit-Wigner model). CLEO-c showed that with the current integrated luminosity of 280 pb-1 at the resonance, these samples are already available.
With the luminosity of 750 pb-1, that CLEO-c should get at the end of its operation, the samples will be respectively about and events. Using these two samples with a binned analysis and assuming , a precision on could be obtained Bondar:2005ki ; Bondar:2007ir .
VI Conclusions.
Charm meson multi-body decays are crucial to determine light strong interaction bound states. The nature of such mesons is still unclear, but more information is emerging from high statistics Dalitz analysis of decays. In the future multi-channles analyses may be the way to go to identify underline structure of the light mesons. For instance a measurement of the couplings of the S-wave in various decays can help in interpreting the as two di-quark bound states multiquark . Determining the decay dynamic of charm mesons is relevant for method to extract the CKM angle in B decays as . The effect of the knowledge of the strong phase variation in charm meson decay translates into a model systematic error on the value. Model dependence can be removed if special sample of D meson charm decays in quantum-coherent states will be available, bringing down the model error on to few degrees.
Acknowledgements.
The author warmly thanks the organizers for the great conference in such a beautiful venue. This work has been supported by the Istituto Nazionale di Fisica Nucleare (INFN), Italy.References
- (1) R.H. Dalitz, Philos. Mag. 44, 1068 (1953).
- (2) J.L. Rosner, Phys. Rev. D74, 076006 (2006); M.R. Pennington, Int. J. Mod. Phys. D21, 5503 (2006); D. V. Bugg, Phys. Lett. B632, 471 (2006).
- (3) E.M. Aitala et al.(E791 Collaboration), Phys. Rev. Lett. 89, 121201 (2002); E.M. Aitala et. al (E791 Collaboration), Phys. Rev. Lett. 86, 770 (2001).
- (4) F. E. Close and N. A. Tornqvist, J. Phys. G28, R249 (2002).
- (5) Charge conjugation is always implied throughout the paper.
- (6) A. Giri, Y. Grossman, A. Soffer, and J. Zupan, Phys. Rev. D68, 054018 (2003).
- (7) B.Aubert et al. (BaBar Collaboration), hep-ex/0507101.
- (8) S.J. Lindenbaum and R.M. Sternheimer, Phys. Rev. 105, 1874 (1957); M.G. Olsson and G.V. Yodh, Phys. Rev. 145, 1309 (1966); D.J. Herndon, P. Söding, and R.J. Cashmore, Phys. Rev. D11, 3165 (1975).
- (9) W. -M. Yao et al. (PDG), J. Phys. , 1 (2006).
- (10) J.M. Blatt and W.F. Weisskopf, Theoretical Nuclear Physics, John Wiley & Sons, New York, 1952.
- (11) H. Albrecht et al. (ARGUS), Phys. Lett. B308, 435 (1993).
- (12) S.M. Flatté, Phys. Lett. B38, 232 (1972); S.M. Flatté, CERN/EP/PHYS 76-8, 15 April 1976; S.M. Flatté Phys. Lett. B.63, 224 (1976).
- (13) J.A. Oller, Phys. Rev. D 71, 054030 (2005).
- (14) J. Schechter, Int.J.Mod.Phys. A20, 6149 (2005).
- (15) N.N. Achasov and G.N. Shestakov, Phys. Rev. D 67, 114018 (2003); N.N. Achasov and G.N. Shestakov, Yad. Fiz. 32, 1098 (1980) [Sov. J. Nucl. Phys. 32, 566 (1980)]; N.N. Achasov and A.A. Kozhevnikov, Phys. Rev. D 55, 2663 (1997); N.N. Achasov and V.V. Gubin, Phys. Rev. D 56, 4084 (1997); Yad. Fiz. 61, 274 (1998) [Phys. Atom. Nucl. D 61, 224 (1998)]; N.N. Achasov and A.V. Kiselev, Phys. Rev. D 70, 111901(R) (2004); N.N. Achasov and G.N. Shestakov, Phys. Rev. D 67, 114018 (2003); N.N. Achasov and A.V. Kiselev, Phys. Rev. D 73, 054029 (2006).
- (16) E. P. Wigner, Phys. Rev. 70 (1946) 15; S. U. Chung et al., Ann. Physik 4 (1995) 404.
- (17) I. J. R. Aitchison, Nucl. Phys. A189, 417 (1972).
- (18) J.M. Link et al. (FOCUS Collaboration), Phys. Lett. B 585, 200 (2004).
- (19) G.Bonvicini et al. (CLEO Collaboration), Phys. Rev. D 76, 012001 (2007).
- (20) P.L. Frabetti et al. (E687 Collaboration), Phys. Lett. B 407, 79 (1997).
- (21) J.C. Anjos et al. (E691 Collaboration), Phys. Rev. Lett. 62, 125 (1989).
- (22) L. Alvarez-Gaumé et al., Phys. Lett. B592, 1 (2004).
- (23) M. Ablikim et al. (BES Collaboration), Phys. Lett. B 607, 243 (2005).
- (24) B.Aubert et al. (BaBar Collaboration), Phys. Rev. D 72, 052008 (2005).
- (25) S.U. Chung, Phys. Rev. D56, 7299 (1997).
- (26) A. Abele et al., Phys. Rev. D57, 3860 (1998).
- (27) B.Aubert et al. (BaBar Collaboration), submitted to Phys. Rev. D.
- (28) D. Aston et al. (LASS), Nucl. Phys. B296, 493 (1988); W.M. Dunwoodie, private communication.
- (29) E.M. Aitala et al. (E791 Collaboration), Phys. Rev. Lett. 89, 121801 (2002).
- (30) E.M. Aitala et al. (E791 Collaboration), Phys. Rev. D73, 032004 (2006); B.T. Meadows, private communication.
- (31) C. Cawlfield et al. (CLEO), Phys. Rev. D74, 031108 (2006).
- (32) I. Dunietz, Phys. Lett. B 270, 75 (1991); I. Dunietz, Z. Phys. C56, 129 (1992); D. Atwood, G. Eilam, M. Gronau and A. Soni, Phys. Lett. B 341, 372 (1995); D. Atwood, I. Dunietz and A. Soni, Phys. Rev. Lett. 78, 3257 (1997).
- (33) CLEO Collaboration, S. Kopp et al., Phys. Rev. D 63, 092001 (2001); CLEO Collaboration, H. Muramatsu et al., Phys. Rev. Lett. 89, 251802 (2002); Erratum-ibid: 90 059901 (2003).
- (34) V. V. Anisovich and A. V. Sarantev, Eur. Phys. Jour. A 16, 229 (2003).
- (35) A. Bondar and A. Poluektov, Eur. Phys. J. C 47, 347 (2006) [arXiv:hep-ph/0510246].
- (36) A. Bondar and A. Poluektov, arXiv:hep-ph/0703267.
- (37) L. Maiani, A. D. Polosa and V. Riquer, arXiv:hep-ph/0703272.