Delayed Correlations in Inter-Domain Network Traffic
Abstract
To observe the evolution of network traffic correlations we analyze the eigenvalue spectra and eigenvectors statistics of delayed correlation matrices of network traffic counts time series. Delayed correlation matrix is composed of the correlations between one variable in the multivariable time series and another at a time delay . We determined, that inverse participation ratio (IPR) of eigenvectors of deviates substantially from that of eigenvectors of the equal time correlation matrix. The largest eigenvalue of and the corresponding IPR oscillate with two characteristic periods of and . Found delayed correlations between network time series fits well into the long range dependence (LRD) property of the network traffic.
Injecting the random traffic counts between non-randomly correlated time series, we were able to break the picture of periodicity of . In addition, we investigated influence of the periodic injections on both largest eigenvalue and the IPR, and addressed relevance of these indicators for the LRD and self-similarity of the network traffic.
Index Terms:
Network-Wide Traffic Analysis, Random Correlations, Time-Lagged Correlations, Long Range DependenceDepartment of Computer Engineering and Computer Science, University of Louisville, Louisville, KY 40292 email: {vbrozh01, mmkant01}@louisville.edu
Categories and Subject Descriptors
C.2.3 [Computer-Communication Networks]: Network Operations
General Terms
Measurement, Experimentation
I introduction
The cross-correlation matrix is one of the tools of time series analysis, used in studies of the underlying interactions between network structural constituents. The network traffic system is often seen as a collection of times series with traffic bytes per time interval or number of packets per time interval at a single link. Within this collection, temporal correlations between network structural constituents and consequently patterns of collective behavior might be present.
To study such patterns one can employ the equal-time cross-correlation matrix of traffic time series at all network links (see, for example [1, 2]). Further statistical description of the awareness is commonly done via eigen-decomposition of cross-correlation matrix. Detailed studies showed that the major portion of eigenvalues of cross-correlation matrix fall into the theoretically predicted boundaries of eigenvalues spectrum of random matrices [1, 2]. This portion satisfies the so called universal properties described by the random matrix theory (RMT) [4]. It also recognizes the uncongested state of the traffic, where each router is able to communicate with any other router and with each subnet under its service. The part of the spectrum deviating from the RMT boundaries represents stable in time non-random correlations between network traffic time series [1, 2].
Even though, such distinction provides a valuable insight into the meaning of empirical data, the equal-time cross-correlation matrix on its own may not be sufficient for understanding of the effect of inter-domain correlations at different times. In fact, the analysis of correlation as a function of time lags has already been used in econometric time series systems. For example, the analysis of stock returns portfolio showed the asymmetric lead-lag relationship between stock returns; high-volume stocks lead the low-volume stocks [7, 8]. This finding is attributed to information adjustment asymmetry [6]. The uncongested balanced state of the network traffic implies the "symmetric" information/traffic flow exchange. Thus, to control the congestion level of network traffic systems, it is crucial to recognize the collective behavior or correlation patterns between network traffic time series, and to observe their evolution in time.
In order to trace the evolution of correlation pattern between traffic time series the equal-time cross-correlation matrix is replaced with time-lagged correlation matrix [3]. The obtained matrix of delayed correlations can be subjected to eigen-analysis just like its equal-time counterpart. In contrast to equal-time correlation matrices which have a real eigenvalue spectrum, the spectrum of is complex since matrices of these types are asymmetric. While the general properties of complex spectrum of is unknown so far, results of symmetrized version of lagged correlation matrices have been reported recently [3, 5].
In this paper, we concentrated on time-lagged correlations between time series generated by Simple Network Manage Protocol (SNMP) traffic counters of University of Louisville backbone routers system. We established that time-lagged correlations between traffic time series sustain for up to , where sec. Moreover, the largest and smallest eigenvalues and of and the inverse participation ratio (IPR) of the eigenvector corresponding to were found to oscillate with two characteristic periods of and .
In addition, within the content of the eigenvector corresponding to we determined the index of a single time series which is driving the oscillation. The IPR of all eigenvectors of shows the single time series contributor in the eigenvector which at the equal-time correlations belonged to the random part of the spectrum. Since the theoretical prediction for the spectrum of time-lagged correlation matrices is unknown, we keep the terminology of the spectrum derived from eigen-decomposition of equal-time correlation matrices. Thus, random in our text refers to the part of the spectrum within the boundaries predicted by the RMT for equal-time correlation matrix. Non-random denotes the part of the spectrum outside of the RMT predictions.
Finally, we found that the injection of random traffic counts between time series which interact non-randomly destroys the oscillatory picture of and and that of the corresponding IPRs. Meanwhile, the injection of traffic counts with smooth (periodic) time dependence between randomly interacting traffic time series with respect to characteristic periods of , and IPR reveals new periodicity (of ). The findings of eigenvalue spectrum analysis and experimental results suggest the asymmetric long lasting relationship between traffic time series.
Network traffic analysis had undergone the evolution from considering the network traffic time series as an outcome of Poisson and memory-less processes to recognizing the long range dependencies and self-similarity of the traffic. The statistics of eigenvalue spectrum and IPR of eigenvectors of time-lagged correlation matrices provide essential dimensional reduction in the investigation of long-ranged dependence (LRD) of the network traffic. Before starting the expensive process of Hurst parameter estimation, one can attempt to find just a few indicators of LRD, self-similarity or deviations from thereof.
The rest of the paper is organized as follows. We introduce time-lagged correlation matrix and its eigensystem in Section II. Section III is devoted to numerical analysis of time-lagged eigensystem. Then, in Section IV by experimenting with the content of the original time series we addressed LRD and self-similarity of lagged correlations through proposed indicators. Conclusions and discussion are given in Section V.
II time-lagged correlation matrix of network traffic time series
The starting point of our discussion is averaged traffic count data collected from router-router and router-VLAN subnet connections of the University of Louisville backbone routers system. The same data set was used in [1] in the context of equal-time correlation matrix analysis. Below we recap the details relevant to the construction of lagged correlation matrix, relegating the information on the network and the way data was processed to [1]. We will be dealing with total of records of time series averaged over seconds, where incoming and outgoing traffic generate independent time series.
In order to define traffic rate change we used the logarithm of the ratio of two successive counts upon calculating the traffic rate change of time series , , over time ,
[2]. Then we introduce normalization, according to and built the time-lagged correlation matrix as follows [3]
| (1) |
Here the sole purpose of symmetrization is the restriction of the eigenvalues and eigenvectors to real values. In principle, the numerical experiments we run below can be repeated for the eigensystem of non-symmetric correlation matrix. Studies of the latter are already in progress in a different setting (see, for example, [6]).
II-A Eigenvalues and eigenvectors
Next we proceed with defining the indicators we focus on in what follows. First of all, the eigenproblem for our cross-correlation matrix is time dependent
| (2) |
where is -th eigenvalue, corresponding to th eigenvector. In other words, the eigensystem is defined for each increment of delay time. As opposed to same time eigensystem , our eigensystem does not characterize presence or lack of organization (localization) in the system at a given time. Instead it can serve as a measure of back-in-time (or forward in time, depending on prospective) correlation within the network structure.
Furthermore, the RMT picture of the eigenvalues and eigenvectors, in which spectrum is split into three parts is no longer valid. By three parts we understand the RMT part, which behave universally at the center of the eigenvalue spectrum, and “left” and “right” parts (lying to the left and to the right from predicted RMT bounds) which exhibit non-universal features [1]. Although, for very small this subdivision is clearly still accurate, we can expect, transient behavior of to reveal new, otherwise undetectable correlations within the network. Hence, we found it convenient to keep track of quantitative and qualitative changes in eigensystem using left/random/right terminological distinction.
On the other hand, observing the entire system of eigenvalues and the same amount of eigenvectors can be quite tedious task. One needs to come up with more concise indicators of network behavior. Selecting efficient indicators can help in defining “normal” state of the system, a task quite challenging on its own, and in predicting structural reaction to the external or internal disruption. Indicators can be chosen based on the experiments described below, or on their advanced variations. The candidates are those eigenvalues, that are most receptive to a particular probe. As far as eigenvectors are concerned we decided to test corresponding IPRs.
II-B Inverse participation ratio
Given the eigenvector the IPR is computed according to
| (3) |
with , stands for components of the th eigenvector [4]. The IPR is quite indicative in terms of signaling the number of significant , i.e. “contributors” to the eigenvector of interest. For example, if we have reasons to expect absence of correlations between routers input into the experimental data, should have its value around . Indeed, the eigenvector is normalized, thus . It has components, and they are all roughly the same in magnitude (otherwise correlations must be present). Therefore, , and . Note, that since is typically much greater than , any finite value of IPR signals localization in inter-VLAN traffic [1]. For non-zero values of , IPRs acquire more general meaning in a sense that routers which interact heavily at time may loose their “bond” at time , while these not knowing about one another at time may have significant mutual contribution at time . Other more complex possibilities can be perceived via as well.
III Eigenanalysis for time-lagged correlation matrix
III-A Stroboscopic sequence for eigensystem
Upon building the cross-correlation matrix with the help of Eq. (1) we perform eigen-decomposition (see Eq. (2)) numerically, using standard MATLAB routine. We look at the result of calculation of eigenvalues for all delay times . A noticeable spike for very small values of delay time is expected, notwithstanding the position in spectrum. However, our increments in () may not be small enough to observe it. For the remainder of observation the result has to uncover the way system constituents communicate with themselves and their neighbors on a long run.
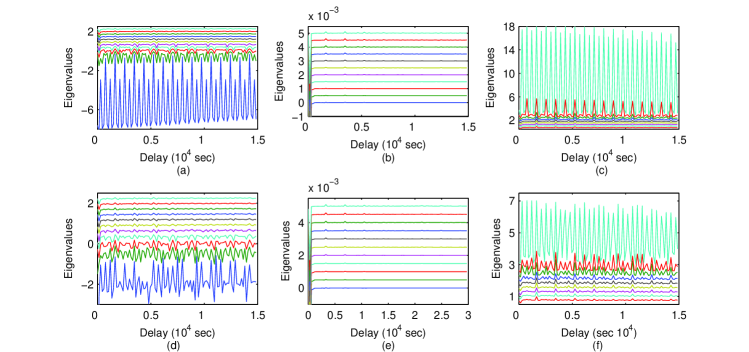
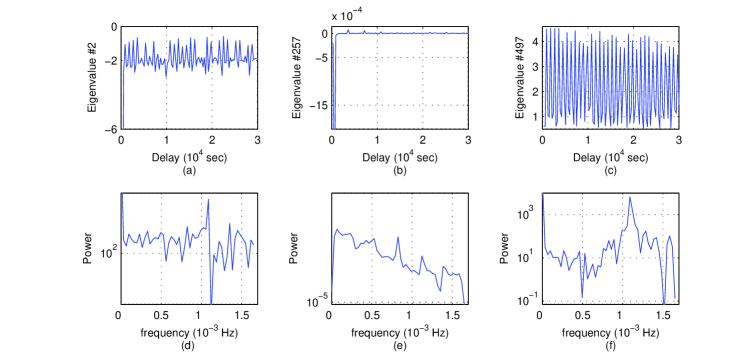
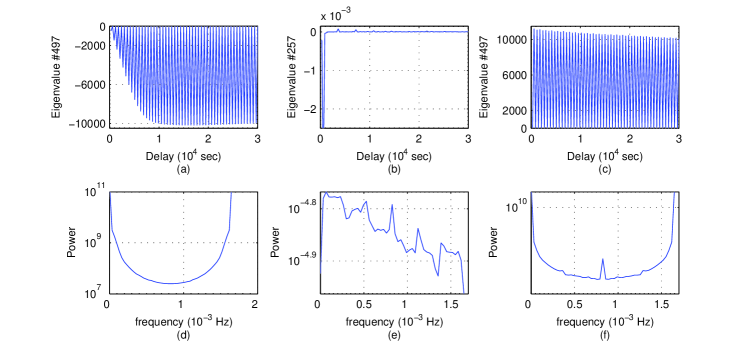
In Fig. 1(a)-(c) we illustrate how left/random/right structure of the spectrum evolves with . As it turns out, “randomness” and “regularity” find their new interpretations in the context of system remembering itself after has elapsed. With the exception of a few located at the right and left edges of the spectrum, most eigenvalues fall very close to each other numerically. To make it more transparent we plotted their -dependence using different offset values (these values are the same within each part). Only ten eigenvalues are offseted in each case and plotted versus time. The lowest eigenvalue was excluded from consideration here and throughout the paper due to it secular behavior in .
At a glance, non-edge eigenvalues Fig. 1(b) with the exception of an expected spike at small does not seem to represent any process. Such a lack of forward in time correlation is not completely surprising, as the eigenvalues from middle part of the spectrum were referred as RMT-like. It follows, that the random interactions between traffic time series are time delay invariant. In other words, random spectrum of eigenvalues is an indicator of self-similarity [12]. Meantime, the eigenvalues at the edges (Figs. 1(a) and (c)) represent a quasiperiodic process, distinguishing themselves from their "peers", the eigenvalues belonging to regular part of the spectrum for quantitatively, and both qualitatively and quantitatively from the eigenvalues belonging to the RMT-part for . They scale with delay time and clearly exhibit long time dependence [12]. Therefore, it makes sense to look further into the properties of edge eigenvalues, especially into the properties of those with relatively high absolute values. The actual values might be used as a measure of delayed time correlations. Having located potential indicators we move ahead with the search for others.
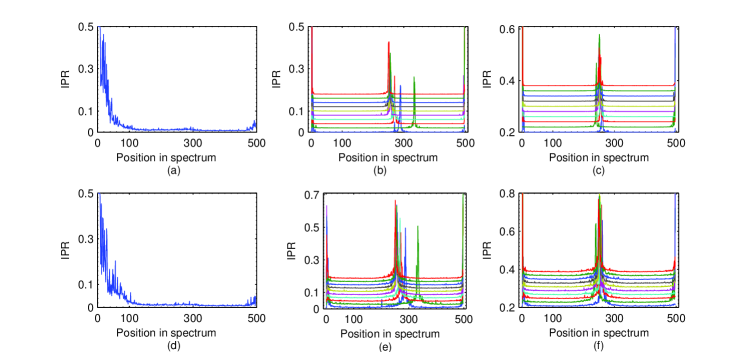
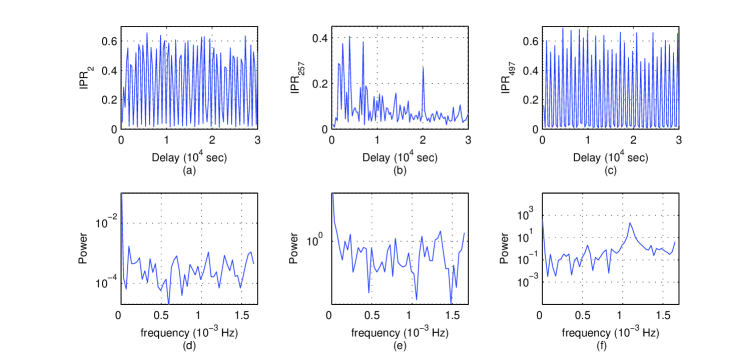
A remarkable property of the IPR for equal time cross-correlation matrix (Fig. 2(a)) is its consistently low, order , value for the major part of the spectrum. This segment in Fig. 2(a) is known to obey the RMT [1]. To the left and to the right from this segment there is a strong evidence of regular, non-random behavior. Now, if the first instances are considered as in Figs. 2(b) and (c), where IPRs offseted by an arbitrary amount for transparency and plotted versus the eigenvalue position, the situation looks drastically different. The peak located close to the center of the spectrum signifies the presence of previously undetected correlations, and the lead-lag relationship between time series.
Close examination of Figs. 2(b) and (c) shows, that initially, the high IPR has changing support in the spectrum. Furthermore, as explained in Section 2.2, peak value tells us, that about four time series drive the correlation pattern. Later on, the peak "settles down" and establishes itself around median eigenvalue position (Fig. 2(b)). The meaning of this and other two peaks differs from that of the IPR peaks in Fig. 2(a). The increase in IPR computed from the time delayed matrix indicate correlations between system’s behavior at a given time and its stroboscopic image after , rather than correlations within the spectrum. In addition, it provides reasonable way of tracking down the sources of lead-lag behavior. Thus, the observed features make IPR a good candidate for an indicator of the network congestion state. Note also significant change in height of the central peak.
III-B Frequency domain analysis
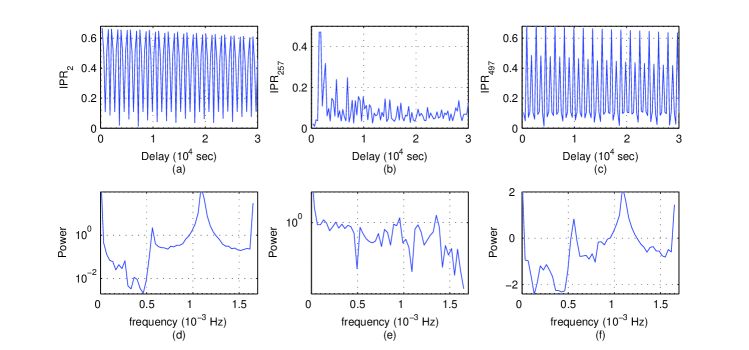
The next step in getting more quantitative on long memory processes in network traffic is to analyze transient behavior of eigenvalues and IPRs of matrix in detail. Since quasiperiodic behavior is present in the majority of quantities of interest we focus on their frequency content. The standard way to proceed is to transform into frequency domain using fast Fourier transform. In a sense, we construct a spectra of the spectrum. The same operation is performed on respective IPRs. We take fast Fourier transforms for all of the functions at hand, and then, take the square of their absolute value. The result is referred to as a power spectrum. There should be no confusion, as graphs of power always accompany the corresponding time domain quantity.
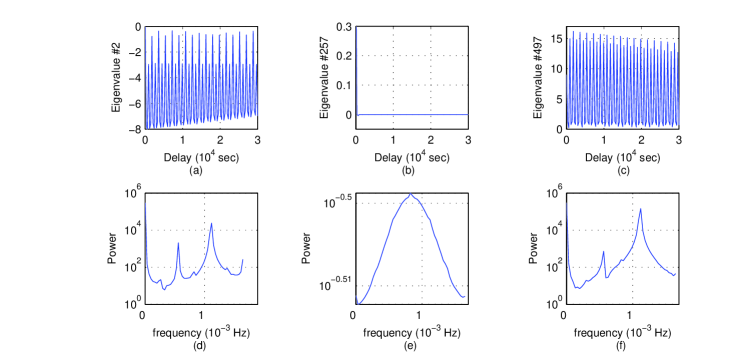
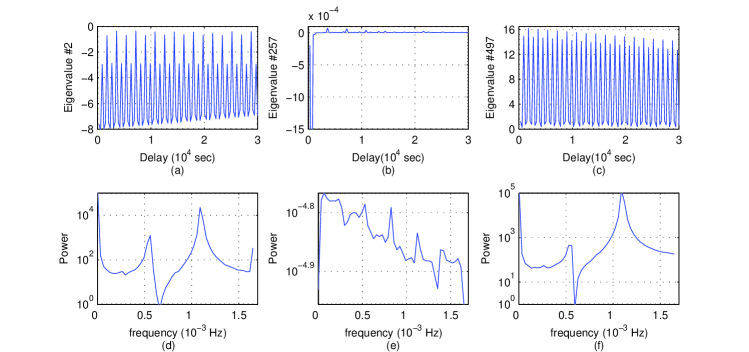
In Fig. 3 we display representative eigenvalue dynamics. Once again, random (Fig. 3(b)) does not exhibit anything remarkable, compared to its regular counterparts. The latter resemble each other, reflecting a symmetry of the spectra induced by symmetrizing procedure (Eq. (1)). For now, we can talk about them in parallel.
Aside from a substantial low and high frequency contribution, which could have already been guessed from Figs. 3(a) and (c), we discover two strong contributions from frequencies corresponding to oscillations with time periods and minutes respectively (cf. Figs. 3(d) and (f)). This is in evident contrast to the situation with power of a random eigenvalue. Such an eigenvalue has equal (negligibly small) contribution from the entire range of frequencies. The existence of these two characteristic frequencies suggests a natural way assessing the current state of the inter-domain network traffic. In fact, it might be possible to use these as the LRD quantifier estimators [12] in the future.
IV experiments with altering actual network traffic
IV-A Noise-like injections
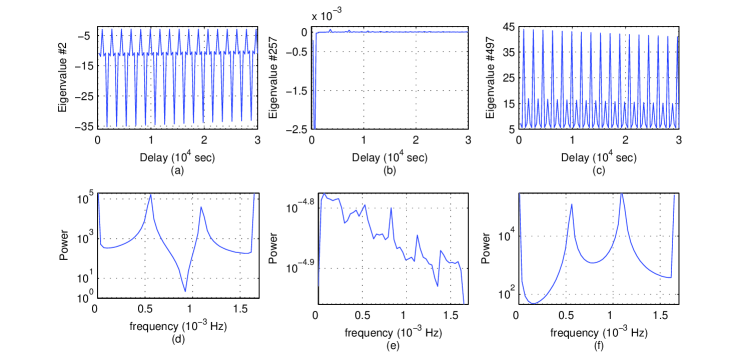
Next, we investigated consequences of modifying the time-lagged correlations between time series. We have already known the time series contributing the most to the correlation pattern [1]. All of them can be linked to eigenvalues which fall in what we term here as the right segment of eigenvalue spectrum. In these series we replaced the original traffic counts with counts obtained by random number generator for a certain period of time. Then, we constructed matrix for all hundred increments and repeated manipulations described in previous Section 3.1. The results are shown in Fig. 1(d) through (f).
The eigenvalues belonging to middle of the spectrum are completely unaffected, i.e. they are still time delay invariant. Clearly, our manipulations with the traffic are not disturbing the self-similar nature of delayed correlations. However, edge eigenvalues loose time scales present in their original transient behavior (see Fig. 1 (d) through (f)). In other words, the LRD gets destroyed. Effect on the IPR (Figs. 2(d) and (f).) is less noticeable but is still there, while for the random segment it is absent. The result of random counts injections can be summarized as presence of randomly positioned of small peaks superimposed on the original IPR picture. Indeed, in Figs. 2(a) and (c) small peaks are very infrequent and unstable in time, unlike these in Figs. 2(d) and (f).
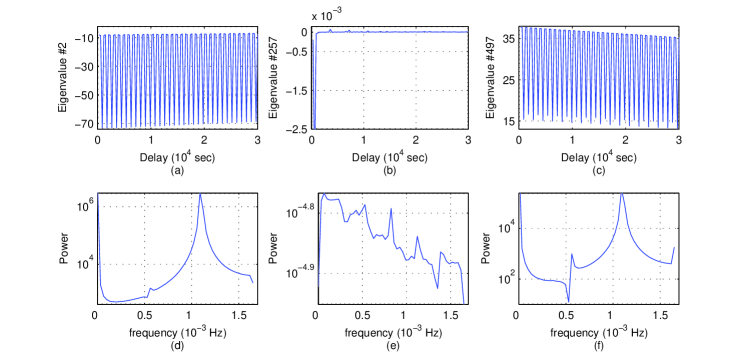
The above outcome calls for a more close look into eigenvalues and IPRs for the system experienced the noisy injections into the time series, which are believed to have major contribution to the overall traffic in router network. We present three eigenvalues considered in Section 3.2 as the functions of time delay together with their respected power spectra. As can be concluded from Fig. 5(a) and (c), the time dependence looses its LRD structure. It is backed up by the fact that a lot more frequencies contribute to power spectra upon random injection. Middle part of the spectra also undergoes certain transformation, but is still scale-free Fig. 5(b), as actual values of power are small relative to the power corresponding to edge eigenvalues. The quantitative changes are also in place for both edge eigenvalues. The effect can be judged based on comparison of the tallest peaks in Figs. 5(d) and (f) to their counterparts in Figs. 3(d) and (f).
Similar conclusions can be derived for the IPR as we take a look at Fig. 6(d) and (f) and compare the outcome of our experiment with the graphs in Fig. 4(d) and (f).
IV-B Periodic in time injections
A logical continuation of the above experiment is the injection of an artificial traffic counts which possess regularity into actual experimental data. This time, however, we perform the replacements for the time series which can be traced back to the eigenvalues falling into the random segment. Time series for this replacement were chosen at random. Other possibilities can also be considered, but since random segment was much less susceptible to the previous experiment, the above choice seems natural.
We choose four injections to be cosinusoidal, having periods of ; ; and and repeating the same manipulations as in the first experiment discussed in Section 4.1. The results are fairly sound. Although the random part of the eigenvalue spectrum is again unaltered, the “reaction” of left and right parts is both qualitative and quantitative. When cosinusoidal sample with period much smaller than both characteristic periods ( and ), power spectra in Figs. 7(d) and (f) are not significantly changed. Two characteristic periods are still present, and yet certain narrow frequency range gets suppressed (note anti-peak between the main two). Notice slight asymmetry in the way smallest and largest eigenvalues react to the injection. We should add, that we observed essentially the same picture for the injections with period of and minutes (both not matching, but commensurate with characteristic periods).
Now, we turn to Fig. 8, where the cosinusoidal replacement with period of actual traffic counts leads to the dramatic change in power spectrum. We observe enhancement of the peak corresponding to period of , which can be termed as resonance phenomenon (Figs. 8(d) and (f)). The very same plots show the suppression of peaks corresponding to the other characteristic period of . Similar resonant effect is achieved when the period of injection is changed to (see Fig. 9). This time, both peaks are gone, while the new characteristic period is detected in Fig. 9(f). It is approximately equal to the period of injection. Finally, for the experiment, in which period of the injection was chosen to be , i.e. matching to another characteristic period, we obtained yet another result supporting previous conclusions.
In this case, however, the resonance phenomenon is slightly more difficult to establish. From the results displayed in Fig. 10. We see, that relative contribution to power spectrum is now changed for two main peaks. Before the experiment was performed, the higher harmonic (smaller period) dominated by quite a few orders of magnitude. After running the experiment, this is still the case for the spectrum of largest eigenvalue, but now the difference is marginal (see Fig. 10(d)). At the same time for the left most eigenvalue, we determined, that lower harmonic (period, matching the period of injection) now contributes the most, as can be checked in Fig. 10(d). Two power spectra for the edge eigenvalues are no longer symmetric and the contributions from some ranges of frequencies are again strongly diminished. As for the random eigenvalue considered Fig. 10(b) and (e), no impact has been recorded, just as in all other cases.
V Discussion
Long range or time dependent processes which show significant correlations across large time scales were first discovered in network traffic over a decade ago. Since then, LRD was found and studied intensively in various aspects of network behavior. LRD is a manifestation of self-similarity of the process, meaning that the behavior of the process is space and time scale invariant. Leland and colleagues performed first rigorous statistical analysis of self-similar characteristics in Local Area Network (LAN) traffic [15]. They showed that the aggregated Ethernet traffic is not smoothing out with accordance to Poisson model, it is time scale invariant. In this framework the traditional Poisson or memory-less models of network traffic became inadequate. Since high variability across different time scales produces high congestion level, the impact of the self-similar traffic models on queuing performance is considerable [9].
However, the identification of self-similarity origin and estimation of LRD in network traffic are far from straightforward. One of the effective procedures to quantify LRD is to calculate the value of Hurst parameter. Even though the Hurst parameter is a scalar it cannot be calculated directly, it can be only estimated. There are several methods to estimate the Hurst parameter and sometimes they produce the conflicting results. Ineptly, it is not clear which method provides the most accurate estimation [11, 10].
In this paper, we proposed the LRD and self-similarity indicators of delayed correlations in network traffic. We demonstrated, that the time delay invariant behavior of non-edge eigenvalues of reflects the self-similar nature of delayed correlations. Meanwhile, the scaling with time of edge eigenvalues or their lagged-time dependence is an exhibition of self-similarity of delay correlations.
In addition, we established that the IPR for eigenvectors of lagged correlations are concise parameters of realistic model for network congestion pattern. As was shown in [1], IPR for contains two localization trends in network interactions, i.e. two regions in spectrum, traced back to a small number of time series, which create the bottleneck at the routers. It is noteworthy, that the IPR for where , reveals the third localization trend, which has different origin. The significantly increased and time delay invariant IPR around the median eigenvalue indicates presence of lead-lag relationship between time series.
With experiments altering the original traffic time series several distinctive effects has been uncovered. First of all, we demonstrated that tempering with time series has no effect on self-similar transient behavior of eigenvalues and IPRs, located in the middle segment of the spectrum. By contrast, both stochastic and periodic injections into the right (non-random) and middle (random) segments respectively yielded dramatic changes in chosen indicators. In particular, we recorded the destructive effect of random noise on otherwise simplistic double-peaked power spectra.
One of the main results we obtained from periodic injection experiments was presence of resonance phenomenon. When the period of injection coincides with one of the characteristic time scales of the network (i.e. oscillation periods of edge eigenvalues) the corresponding spectral peak gets enhanced. The Fourier transform peak, corresponding to the other scale gets suppressed and sometimes even annihilated. Finally, injection with the period much less than both scales has little effect on Fourier spectra, while period of the same order in magnitude rearranges the original spectra completely.
The above described time-lagged correlational analysis has a broad area of applications, where delayed correlations between system substructures are essential. For instance, it can be applied to electro-physiological time series of brain response [13], earthquake relocations [14], financial portfolios [3, 6], and atmospheric data [3]. To support this assertion we point out that edge eigenvalues of behave almost identically to these of atmospheric data, while the delay eigenvalues of the stock market data act just like the eigenvalues, we termed random [3].
acknowledgment
This research was partially supported by a grant from the US Department of Treasury through a subcontract from the University of Kentucky.
References
- [1] V. Rojkova and M. Kantardzic, Analysis of inter-domain traffic correlations: random ratrix rheory approach, arXiv.org:cs/0706.2520 (2007-06-21).
- [2] M. Barthelemy, B. Gondran and E. Guichard, Large scale cross-correlations in internet traffic, arXiv:cond0mat/0206185 vol 2 3 Dec 2002.
- [3] K.B.K. Mayya and R.E. Amritkar, Analysis of delay correlation matrices, oai:arXiv.org:cond-mat/0601279 (2006-12-20).
- [4] T. Guhr, A. Muller-Groeling, and H.A. Weidenmuller, Random matrix theories in quantum physics: common concepts, Phys. Rep. 299, 190 (1998).
- [5] Z. Burda, A. Jarosz, J. Jurkiewicz, M.A. Nowak, G. Papp, I. Zahed, Applying free random variables to random matrix analysis of financial data, cond-mat/0603024 (2006).
- [6] C. Biely and S. Thurner, Random matrix ensemble of time-lagged correlation matrices: derivation of eigenvalue spectra and analysis of financial time-series, arXiv:physics/0609053 vol 1 7 Sep 2006.
- [7] A.W. Lo and A.C MacKinlay, When are contrarian profits due to stock market over-reaction?, Review of Financial Studies, 3, 175-206 (1990).
- [8] T. Chordia and B. Swaminathan, Trading volume and cross-autocorrelations in stock returns, Journal of Finance, 55, 913-936 (2000).
- [9] A. Erramilli, O. Narayan, and W. Willinger, Experimental queuing analysis with long-range dependent packet traffic, IEEE/ACM Trans. Networking, vol 4, 2, 1996, 209-223.
- [10] M. Krunz, On the limitations of the variance-time test for inference of long-range dependence, IEEE INFOCOM, 2001, 1254-1260.
- [11] S. Molnar and T.D. Dang, Pitfalls in long range dependence testing and estimation. GLOBECOM, 2000.
- [12] T. Karagiannis, M. Molle, and M. Faloutsos, Long-range dependence, ten years of Internet traffic modeling, IEEE Internet Computing, Oct 2004.
- [13] J. Kwapien, S. Drozdz, and A.A. Ioannides, Temporal correlations versus noise in the correlation matrix formalism: an example of the brain auditory response, arXiv:cond-mat/0002175, vol 1, 11 Feb 2000.
- [14] W.-X. Du, C. H. Thurber, and D. Eberhart-Phillips, Earthquake relocation using cross-correlation time delay estimates verified with the bispectrum method, Bulletin of the Seismological Society of America, June 2004, vol 94, 3, 856-866.
- [15] W.E. Leland et al., On the self-similar nature of Ethernet traffic, IEEE/ACM Trans. Networking, vol 2, 1, 1994, 1-15.