Magnetic-order induced phonon splitting in MnO from far-infrared spectroscopy
Abstract
Detailed far-infrared spectra of the optical phonons are reported for antiferromagnetic MnO. Eigenfrequencies, phonon damping and effective plasma frequencies are studied as a function of temperature. Special attention is paid to the phonon splitting at the antiferromagnetic phase transition. The results are compared to recent experimental and theoretical studies of the spin-phonon coupling in frustrated magnets, which are explained in terms of a spin-driven Jahn-Teller effect, and to ab initio and model calculations, which predict phonon splitting induced by magnetic order.
pacs:
63.20.-e, 75.50.Ee, 78.30.-jI Introduction
Spin-phonon coupling in magnetic semiconductors has been an active area of research for decades. baltensperger ; brueesch ; lockwood ; wakamura ; wesselinowa ; rudolf72 In correlated matter it has been revived and came into the focus of modern solid state physics again, a fact that had been triggered by the observation of the splitting of phonon modes just at the onset of antiferromagnetic (AFM) order. This was investigated by far-infrared spectroscopy in geometrically frustrated ZnCr2O4 (Ref. sushkov, ) and CdCr2O4 (Ref. rudolf9, ) as well as in bond frustrated ZnCr2S4 (Refs. rudolf9, ; hemberger97, ) and ZnCr2Se4 (Refs. rudolf9, ; rudolf75, ). In the latter compound AFM order can be suppressed by moderate external magnetic fields hemberger98 and the phonon splitting fully disappears as the magnetic ordering temperature approaches 0 K (Ref. rudolf75, ).
Of course by establishing long-range spin order at , these chromium spinels lower their symmetry and reveal slight distortions from cubic symmetry. But these distortions are too small to explain the significant splitting of phonon modes. In local spin-density approximations (LSDA) the non-cubic behavior of the phonon properties can be explained in the absence of any structural distortion and arises due to the anisotropy induced by the magnetic order alone. fennie Furthermore, the structural distortions at the onset of antiferromagnetic order in these and similar spinel compounds have been explained by the concept of a spin-driven Jahn-Teller effect. yamashita ; tchernyshyov
The idea of a purely magnetic order induced phonon splitting has been put forth by Massidda et al. massidda for the AFM transition metal monoxides. The splitting of the transverse optical modes has been indeed experimentally documented by Chung et al. chung in MnO and NiO by inelastic neutron scattering. As the late transition monoxides are prototypical correlated electron systems and benchmark materials for Mott-Hubbard insulators anisimov it seems self-evident to reinvestigate MnO by far-infrared spectroscopy. Despite the fact that a number of far-infrared experiments on MnO have been published, plendl ; kinney ; mochizuki temperature dependent measurements are absent and to our knowledge the splitting of phonon modes below the AFM phase transition has not been reported so far.
In principle it seems fascinating to compare the splitting of phonon modes in a canonical antiferromagnet with strong exchange striction and only weak frustration, with the splitting observed in strongly geometrically frustrated magnets. MnO has a Curie-Weiss temperature of K (Ref. tyler, ) and hence is characterized by a frustration parameter . This value has to be compared with values in strongly frustrated magnets, like the chromiums spinel ZnCr2O4, with frustration parameters of the order of 20 (Ref. ramirez, ).
At room temperature MnO is paramagnetic and exhibits the cubic NaCl structure (; nm). morosin The transition into the AFM state at K (Ref. morosin, ) is accompanied by a small rhombohedral distortion, tombs with nm and at liquid helium temperature. morosin Despite the fact that MnO basically is the simplest transition-metal monoxide with Mn2+ having a half filled -shell and hence a negligible spin-orbit coupling, at the magnetic ordering temperature it exhibits an anomalous large exchange-striction, which arises from the dependence of the exchange energies on inter-ionic distances, and amounts (Ref. morosin, ). In the AFM phase the magnetic moments are arranged in ferromagnetic (FM) sheets parallel to (111) planes which are coupled antiferromagnetically. shull The moments lie within these FM planes shull ; shaked and are oriented parallel and antiparallel to the direction. goodwin It has been pointed out that this spin structure is not compatible with the rhombohedral distortion. The true lattice symmetry definitively should be lower. shaked
II Results and Discussion
A high-quality single crystalline platelet of MnO with one side polished to optical quality was purchased from MaTecK GmbH. The surface was parallel to a (100) plane. The reflectivity measurements were carried out in the far- and mid-infrared range using the Bruker Fourier-transform spectrometers IFS 113v and IFS 66v/S which are equipped with a He bath cryostat. In the far-infrared we measured the phonon spectra with high accuracy in a range from 50 to 700 cm-1. Additional measurements up to 8000 cm-1 were performed to unambiguously determine , which is governed by electronic contributions only. The reflectivity spectra of MnO are reported as function of temperature between liquid helium and room temperature.
Representative results of the far-infrared reflectivity at 5 K, 100 K and 305 K are shown in Fig. 1. At room temperature, as expected for paramagnetic MnO, we find a broad reststrahlen spectrum due to transverse and longitudinal optical phonons of the NaCl structure. At zero wave vector the two transverse optical phonon modes are degenerate and determine the strong increase of the reflectivity close to 250 cm-1. The longitudinal optical phonon is responsible for the steep decrease of the reflectivity at 550 cm-1. In a harmonic solid, one would ideally expect that the reflectivity in between these two characteristic frequencies, where is negative, is close to 1. The observed structure in the reflectivity as documented in Fig. 1, especially the characteristic hump close to 500 cm-1, probably results from two-phonon processes involving zone boundary optical and acoustical modes, which sum up to a zero-wave vector excitation with a dipole moment transferred from the transverse optical phonon as discussed later in the text. Despite this fact and contrary to earlier work we made no attempts to get a better fit involving two eigenmodes, plendl ; mochizuki but we will document that a reasonable fit can be obtained with realistic values of one transverse and one longitudinal optical mode.
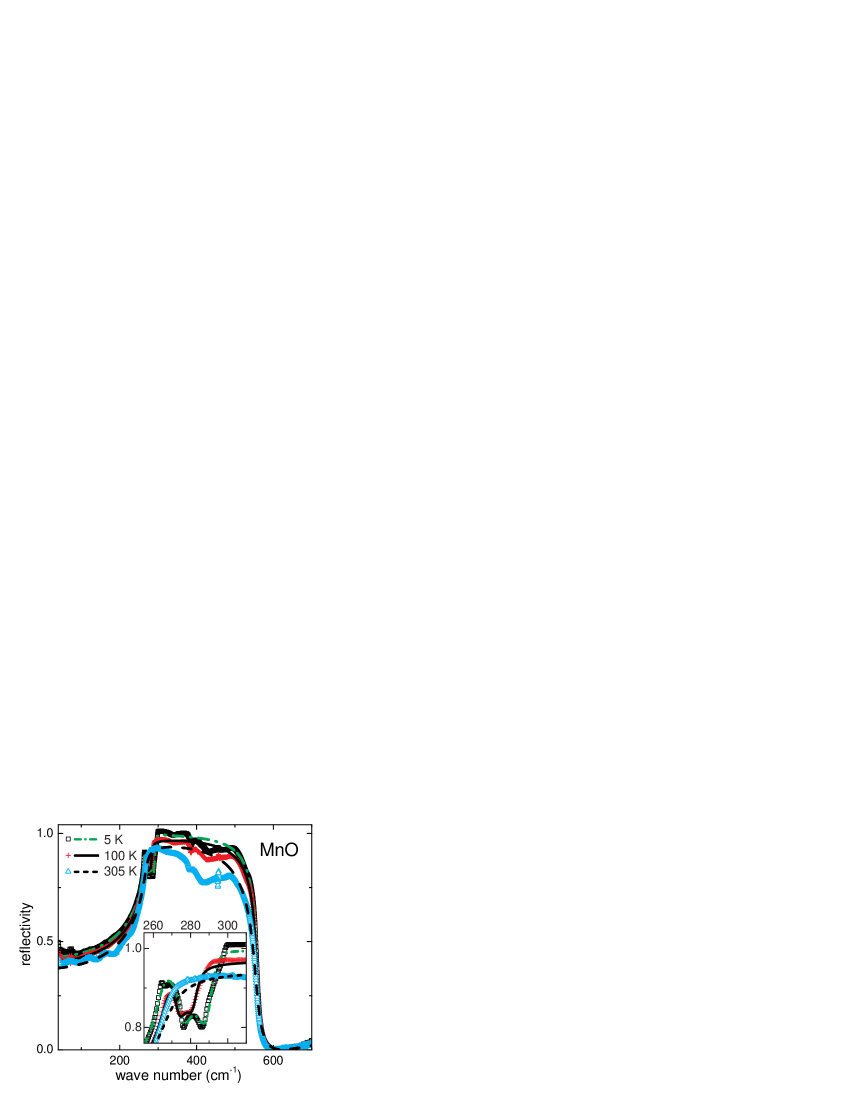
As the temperature is lowered, the reflectivity in the frequency range of the reststrahlen band slightly increases reaching values close to 1 at 5 K. At the same time the hump-like feature becomes weaker while the overall shape of the reflectivity spectrum roughly remains unchanged. Both facts indicate the decreasing influence of anharmonicity when approaching low temperatures. However, a closer inspection reveals that just at a clear dip develops in the restrahlen band close to 280 cm-1 which indicates the splitting of modes. This mode splitting is shown in the inset of Fig. 1, which provides an enlarged view of the reflectivity between 255 and 310 cm-1. At 100 K a dip evolves at 280 cm-1 and at 5 K it seems that the structure of the dip becomes even more complex indicating a splitting into three modes. This will be analyzed in more detail later.
The reflectivity spectrum of MnO has been modeled with a generalized oscillator model, gervais where the factorized form of the complex dielectric constant, , is determined by transverse and longitudinal eigenfrequencies and damping constants:
| (1) |
Here , , and correspond to longitudinal (L) and transversal (T) optical eigenfrequency and damping of the th mode, respectively. is the dielectric constant determined by electronic processes alone. In the paramagnetic phase () we have a single mode and . For temperatures , in the AFM phase, we had to use to describe the data consistently. At normal incidence the dielectric function is related to the reflectivity via
| (2) |
In this formalism the dielectric strength of a given mode is determined by
| (3) |
and the effective plasma frequency, which is related to the effective charges, follows from
| (4) |
Here is the number of ion pairs per unit cell and the permittivity of free space. is the effective charge, which should be close to 2 in mainly ionic MnO, and is the reduced mass of the ions involved in the lattice vibration.
The reflectivity spectra have been fitted using Eqs. (1) and (2) utilizing a fit routine which has been developed by A. Kuzmenko. kuzmenko The reflectivity spectrum is fully determined by the transversal and longitudinal eigenfrequencies and damping constants, which are treated as free parameters (four-parameter fit). In the AFM state the dielectric strength and the effective plasma frequency has to be calculated for each mode separately (see e.g. Ref. rudolf2007, ). The electronic dielectric constant has been determined from the reflectivity measured up to 8000 cm-1 (eV). obtained from these fits was found to scatter between 4.7 and 5.0, with no systematic temperature variation. Hence for all further analyses we used an average value of 4.85 for all temperatures from . In addition, because of the strong anharmonic effects we excluded the reflectivity regime between 350 and 480 cm-1 in our fit routine at all temperatures and found, that this restriction provides a more reliable fit. The results of the best fits are shown as solid lines in Fig. 1 and provide a good description of the reststrahlen spectrum of MnO. Even in the magnetically ordered phase, where a clear splitting of the modes can be observed, a fit using three eigenmodes yields a convincing description of the experimentally observed reflectivity (see inset in Fig. 1). From these fits we determined all transverse and longitudinal eigenmodes and damping constants as a function of temperature.
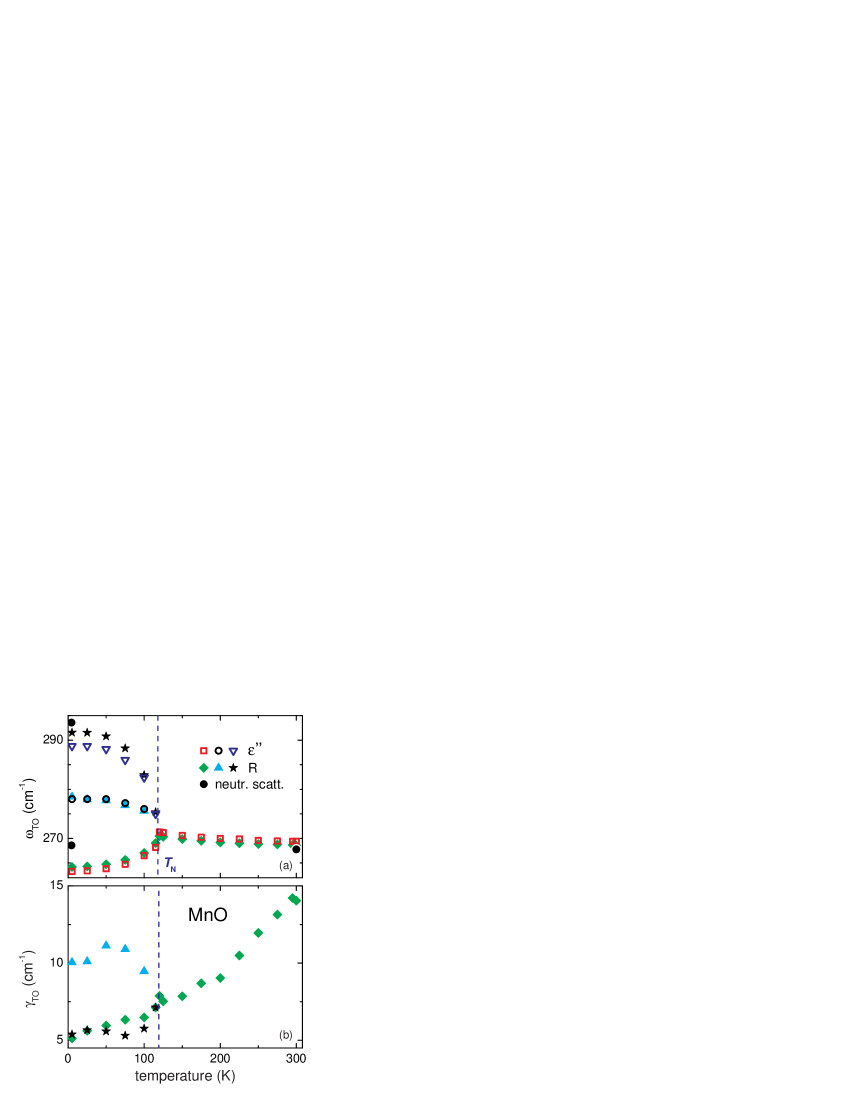
Fig. 2(a) and (b) show eigenfrequencies (upper frame) and dampings (lower frame) of the transverse eigenmodes as a function of temperature. In the paramagnetic phase reveals a slight increase on decreasing temperature as expected for an anharmonic solid. But more importantly, as is impressively documented in Fig. 2(a), a clear splitting of the eigenfrequencies can be observed in the AFM phase. At 5 K we found three transverse eigenmodes with frequencies close to 264, 278 and 292 cm-1. Hence the overall splitting amounts to almost 30 cm-1.
In the paramagnetic phase the temperature dependence of the damping decreases as expected from anharmonic like phonon-phonon interactions [Fig. 2(b)]. Below the damping of the peak with the lowest frequency continues to decrease, as does the damping of the mode with the highest frequency and at the lowest temperatures the damping amounts about 2% of the mode eigenfrequency. The damping of the peak in between of these two modes, with a very low dielectric strength, is of the order of 10 cm-1. However, one has to be aware that the experimental uncertainties for this mode are rather large. We also would like to mention that at room temperature the longitudinal eigenmode is characterized by an eigenfrequency cm-1 and a damping constant cm-1.
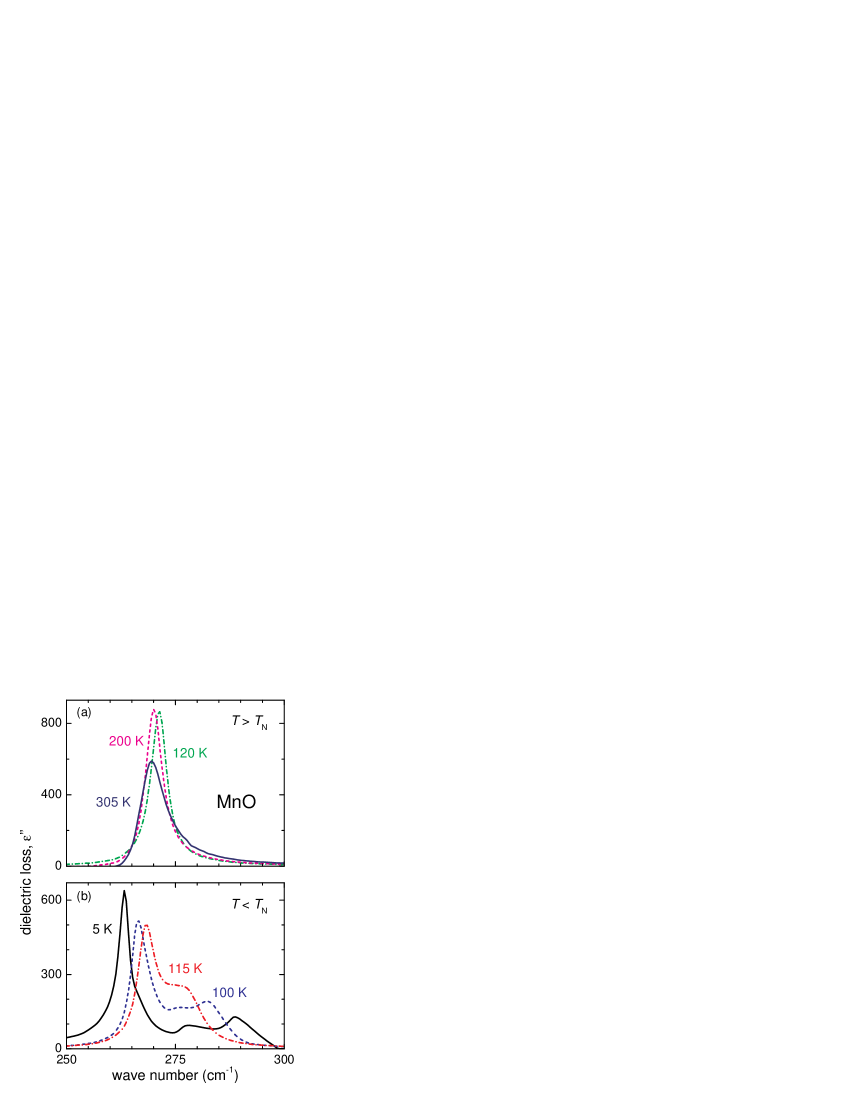
To arrive at an independent check of the quality and accuracy of the temperature dependence and splitting of the mode eigenfrequencies as shown in Fig. 2(a) we compared these fit results to the maxima of the dielectric loss function. To do so, we calculated the dielectric loss from the measured reflectivity spectra (70–8000 cm-1), with a constant extrapolation towards low frequencies and a smooth extrapolation towards high frequencies with exponents ranging from 0.09 to 0.22. In Fig. 3 we show the dielectric loss between 250 and 300 cm-1 determined by this procedure. For , in the paramagnetic phase, we detected a single loss peak indicating one well defined transverse optical phonon as expected in the cubic NaCl-type phase. Below this mode reveals significant splitting into two modes at 115 K and finally, at lower temperatures, even into three modes which, at 5 K, are located at 263, 278 and 289 cm-1. These eigenfrequencies, as determined from the peak maxima of the loss peaks, are plotted in the upper frame of Fig. 2 and we find excellent agreement between the eigenfrequencies as determined out of by the four-parameter fit routine and those derived from the loss peaks.
Our far-infrared results on the splitting of the modes have to be compared with recent neutron scattering results, which determined one mode at 300 K close to 268 cm-1 and two modes at 4.3 K, located at 268.6 cm-1 and 293.6 cm-1. chung The eigenfrequencies of these modes are indicated in Fig. 2(a). The two low-temperature modes obviously correspond to the two more intense modes as documented in Fig. 3. The small mode in between probably is unobservable in neutron scattering due to the weak intensity and the limited experimental resolution. However, the observation of a splitting into three modes may elucidate the underlying mechanism driving this phonon splitting and may put serious constraints on model calculations.
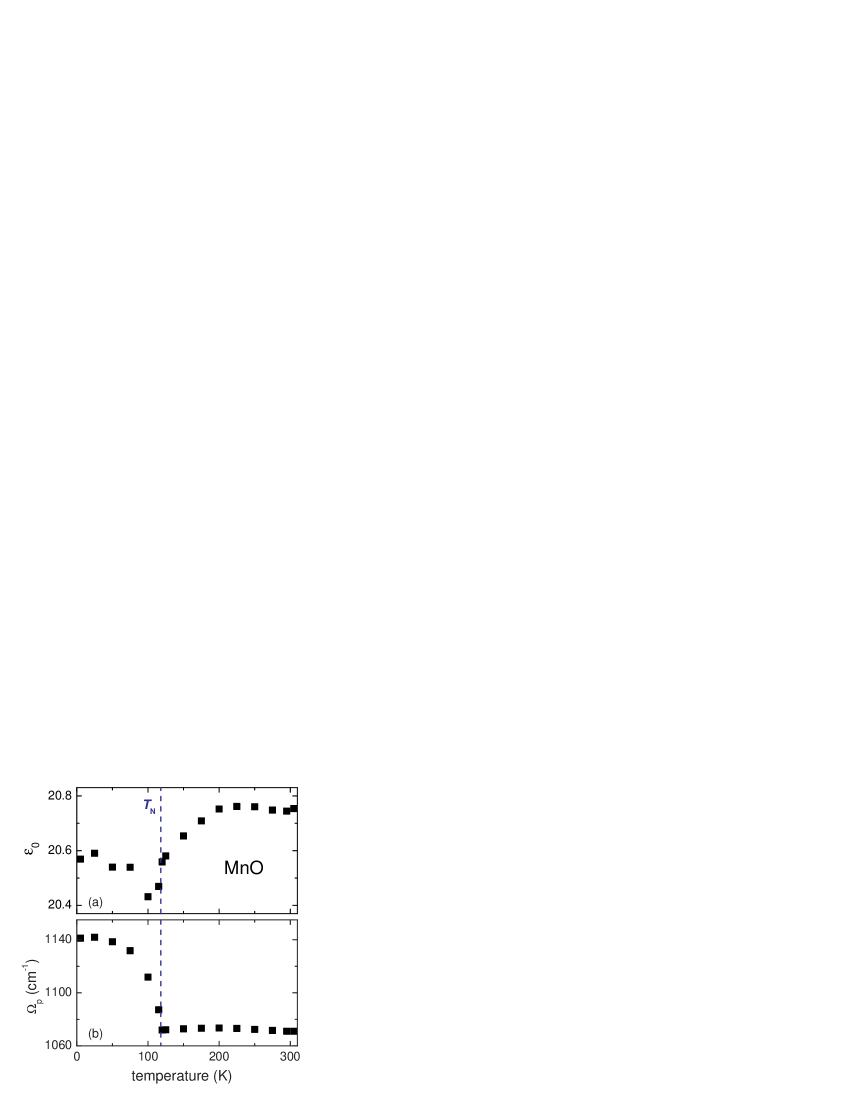
Using Eqs. (3) and (4) we calculated the static dielectric constant and the ionic plasma frequency, the results are shown in Fig. 4. For , the ionic plasma frequency is almost temperature independent with an average value of cm-1 [Fig. 4(b)]. Below the Néel temperature the effective plasma frequency exhibits an order parameter like increase and saturates close to 1140 cm-1 at low temperatures. This increase of the plasma frequency of more than 6% in the magnetically ordered state indicates significant charge transfer processes. The temperature dependence of the static dielectric constant, as calculated by Eq. 3, is shown in the upper panel of Fig. 4. At low temperatures we summed up the dielectric strength of all three eigenmodes. slightly decreases from 20.75 at room temperature to 20.6 at 5 K, with a dip-like suppression close to . The results of the static dielectric constant can be compared with measurements of the dielectric constants at radio frequencies utilizing canonical dielectric spectroscopy. seehra At 270 K, zero external pressure and depending on polarization these authors determined dielectric constants between 18.05 and 18.92, which is significantly lower than our value. In addition they report a slight decrease of the dielectric constant below the magnetic ordering temperature while we find a cusp like suppression close to . These discrepancies remain unexplained.
Longitudinal and transverse eigenfrequencies, as well as and , are in good agreement with earlier results. plendl ; kinney ; mochizuki However, one has to keep in mind that these earlier results have been obtained by analyzing the reflectivity spectrum using a model involving two damped oscillators. In these earlier investigations, the longitudinal eigenfrequency has been calculated from the Lyddane-Sachs-Teller (LST) relation:
| (5) |
In our analysis the LST relation automatically is fulfilled. Hence, in the present model a good fit is derived with the use of five parameters [see Eq. (1)], while the models used in Refs. plendl, and mochizuki, utilize a set of seven parameters. In addition, it is clear that the second mode is rather unphysical or has to be assigned to a zero-wave-vector two-phonon process, which should be observable throughout the Brillouin zone. At the zone boundary only the density of states is maximum, producing the hump around 470 cm-1 as observed in Fig. 1. Our result of the transverse optical phonon is also in good agreement with early neutron scattering results, haywood2 ; haywood4 ; wagner1 while it seems that the longitudinal phonon mode has been underestimated by neutron scattering techniques. haywood4 In Ref. haywood4, the eigenfrequencies of the LO branch at the zone center has been determined as 484 cm-1 compared to 556 cm-1 observed in this work.
An analysis of the ionic plasma frequency also allows clear statements concerning the ionicity of the bonds in MnO. From detailed electron-density-distribution studies utilizing gamma-ray spectroscopy, jauch it has been concluded that the bonding is purely ionic. We can calculate the ionic plasma frequency assuming an ideal ionic valence for both ions, which results in an effective plasma frequency of 1873 cm-1, which is significantly higher than the experimentally observed value, cm-1 at room temperature. This implies that , which still signals predominantly ionic bonding, however with distinct covalent contributions. The effective charges are almost independent of temperature for but reveal significant charge transfer in the AFM phase.
III Concluding remarks
In this work we document a detailed far-infrared study of the phonon properties
of MnO with special emphasis on the spin-phonon coupling and on the phonon
splitting in the AFM phase for K. MnO reveals a configuration
with a spin-only value of , it is an electronically strongly
correlated material and a prototypical Mott-Hubbard insulator. We provide clear
experimental evidence for
i) a significant influence of spin ordering on eigenfrequencies, damping and
effective plasma frequencies. Specifically below the antiferromagnetic phase
transition we find an increase of the effective charge by more than 5%. This
fact reflects strong charge transfer processes and/or strong changes in the
dynamic polarizability.
ii) Below we find a splitting of the phonon modes into three modes with
an overall splitting of as much as 30 cm-1. The observed splitting
compares well with neutron scattering results by Chung et
al., chung who, however, observe a splitting into two modes only. In
neutron scattering the ratio of the integrated intensities of the two peaks was
approximately 2:1 in favor of the lower mode. Also the far-infrared results at
5 K [Fig. 3(b)] show an intense low-frequency peak with approximately 2/3 of
the total intensity. It is unclear if the third peak in neutron scattering was
unobservable due to a weak intensity or due to a finite resolution. It is
possible that this low-intensity peak at 280 cm-1 reflects the symmetry in
the antiferromagnetic state which should be lower than rhombohedral.
It is unclear if the present experiments allow for a critical review on spin-Jahn-Teller transitions. MnO is a strongly correlated material with the spins residing on an fcc lattice. It reveals only weak magnetic frustration and exhibits giant exchange striction at . One is apt to think that symmetry lowering by exchange striction alone is enough to explain the phonon splitting. However, it has been clearly demonstrated by Massidda et al. massidda that the structural distortion at only explains phonon splittings of the order of less than 1%. The calculated magnetic order induced splitting of the optical phonon modes at the zone center was estimated to range model dependent from 3 to 10%. Experimentally we observed effects larger than 10%. We conclude that MnO has to be described within the framework of spin-driven Jahn-Teller transitions, developed to describe similar observations in a variety of spinel compounds.
Acknowledgements.
This research has partly been supported by the Deutsche Forschungsgemeinschaft through the German Research Collaboration SFB 484 (University of Augsburg).References
- (1) W. Baltensperger and J. S. Helman, Helv. Phys. Acta 41, 668 (1968); W. Baltensperger, J. Appl. Phys. 41, 1052 (1970).
- (2) P. Brüesch and F. D’Ambrogio, Phys. Status Solidi (B) 50, 513 (1972).
- (3) D. J. Lockwood and M. G. Cottam, J. Appl. Phys. 64, 5876 (1988).
- (4) K. Wakamura and T. Arai, J. Appl. Phys. 63, 5824 (1988).
- (5) J. M. Wesselinowa and A. T. Apostolov, J. Phys.: Condens. Matter 8, 473 (1996).
- (6) T. Rudolf, K. Pucher, F. Mayr, D. Samusi, V. Tsurkan, R. Tidecks, J. Deisenhofer, and A. Loidl, Phys. Rev. B 72, 014450 (2005).
- (7) A. B. Sushkov, O. Tchernyshyov, W. Ratcliff, S. W. Cheong, and H. D. Drew, Phys. Rev. Lett. 94, 137202 (2005).
- (8) T. Rudolf, Ch. Kant, F. Mayr, J. Hemberger, V. Tsurkan, and A. Loidl, New J. Phys. 9, 76 (2007).
- (9) J. Hemberger, T. Rudolf, H.-A. Krug von Nidda, F. Mayr, A. Pimenov, V. Tsurkan, and A. Loidl, Phys. Rev. Lett. 97, 087204 (2006).
- (10) T. Rudolf, Ch. Kant, F. Mayr, J. Hemberger, V. Tsurkan, and A. Loidl, Phys. Rev. B 75, 052410 (2007).
- (11) J. Hemberger, H.-A. Krug von Nidda, V. Tsurkan, and A. Loidl, Phys. Rev. Lett. 98, 147203 (2007).
- (12) C. J. Fennie and K. M. Rabe, Phys. Rev. Lett. 96, 205505 (2006).
- (13) Y. Yamashita and K. Ueda, Phys. Rev. Lett. 85, 4960 (2000).
- (14) O. Tchernyshyov, R. Moessner, and S. L. Sondhi, Phys. Rev. Lett. 88, 067203 (2002); O. Tchernyshyov, R. Moessner, S. L. Sondhi, Phys. Rev. B 66, 064403 (2002).
- (15) S. Massidda, M. Posternak, A. Baldereschi, and R. Resta, Phys. Rev. Lett. 82, 430 (1999).
- (16) E. M. L. Chung, D. McK. Paul, G. Balakrishnan, M. R. Lees, A. Ivanov, and M. Yethiraj, Phys. Rev. B 68, 140406(R) (2003).
- (17) V. I. Anisimov, J. Zaanen, and O. K. Andersen, Phys. Rev. B 44, 943 (1991).
- (18) J. N. Plendl, L. C. Mansur, S. S. Mitra and I. F. Chang, Solid State Commun. 7, 109 (1969).
- (19) T. B. Kinney and M. O’Keeffe, Solid State Commun. 7, 977 (1969).
- (20) S. Mochizuki, J. Phys.: Condens. Matter 1, 10351 (1989).
- (21) R. W. Tyler, Phys. Rev. 44, 776 (1933).
- (22) A. P. Ramirez, Handbook of Magnetic Materials, edited by K. H. J. Buschow (Elsevier Science, North-Holland, 2001), Vol. 13, p. 423.
- (23) B. Morosin, Phys. Rev. B 1, 236 (1970).
- (24) N. C. Tombs and H. P. Rooksby, Nature 165, 442 (1950); S. Greenwald and J. S. Smart, Nature 166, 523 (1950).
- (25) C. G. Shull and J. S. Smart, Phys. Rev. 76, 1256 (1949); C. G. Shull, W. A. Strauser, and E. O. Wollan, Phys. Rev. 83, 333 (1951); W. L. Roth, Phys. Rev. 110, 1333 (1958).
- (26) H. Shaked, J. Faber Jr., and R. L. Hitterman, Phys. Rev. B 38, 11901 (1988).
- (27) A. L. Goodwin, M. G. Tucker, M. T. Dove, and D. A. Keen, Phys. Rev. Lett. 96, 047209 (2006).
- (28) F. Gervais and B. Piriou, J. Phys. C: Solid State Phys. 7, 2374 (1974).
- (29) RefFIT by A. Kuzmenko, University of Geneva, Version 1.2.44 (2006), http://optics.unige.ch/alexey/reffit.html.
- (30) T. Rudolf, Ch. Kant, F. Mayr, J. Hemberger, V. Tsurkan, and A. Loidl, Polar phonons and spin-phonon coupling in HgCr2S4 and CdCr2S4 studied with far-infrared spectroscopy, Phys. Rev. B, to be published
- (31) M. S. Seehra, R. E. Helmick, G. Srinivasan, J. Phys. C 19, 1627 (1986).
- (32) B. C. G. Haywood and M. F. Collins, J. Phys. C 2, 46 (1969).
- (33) B. C. Haywood and M. F. Collins, J. Phys. C 4, 1299 (1971).
- (34) V. Wagner, W. Reichardt, and W. Kress, Proc. Conf. Neutron Scattering 1, 175 (1976).
- (35) W. Jauch, M. Reehuis, Phys. Rev. B 67, 184420 (2003).