High-Resolution Submillimeter Imaging of the Ly Blob1 in SSA 22
Abstract
We present resolution submillimeter observations of the submillimeter luminous giant Ly blob (LAB1) in the SSA 22 protocluster at redshift with the Submillimeter Array (SMA). Although the expected submillimeter flux density is 16 mJy at , no emission is detected with the ( kpc) beam at the 3 level of 4.2 mJy beam-1 in the SMA field of view of . This is in contrast to the previous lower angular resolution () observations where a bright (17 mJy) unresolved submillimeter source was detected at toward the LAB1 using the Submillimeter Common-User Bolometer Array on the James Clerk Maxwell Telescope. The SMA non-detection suggests that the spatial extent of the submillimeter emission of LAB1 should be larger than ( kpc). The most likely interpretation of the spatially extended submillimeter emission is that starbursts occur throughout the large area in LAB1. Some part of the submillimeter emission may come from spatially extended dust expelled from starburst regions by galactic superwind. The spatial extent of the submillimeter emission of LAB1 is similar to those of high redshift radio galaxies rather than submillimeter galaxies.
Subject headings:
cosmology:observations — galaxies: formation — galaxies: starburst — cosmology: observations — galaxies: high-redshift — galaxies: submillimeter1. INTRODUCTION
Ly blobs (LABs) are radio-quiet, giant (– kpc) Ly nebulae often discovered in overdense regions of star-forming galaxies at high redshifts (Keel et al., 1999; Steidel et al., 2000; Francis et al., 2001; Palunas et al., 2004; Matsuda et al., 2004; Dey et al., 2005; Nilsson et al., 2006; Smith & Jarvis, 2007). This new population of LABs may be related to important physical processes in galaxy formation. However, the physical origin of the extended Ly nebulae is mysterious. Although similar giant Ly nebulae are often seen around high redshift radio galaxies (HzRGs), they are thought to be related to their radio jets (e.g., McCarthy et al., 1987; van Ojik et al., 1997) and are presumably not the same population as the radio-quiet LABs. There are at least three possibilities for the origin of LABs: (1) Ly cooling radiation resulting from gravitational heating (Haiman et al., 2000; Fardal et al., 2001; Bower et al., 2004; Yang et al., 2006; Dijkstra et al., 2006a, b; Nilsson et al., 2006), (2) photoionization by metal free massive (PopIII) stars, or obscured starburst and AGN (Steidel et al., 2000; Chapman et al., 2001, 2004; Basu-Zych & Scharf, 2004; Furlanetto et al., 2005; Jimenez & Haiman, 2006), and (3) shock heating by starburst-driven galactic superwind (Taniguchi & Shioya, 2000; Taniguchi et al., 2001; Ohyama et al., 2003; Mori et al., 2004; Wilman et al., 2005; Geach et al., 2005; Mori & Umemura, 2006). Recent observations have revealed that LABs show large ( 500 km s-1) Ly velocity widths (Steidel et al., 2000; Ohyama et al., 2003; Bower et al., 2004; Wilman et al., 2005; Matsuda et al., 2006) and that a significant fraction of LABs display high luminosity infrared dust continuum emission (Chapman et al., 2001; Smail et al., 2003; Dey et al., 2005; Geach et al., 2005; Colbert et al., 2006). These properties suggest (2) and/or (3) as the possible origin of the LABs, and a close relationship to the formation of massive galaxies.
SSA 22 LAB1 at is the best suitable target to reveal the origin of LABs. Its spatial extent of kpc and a Ly luminosity of ergs s-1 places this as one of the largest and brightest objects among the known LABs (Steidel et al., 2000). In a very deep Ly image taken with the Subaru Prime-Focus Camera (Suprime-Cam), bubble like structures are seen in LAB1, which may be evidence for galactic superwind (Matsuda et al., 2004). Mori & Umemura (2006) demonstrated in their numerical simulations that such bubbles can be produced by galactic superwind from a proto-galaxy. In their model, at first, multiple gas clumps are distributed throughout a dark matter halo. Subsequently, starbursts occur coincidently in these clumps through interactions or mergers, and drive large scale gas outflows. The system evolves into an elliptical galaxy at the present epoch.
SSA 22 LAB1 has been observed (Chapman et al., 2001, 2004) with the Submillimeter Common-User Bolometer Array (SCUBA) on the James Clerk Maxwell Telescope. An unresolved submillimeter source was detected towards LAB1 with a flux density of mJy, which makes this one of the brightest submillimeter sources at high redshifts detected to date (Chapman et al., 2005). However, the angular resolution of of the SCUBA is insufficient to precisely identify the optical counterpart and to investigate the spatial extent of the star-formation activity in LAB1. Although several faint optical components were detected near the center of LAB1 with Hubble Space Telescope (HST) observations (Chapman et al., 2004), it has not been confirmed that they are optical counterparts to the submillimeter source yet. A radio source was detected with a 1.4 GHz flux density of Jy () at one of the optical components, J1, which is possibly the counterpart to the submillimeter source (Chapman et al., 2004, 2005). However, a very red band source () was detected at another optical component, J2 (Steidel et al., 2000), which is from J1. Very recently, J2 was also identified as a mid-infrared source with Spitzer/IRAC observations and it is also possibly the counterpart to the submillimeter source (Geach et al., 2006). It is also possible that the submillimeter emission of LAB1 may not be associated with compact source(s), but has a large spatial extent due to galactic superwind similar to the nearby starburst galaxy, M82, in which the distribution of dust is spread out beyond the central (optical) starburst region (e.g. Alton et al., 1999). In order to examine the spatial extent of star-formation activity and to seek the relation between the production of LABs and galactic superwinds, higher angular resolution and more sensitive submillimeter observations are required.
The Submillimeter Array (SMA, Ho, Moran & Lo, 2004) provides an angular resolution of , which is about eight times higher than that with SCUBA. It is also sensitive enough to detect bright submillimeter sources at high redshifts in a full night of observation. For these reasons, the SMA is a very powerful instrument to examine the morphology of submillimeter sources at high redshifts. For example, Iono et al. (2006) have successfully detected submillimeter emission at the level for two 20 mJy submillimeter galaxies (SMGs), SMM J123711+6222212 and MIPS J142824.0+352619, using the SMA, and they obtained firm upper limits of to the source sizes. In this letter we report a result of resolution interferometric submillimeter observation of SSA22 LAB1 with the SMA and discuss the nature of the object. We assume a flat universe of , , and km s-1 Mpc-1 ( corresponds to a physical length of 7.6 kpc at ).
2. OBSERVATIONS AND DATA REDUCTION
Observations were carried out on 2006 September 24 (1 track, 4.5 hours on source) using eight antennas in the compact configuration of the SMA111The Submillimeter Array is a joint project between the Smithsonian Astrophysical Observatory and the Academia Sinica Institute of Astronomy and Astrophysics, and is funded by the Smithsonian Institution and the Academia Sinica.. The SIS receivers were tuned to a center frequency of 345 GHz (869) in the upper sideband (USB), yielding 335 GHz (895) in the lower sideband (LSB). The SMA correlator had 2 GHz total bandwidth in each sideband. The adopted phase reference center of the target source was (J2000) , (J2000) (Chapman et al., 2005). The track was taken under good atmospheric opacity (i.e. ). The range of (unprojected) baseline lengths was 16 – 69 meters.
The SMA data were calibrated using the Caltech software package MIR, modified for the SMA. Antenna based passband calibration was done using two bright QSOs, J22250457 (3C446, 1.4 Jy) and J2148+0657 (1.0 Jy), as well as Uranus (69.0 Jy) and Callisto (5.0 Jy). Antenna based time-dependent complex gain calibration was carried out using two QSOs, J22250457 (1.4 Jy; 6∘ away from the target) and J2148+0657 (1.0 Jy; 10∘). The astrometry was checked by applying the phase calibration to a nearby QSO J22180335 (0.2 Jy; 4∘) and we assess the accuracy of the astrometry to be . The astrometric accuracy of all of these calibrators is better than 10 milliarcsec, and the positional reference is the International Celestial Reference Frame (ICRF, Ma et al., 1998). Finally, absolute flux calibration was performed using Callisto. Data calibrations were carried out by two independent groups, which allowed us to confirm the repeatability and the robustness of the results. Imaging was carried out in MIRIAD (Sault, Teuben & Wright, 1995). The natural weighted beam gave a synthesized beam size of (FWHM, P.A. = ). The rms noise after combining the two sidebands (effectively at ) is 1.4 mJy. The FWHM of the primary beam is .
3. RESULTS
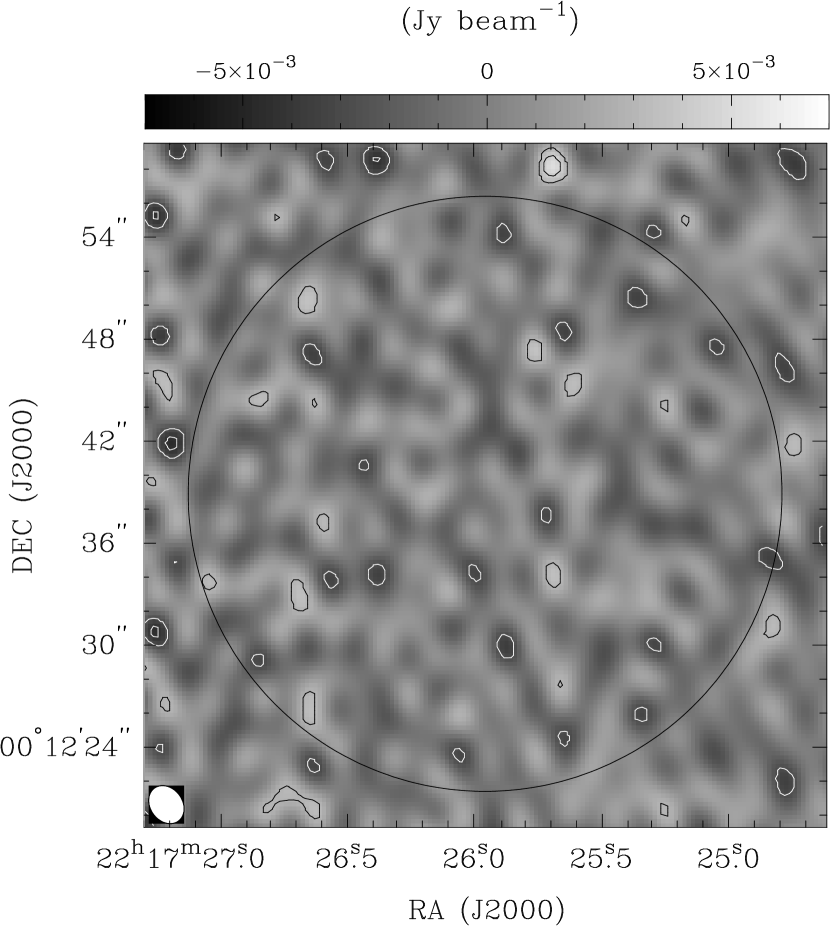
Figure 1 shows the 880 continuum map of SSA 22 LAB1. No significant emission is detected at the 3 limit of 4.2 mJy beam-1 in the field of view of . If we adopt a dust temperature of K and a power-law emissivity spectral index of (Chapman et al., 2005), the extrapolated flux density of LAB1 is 16.2 mJy from the SCUBA flux density of 17.4 mJy. If there were a single unresolved source, it would be detected at level in the map. Thus the non-detection suggests the existence of a spatially extended submillimeter emission associated with LAB1 assuming that the SCUBA detection is real. Alternatively, if there are multiple compact sources, the flux density of each source is lower than the 3 limit of 4.2 mJy beam-1 and therefore at least four sources are needed to produce the total flux density of 16.2 mJy. Widely spaced distribution of the sources is also required to satisfy the limit; the separation of the sources should be larger than the beam size of (15 kpc). We note that what appears like artifacts in the map actually arises from high side-lobe level that extends N-S of the synthesized beam. The synthesized beam has up to 70% side-lobes because the source is at zero declination. The noise peaks in the resultant maps also carry this high side-lobe, resulting in structure that appears like diagonal ridges. The theoretical noise level derived using the observed SMA parameters are consistent with the observed rms of 1.4 mJy.
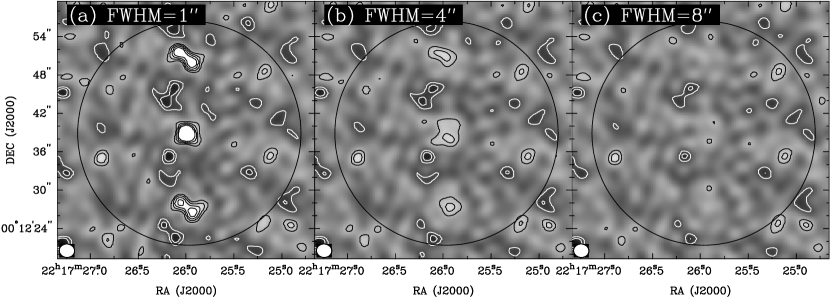
In order to check the appearance of spatially extended sources in the SMA 880 map, we carried out simulations of the SMA observations using in MIRIAD (Figure 2). In this simulation, we consider three model sources, each of which has a single Gaussian profile with the FWHM of 1″, 4″, and 8″. We assume that the sources have a total flux density of 16.2 mJy intrinsically and are placed at the phase center of the maps. We use the same observational parameters (i.e. the configuration of the SMA antennas, the coordinates of the source, and the hour angle range) for this simulation. The rms noise of 1.4 mJy beam-1 in the simulated maps is the same as that of the observed map. The simulation shows that we could detect the source with FWHM of 1″ at 10 level, and with FWHM of 4″ at 3 level in the observed map. However, the source is resolved out when the diameter of the source is larger than FWHM of 8″. Note that these simulations do not include possible pointing and phase calibration errors. Thus, a conservative lower limit of the FWHM of the spatial extent of the submillimeter emission is . Since the source is unresolved in the previous resolution SCUBA map (Chapman et al., 2001), a conservative upper limit of the FWHM is . The FWHM of the submillimeter emission associated to LAB1 should range from to , which corresponds to kpc at , if it is indeed a single source.
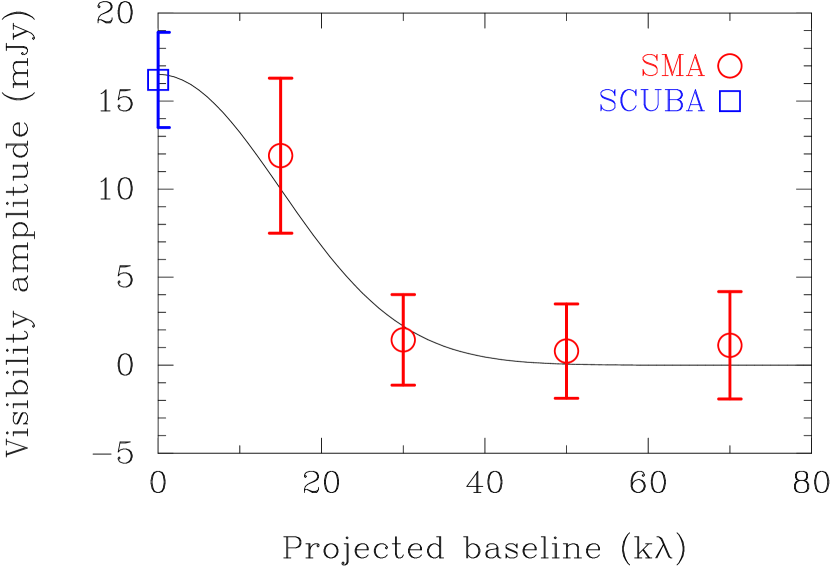
Figure 3 shows the visibility amplitude versus projected baseline with error bars. Assuming the source position is at the phase center, we calculate the vector averaged amplitudes from the visibility data in circular bins of , , , and k. Each bin contains about 3000 – 8000 raw visibility points. The visibility amplitude shows a marginal (2.7) excess at the bin that represents data for k. We also plot the total flux density extrapolated from the SCUBA measurement ( mJy) at the projected baseline of zero. In order to constrain the spatial extent of the submillimeter emission, we fit a Gaussian profile to the visibility data and the total flux density data. The best fit Gaussian source has a flux density of mJy and a FWHM of , which corresponds to kpc at . The suggested source size of from the visibility data is consistent with the range of the source size of expected from the simulations.
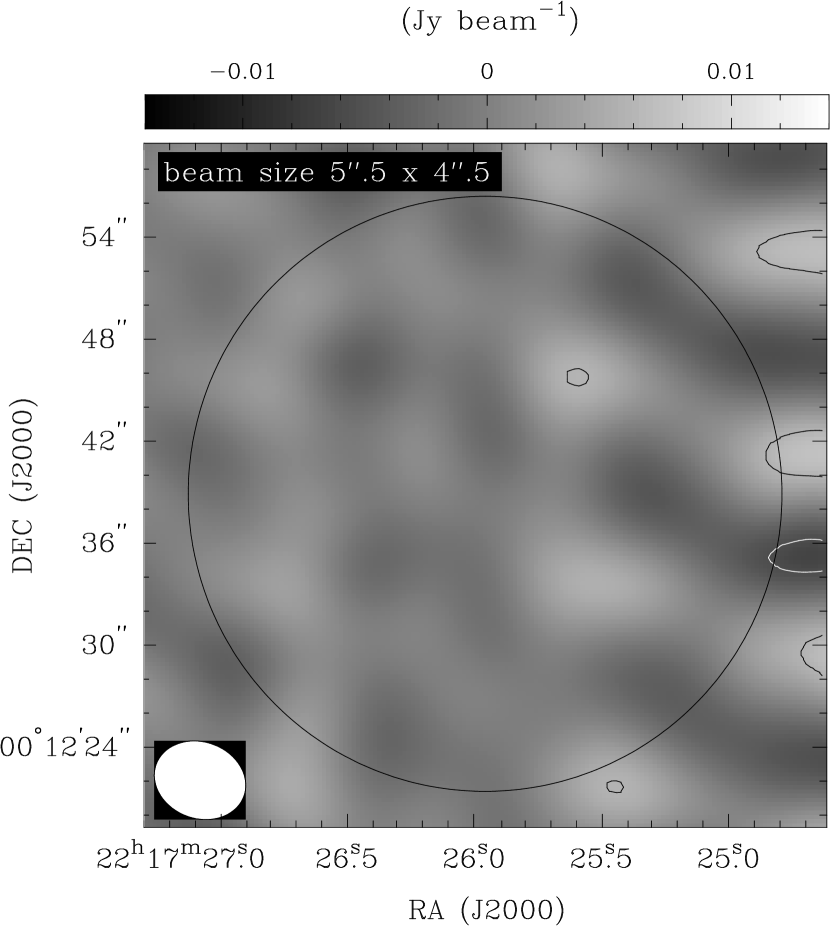
To increase the detectability of the extended submillimeter emission, we tapered the visibility data with a Gaussian that has a FWHM of (Figure 4). The synthesized beam size of the map is and the rms noise is 2.8 mJy beam-1. However, we could not detect the extended submillimeter emission in the map at the 3 limit of 8.4 mJy beam-1. The peak flux density of 6.0 mJy beam-1 (2.1 ) is expected for the source with the FWHM of and the total flux density of 16.2mJy. Thus the non-detection in the lower resolution map is consistent with the expected peak flux density of the extended submillimeter emission.
In summary, the data suggest that the spatial extent of the submillimeter emission of LAB1 should be larger than ( kpc), if the source has a Gaussian profile. However, the S/N of the data is too low to distinguish whether the submillimeter emission comes from a single extended source, widely spaced multiple compact sources, or a combination of both.
4. DISCUSSION
4.1. Origin of the Submillimeter Emission
4.1.1 Extended Starbursts
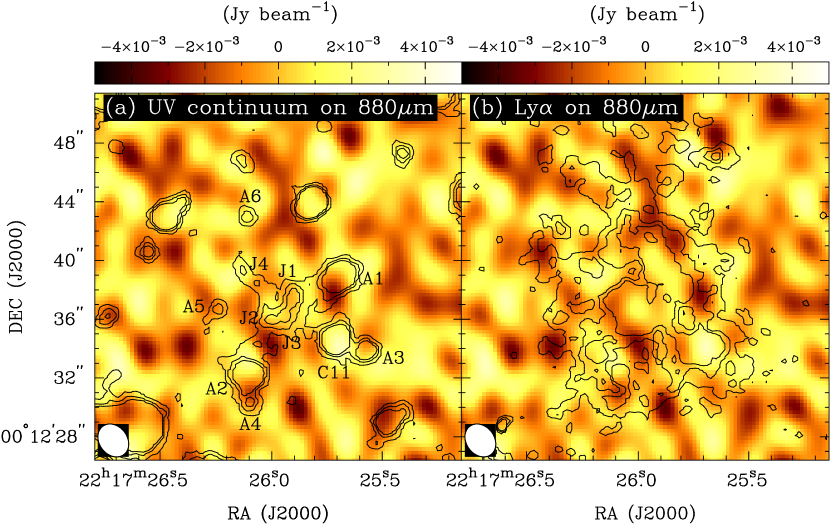
We discuss possible interpretations of the spatially extended submillimeter emission of LAB1. One possible (and probably most likely) interpretation is spatially extended star-formation in LAB1. There is evidence to support this interpretation. It seems that the UV continuum emission is also spatially extended in LAB1. Figure 5 (left) shows -band (UV continuum at the rest frame of LAB1) image contours superposed on the 880 map. The resolution of the -band image is . The astrometric system of the image is defined by the reference frame of the 2MASS All-Sky Catalog of Point Sources (Cutri et al., 2003), and the typical rms error is less than . In Figure 5 (left), we label UV continuum sources that are possibly associated with LAB1, C11 (Steidel et al., 2000), J1 – 4 sources (Chapman et al., 2004), and A1 – 6. The UV continuum sources are widely spaced and have the median separation of . The spectroscopic redshift of C11 was measured to be the same as LAB1 (Steidel et al., 2003). There is a marginal () excess of submillimeter emission at the position of C11, suggesting that C11 is one of the counterparts of the submillimeter emission. A2 shows a marginal narrow-band deficit ( mag), which suggests it has Ly absorption at and is associated with LAB1. We derived the photometric redshifts of the UV continuum sources inside the Ly nebula using Palomar -band image (Steidel et al., 2003) and Suprime-Cam , , , , and, bands images (Hayashino et al., 2004) with Hyperz (Bolzonella et al., 2000). We found that the sources brighter than magnitude (i.e. C11, J1 – 3, and A1 – 3) show photometric redshifts between and . These redshifts are consistent with , if we consider the estimated uncertainty of the photometric redshifts of . Moreover diffuse UV continuum emission seems to connect these sources with each other. The diffuse UV continuum emission may be tidal tails and bridges due to interactions of these sources. The photometric redshifts of the UV continuum sources and the connecting diffuse UV continuum emission suggest that most of the UV continuum sources are associated with LAB1. It is possible that the distribution of the submillimeter emission is similar to that of the UV continuum emission.
We derive a star-formation rate (SFR) in LAB1 of 1400 yr-1 from the far-infrared (FIR) luminosity of (Chapman et al., 2005) and the relation between far-infrared (FIR) luminosity and SFR, (Kennicutt, 1998). The large SFR of LAB1 suggests that intense starbursts occur in LAB1. We also derive an average SFR surface density of yr-1 kpc-2 from dividing the SFR by the area of the submillimeter emission, , where is a half size of the FWHM of the submillimeter emission of 40 kpc. The average SFR surface density of LAB1 is comparable to those of local starburst galaxies estimated from FIR luminosity and H size (Meurer et al., 1997). Thus the large spatial extent of the submillimeter emission and the high average SFR surface density suggest that starbursts occur throughout the large area in LAB1.
We also derive a SFR in LAB1 of 220 yr-1 from the UV luminosity density at Å of for the UV continuum emission inside the Ly nebula and the relation between UV luminosity density and SFR, (Kennicutt, 1998). We do not correct for dust extinction in this calculation. The SFR derived from the UV continuum emission is about an order of magnitude lower than that derived from the submillimeter emission. The difference suggests that most of the UV continuum emission produced from star-formation activity in LAB1 is attenuated by dust. There may be buried, unidentified UV continuum sources in LAB1.
It is worth noting here that recent Spitzer/MIPS observations have also given us a hint that LABs have multiple dusty sources. Colbert et al. (2006) detected two or three sources at the positions of two LABs at , which are possibly associated with the LABs. The separations of these sources are kpc, similar to or somewhat larger than the separations of the possible optical counterparts (i.e. UV continuum sources) of LAB1. The widely spaced dusty sources may be a common feature of LABs.
4.1.2 Galactic Superwind
Some part of the submillimeter emission can be interpreted as thermal emission from spatially extended dust expelled from starburst regions by galactic superwind. Since LAB1 shows possible evidence for galactic superwind (i.e bubble like structures seen in its Ly nebula), it may have a large amount of dust entrained in gas outflows. Figure 5 (right) shows Ly image contours superposed on the 880 map. While the S/N of the submillimeter emission is low and may not be adequate for conclusive determinations, the submillimeter features seem to correlate with the high surface brightness regions of Ly emission. The possible correlation in distributions between submillimeter and Ly emissions is consistent with this interpretation. Bower et al. (2004) found a Ly velocity gradient around C11 and argued that a bipolar outflow seen in M82 is a local analog for C11. In fact, M82 shows not only an extended H emission-line nebula associated with the bipolar gas outflow (Heckman et al., 1990; Ohyama et al., 2002) but also extended dust emission (Alton et al., 1999; Engelbracht et al., 2006). Engelbracht et al. (2006) found that dust emission extends to 6 kpc from the central starburst region of M82, and the extended emission accounts for about one-third of the total flux with IRAC observations. Thus, it is possible that the thermal emission from the spatially extended dust expelled from starburst regions also contributes the spatially extended submillimeter emission of LAB1. In this picture, some of the extended Ly and UV continuum emission of LAB1 may be light scattered by spatially extended dust.
4.1.3 Other Possible Interpretations
The Sunyaev-Zeldovich (S-Z) increment is another possible interpretation for the spatially extended submillimeter emission. There is evidence that LAB1 lies in a deep dark matter potential well made by the proto-cluster at (Steidel et al., 2000; Matsuda et al., 2005). The dynamical mass of LAB1 is estimated to be M⊙ from the size and the velocity width of Ly emission (Bower et al., 2004). However, a 450 emission with a flux density of mJy was detected toward LAB1 and the measured 450/850 ratio is an order of magnitude higher than the expected one from the S-Z increment (Chapman et al., 2001). Thus, the S-Z increment is not a likely interpretation.
The non-detection of submillimeter emission in the SMA map may be due to time-variability of dust emission around a buried AGN, but past observational results provide evidence that this is unlikely. The spectral energy distribution of LAB1 (Fig.7, Chapman et al., 2004) suggests that the contribution of non-thermal emission to submillimeter wavelength must be negligible. The SMA observations of LAB1 are about five years after the SCUBA observations. If the source shows time-variability, the submillimeter flux density had to decrease by a factor of four or more in five years (one year in rest frame). In order to produce the time-variability in such time-scale, the required size of dust distribution around a nucleus is less than about one light year ( pc). Taking the FIR luminosity of and the dust temperature of K, we estimate the minimum source size of kpc. For the optically thin case, the source size is estimated to be much larger. Thus, the minimum source size is inconsistent with the required source size for time-variability.
4.2. Comparison with Other Submillimeter Luminous Populations at High-z
In order to investigate the relation of LAB1 to other luminous submillimeter populations at high redshifts such as SMGs and HzRGs, we compare the spatial extents of the submillimeter emission of these objects.
The spatial extents of the submillimeter emission of SMGs are 5 – 20 times smaller than that of LAB1. Tacconi et al. (2006) estimated the median submillimeter source size to be (4 kpc) from resolution millimeter continuum and CO imaging of eight SMGs at with the IRAM Plateau de Bure Interferometer (PdBI). Iono et al. (2006) directly constrain the upper limits of the submillimeter source size of from resolution submillimeter imaging of two luminous SMGs with the SMA. Although some of the SMGs are resolved into two compact sources (Tacconi et al., 2006), most SMGs are single compact sources. Thus the majority of the SMGs appear to be much more compact in submillimeter than LAB1.
The spatial extent of the submillimeter emission of HzRGs is similar to or somewhat larger than that of LAB1. High resolution millimeter observations with the IRAM PdBI revealed the spatially extended dust and gas in HzRGs. Papadopoulos et al. (2000) found that the millimeter and CO emissions in a radio galaxy 4C 60.07 at extends over kpc. De Breuck et al. (2003) also found that evidence for spatially resolved dust emission at scales of to in B3 J2330+3927 at . Stevens et al. (2003) found that five of seven HzRGs are resolved even with the SCUBA beam and the FWHM of the submillimeter emission ranges from 50 to 250 kpc. Since HzRGs are known to lie in overdense regions (e.g. Venemans et al., 2007) as well as LAB1, both of HzRGs and LAB1 may have spatially extended starbursts induced by interactions and mergers of gas clumps in overdense environments at high redshifts.
5. CONCLUSIONS
The resolution submillimeter observations of SSA22 LAB1 provide evidence that the associated submillimeter emission extends larger than ( kpc). The most likely interpretation for the extended submillimeter emission is spatially extended star-formation in LAB1. The derived SFR surface density suggests that starbursts occur throughout the large area in LAB1. The hint of a possible correlation in distributions between submillimeter and Ly emissions suggests that the thermal emission from the spatially extended dust expelled from starburst regions by galactic superwind may contribute the spatially extended submillimeter emission of LAB1. The spatial extent of submillimeter emission of LAB1 is similar to those of HzRGs rather than SMGs. Further data will be required to determine whether spatially extended submillimeter emission is a common feature of LABs and to investigate the relationship between radio-quiet LABs and HzRGs.
References
- Alton et al. (1999) Alton, P. B., Davies, J. I., & Bianchi, S. 1999, A&A, 353, 51
- Bolzonella et al. (2000) Bolzonella, M., Miralles, J.-M., & Pelló, R. 2000, A&A, 363, 476
- Bower et al. (2004) Bower, R. G., et al. 2004, MNRAS, 351, 63
- Basu-Zych & Scharf (2004) Basu-Zych, A., & Scharf, C. 2004, ApJ, 615, L85
- Chapman et al. (2001) Chapman, S. C., Lewis, G. F., Scott, D., Richards, E., Borys, C., Steidel, C. C., Adelberger, K. L., & Shapley, A. E. 2001, ApJ, 548, L17
- Chapman et al. (2004) Chapman, S. C., Scott, D., Windhorst, R. A., Frayer, D. T., Borys, C., Lewis, G. F., & Ivison, R. J. 2004, ApJ, 606, 85
- Chapman et al. (2005) Chapman, S. C., Blain, A. W., Smail, I., & Ivison, R. J. 2005, ApJ, 622, 772
- Colbert et al. (2006) Colbert, J. W., Teplitz, H., Francis, P., Palunas, P., Williger, G. M., & Woodgate, B. 2006, ApJ, 637, L89
- Cutri et al. (2003) Cutri, R. M., et al. 2003, The IRSA 2MASS All-Sky Point Source Catalog, NASA/IPAC Infrared Science Archive. http://irsa.ipac.caltech.edu/applications/Gator/,
- De Breuck et al. (2003) De Breuck, C., et al. 2003, A&A, 401, 911
- Dey et al. (2005) Dey, A., et al. 2005, ApJ, 629, 654
- Dijkstra et al. (2006a) Dijkstra, M., Haiman, Z., & Spaans, M. 2006, ApJ, 649, 14
- Dijkstra et al. (2006b) Dijkstra, M., Haiman, Z., & Spaans, M. 2006, ApJ, 649, 37
- Engelbracht et al. (2006) Engelbracht, C. W., et al. 2006, ApJ, 642, L127
- Fardal et al. (2001) Fardal, M. A., Katz, N., Gardner, J. P., Hernquist, L., Weinberg, D. H., & Davé, R. 2001, ApJ, 562, 605
- Francis et al. (2001) Francis, P. J., et al. 2001, ApJ, 554, 1001
- Furlanetto et al. (2005) Furlanetto, S. R., Schaye, J., Springel, V., & Hernquist, L. 2005, ApJ, 622, 7
- Geach et al. (2005) Geach, J. E., et al. 2005, MNRAS, 363, 1398
- Geach et al. (2006) Geach, J. E., Smail, I., Chapman, S. C., Alexander, D. M., Blain, A. W., Stott, J. P., & Ivison, R. J. 2006, ArXiv Astrophysics e-prints, arXiv:astro-ph/0612272
- Haiman et al. (2000) Haiman, Z., Spaans, M., & Quataert, E. 2000, ApJ, 537, L5
- Hayashino et al. (2004) Hayashino, T., et al. 2004, AJ, 128, 2073
- Heckman et al. (1990) Heckman, T. M., Armus, L., & Miley, G. K. 1990, ApJS, 74, 833
- Ho, Moran & Lo (2004) Ho, P. T. P., Moran, J. M., & Lo, K. Y. 2004, ApJ, 616, L1
- Iono et al. (2006) Iono, D., et al. 2006, ApJ, 640, L1
- Jimenez & Haiman (2006) Jimenez, R., & Haiman, Z. 2006, Nature, 441, 120
- Keel et al. (1999) Keel, W. C., Cohen, S. H., Windhorst, R. A., & Waddington, I. 1999, AJ, 118, 2547
- Kennicutt (1998) Kennicutt, R. C., Jr. 1998, ARA&A, 36, 189
- Ma et al. (1998) Ma, C., et al. 1998, AJ, 116, 516
- Matsuda et al. (2004) Matsuda, Y., et al. 2004, AJ, 128, 569
- Matsuda et al. (2005) Matsuda, Y., et al. 2005, ApJ, 634, L125
- Matsuda et al. (2006) Matsuda, Y., Yamada, T., Hayashino, T., Yamauchi, R., & Nakamura, Y. 2006, ApJ, 640, L123
- McCarthy et al. (1987) McCarthy, P. J., Spinrad, H., Djorgovski, S., Strauss, M. A., van Breugel, W., & Liebert, J. 1987, ApJ, 319, L39
- Meurer et al. (1997) Meurer, G. R., Heckman, T. M., Lehnert, M. D., Leitherer, C., & Lowenthal, J. 1997, AJ, 114, 54
- Mori et al. (2004) Mori, M., Umemura, M., & Ferrara, A. 2004, ApJ, 613, L97
- Mori & Umemura (2006) Mori, M., & Umemura, M. 2006, Nature, 440, 644
- Nilsson et al. (2006) Nilsson, K. K., Fynbo, J. P. U., Møller, P., Sommer-Larsen, J., & Ledoux, C. 2006, A&A, 452, L23
- Ohyama et al. (2002) Ohyama, Y., et al. 2002, PASJ, 54, 891
- Ohyama et al. (2003) Ohyama, Y., et al. 2003, ApJ, 591, L9
- Osterbrock (1989) Osterbrock, D. E. 1989, Research supported by the University of California, John Simon Guggenheim Memorial Foundation, University of Minnesota, et al. Mill Valley, CA, University Science Books, 1989, 422 p.,
- Palunas et al. (2004) Palunas, P., Teplitz, H. I., Francis, P. J., Williger, G. M., & Woodgate, B. E. 2004, ApJ, 602, 545
- Papadopoulos et al. (2000) Papadopoulos, P. P., Röttgering, H. J. A., van der Werf, P. P., Guilloteau, S., Omont, A., van Breugel, W. J. M., & Tilanus, R. P. J. 2000, ApJ, 528, 626
- Sault, Teuben & Wright (1995) Sault, R. J., Teuben, P. J., & Wright, M. C. H. 1995, in ASP Conf. Ser. 77, Astronomical Data Analysis Software and Systems IV, ed. R. A. Shaw, H.E. Payne, & J. J. E. Haynes (San Francisco:ASP), 433
- Smail et al. (2003) Smail, I., Ivison, R. J., Gilbank, D. G., Dunlop, J. S., Keel, W. C., Motohara, K., & Stevens, J. A. 2003, ApJ, 583, 551
- Smith & Jarvis (2007) Smith, D. J. B., & Jarvis, M. J. 2007, ArXiv Astrophysics e-prints, arXiv:astro-ph/0703522
- Steidel et al. (2000) Steidel, C. C., Adelberger, K. L., Shapley, A. E., Pettini, M., Dickinson, M., & Giavalisco, M. 2000, ApJ, 532, 170
- Steidel et al. (2003) Steidel, C. C., Adelberger, K. L., Shapley, A. E., Pettini, M., Dickinson, M., & Giavalisco, M. 2003, ApJ, 592, 728
- Stevens et al. (2003) Stevens, J. A., et al. 2003, Nature, 425, 264
- Tacconi et al. (2006) Tacconi, L. J., et al. 2006, ApJ, 640, 228
- Taniguchi & Shioya (2000) Taniguchi, Y., & Shioya, Y. 2000, ApJ, 532, L13
- Taniguchi et al. (2001) Taniguchi, Y., Shioya, Y., & Kakazu, Y. 2001, ApJ, 562, L15
- van Ojik et al. (1997) van Ojik, R., Roettgering, H. J. A., Miley, G. K., & Hunstead, R. W. 1997, A&A, 317, 358
- Venemans et al. (2007) Venemans, B. P., et al. 2007, A&A, 461, 823
- Wilman et al. (2005) Wilman, R. J., Gerssen, J., Bower, R. G., Morris, S. L., Bacon, R., de Zeeuw, P. T., & Davies, R. L. 2005, Nature, 436, 227
- Yang et al. (2006) Yang, Y., Zabludoff, A. I., Davé, R., Eisenstein, D. J., Pinto, P. A., Katz, N., Weinberg, D. H., & Barton, E. J. 2006, ApJ, 640, 539