X-ray Spectral Signatures of the Photon Bubble Model for Ultraluminous X-ray Sources
Abstract
The nature of ultraluminous X-ray sources in nearby galaxies is one of the major open questions in modern X-ray astrophysics. One possible explanation for these objects is an inhomogeneous, radiation dominated accretion disk around a black hole — the so-called “photon bubble” model. While previous studies of this model have focused primarily on its radiation-hydrodynamics aspects, in this paper, we provide an analysis of its X-ray spectral (continuum and possible edge and line) characteristics. Compton reflection between high and low density regions in the disk may provide the key to distinguishing this model from others, such as accretion onto an intermediate mass black hole. We couple a Monte Carlo/Fokker-Planck radiation transport code with the XSTAR code for reflection to simulate the photon spectra produced in a photon bubble model for ULXs. We find that reflection components tend to be very weak and in most cases not observable, and make predictions for the shape of the high-energy Comptonizing spectra. In many cases the Comptonization dominates the spectra even down to a few keV. In one simulation, a feature was found, which may be considered a signature of photon bubbles in ULXs; furthermore, we make predictions of high energy power-laws which may be observed by future instruments.
1 Introduction
Approximately 150 off-nuclear Ultraluminous X-ray Sources (ULXs) in nearby galaxies have been discovered with luminosities greater than erg s-1, exceeding the Eddington Luminosity for a black hole (e.g., Fabbiano, 1988; Colbert & Mushotzky, 1999; Colbert & Ptak, 2002; Liu & Mirabel, 2005). While some can be identified as supernova remnants, background Active Galactic Nuclei, or faint foreground stars (e.g., Gutierrez, 2006), most seem to be the result of accretion from a high-mass star onto a compact object. Short-term variability of some of these ULXs indicates that they are not simply unresolved superpositions of several lower-luminosity sources (e.g., Matsumoto et al., 2001; Fabbiano et al., 2003). Thus, the high luminosity implies accretion onto black holes with masses , (intermediate mass black holes; IMBHs; Colbert & Mushotzky, 1999; Makishima et al., 2000; Hui, Krolik & Hubeny, 2005; Madhusudhan et al., 2006) or super–Eddington accretion. Super–Eddington accretion can be achieved in two different ways: an inhomogeneous accretion-disk structure in which the photon flux is spatially separated from the bulk of the matter influx, or strongly anisotropic radiation.
Anisotropic emission (King et al., 2001) may originate, e.g., from jet sources associated with accretion onto solar-mass black holes (microquasars) in which the jet is oriented at a small angle with respect to our line of sight — the so-called “microblazar” model (Georganopoulos, Aharonian & Kirk, 2002; Körding, Falcke & Markoff, 2002). The latter model is now considered unlikely based on recent observations of X-ray ionization of optical nebulae associated with some ULXs (Pakull & Mirioni, 2003; Gutierrez, 2006).
A promising mechanism for sustaining super-Eddington accretion in a radiation-dominated, magnetized accretion flow, is provided by the so-called photon bubble instability (Arons, 1992; Gammie, 1998; Begelman, 2001, 2002, 2006). In this model, radiation can escape along low-density regions (LDRs) aligned with predominantly vertical magnetic field lines. The accretion flow is concentrated in thin, optically thick high-density regions (HDRs), where the magnetic pressure of field lines oriented predominantly within the disk dominates over the gas pressure, thus confining the gas and preventing the radiation pressure from disrupting the accretion flow. In such a configuration, the total disk luminosity can exceed the Eddington luminosity by a factor approximately equal to the ratio of the magnetic field pressure to the gas pressure (Begelman, 2001, 2002) in the HDRs.
Given the variety of different promising candidate models for the nature of ULXs, the obvious question is: Can one distinguish between these models with ULXs’ X-ray spectra? If so, what are the characteristic spectral features of the individual models? From an accreting IMBH it is generally believed that a multi-color disk blackbody (MCDBB) spectrum with an inner temperature of 0.1 — 0.3 keV (that is, the disk temperature at the innermost stable circular orbit) and possibly a high energy component from Compton up-scattering in a tenuous, hot corona would be a realistic phenomenological description of the spectrum. However, a recent, more detailed analysis of non-LTE accretion flows around IMBHs (Hui, Krolik & Hubeny, 2005) has indicated that the effects of black-hole rotation and Compton scattering within the disk may very well lead to much higher apparent disk temperatures, up to keV, in addition to deviations from conventional MCDBB spectra at both soft and hard X-ray energies due to metal opacity effects.
The continuum spectrum from the photon bubble model might be dominated by the MCDBB spectrum emanating from the HDRs. However, this spectrum might be modified during the radiation transport in the photon bubble cavities. Furthermore, the almost free-streaming radiation of the photon bubbles could be repeatedly Compton-reflected off the surfaces of the HDRs, potentially leading to strong fluorescence lines and/or radiative recombination edges, in addition to Compton reflection features from hard X-ray emission impinging upon the disk from radiation sources external to the disk (Ballantyne, Turner & Blaes, 2004; Ballantyne, Turner & Young, 2005). Such features may be observable, assuming it is not overwhelmed by other radiation sources, in particular the blackbody from the HDRs.
Distinguishing scenarios by spectral modeling is currently very difficult for all but the highest quality ULX data sets, and spectral fitting to these ULX spectra gives contradictory results. For example, Feng & Kaaret (2005) recently performed a detailed spectral and timing analysis of archival XMM-Newton data on 28 ULXs that had sufficient photon statistics to allow for meaningful fitting with models more complicated than a simple power-law. They found that their continuum spectra fell into three general categories: (1) Optically thin bremsstrahlung-dominated, quasi-thermal spectra with temperatures of – 0.8 keV, characteristic for X-ray emission from young supernova remnants; (2) MCDBB spectra of temperatures – 0.4 keV, plus occasionally a hard X-ray power-law, as possible in the case of accretion onto IMBHs; (3) MCDBB spectra at temperatures keV, plus a power-law component dominating at lower energies. Based on these results, Feng & Kaaret (2005) suggest that ULXs may, in fact, not be a homogeneous class of objects. This is in accord with recent results of Madhusudhan et al. (2006) that realistic stellar evolution and population synthesis calculations suggest that the expected rate of captures of massive stars by IMBHs may not be sufficient to produce the total observed number of ULXs. Winter et al. (2006) classified ULXs into low/hard and high/soft states based on their X-ray luminosities and spectra, assuming the ULXs were IMBHs accreting in states similar to galactic X-ray binaries. They found that the high/soft ULXs were grouped around one of two blackbody temperatures: one grouped around keV and one grouped around keV, further indication that ULXs are not a homogeneous group. The long term monitoring of some ULXs such as NGC 5204 X-1 shows that its X-ray spectrum hardens as its flux increases, opposite to what has been observed in Galactic X-ray binaries (Roberts et al., 2006).
Stobbart, Roberts & Wilms (2006) found that 6 out of 13 of the most-observed ULXs were fit approximately equally as well with a cool MCDBB and hard power-law as with a soft power-law and warm MCDBB. Even more surprisingly, they found that most spectra (10 out of 13) were fit best by a cool, keV blackbody and a warmer keV MCDBB, and 11 out of 13 were fit by a cool MCDBB and an optically thick () corona. These spectra could also be explained by a hot, inner (optically thick) plasma sphere and a cool outer disk (Agrawal & Misra, 2006), in which case the cool blackbody temperature could not be directly related to the black hole mass by virtue of the relation between the inner disk temperature and the black hole mass.
In summary, current diagnostics for the distinction between different models for ULXs indicate that ULXs may in fact not be a homogeneous set of physical objects, different models may apply to different sources, and in many cases, observational results are inconclusive. Consequently, more detailed model predictions of various ULX models might be helpful in identifying additional diagnostics which may be used to confirm or rule out such models. In this paper, we investigate detailed spectral features resulting from the photon bubble model, both in the continuum and possible emission line and radiative recombination edge features resulting from the radiative feedback between the HDRs and LDRs. An Fe K line has been observed in M82 X-1 (Strohmayer & Mushotzky, 2003; Agrawal & Misra, 2006); absorption edges have been observed in the 0.1 – 1 keV range in M101 ULX-1 (Kont et al., 2004); and possible edges at keV and keV, and an emission feature at keV has been seen in Holmberg IX X-1 (Dewangan, Griffiths & Rao, 2006). In the ULX M51 X-26 emission features have been seen at 1.8 keV, 3.24 keV, 4.03 keV, and 6.65 keV with Chandra (Terashima & Wilson, 2004) and at 6.4 keV with XMM–Newton (Dewangan et al., 2005). This indicates that the detection of emission lines and/or radiative recombination edges is currently feasible, at least for bright ULXs, and predictions of expected line features from various models will thus be useful as an additional model diagnostic.
Studies of X-ray reflection in inhomogeneous accretion disks have been done by Ross, Fabian & Ballantyne (2002) and Fabian et al. (2002), who found that multiple Compton reflections of emission from a corona above an irregular or corrugated accretion disk in Seyfert galaxies lead to much stronger reflection features than single reflections. Merloni et al. (2006) considered Compton reflection in a radiation–dominated inhomogeneous accretion disk. Their disk was a low density Comptonizing plasma with high density clumps off of which radiation was reflected. Their simulations produced lines which may be visible in narrow line Seyfert 1 galaxies, although detection may be difficult due to interstellar absorption. So far, investigations of photon bubbles in ULXs have focused on radiation–hydrodynamics (see, e.g., Ruszkowski & Begelman, 2003; Turner et al., 2005) leaving the expected spectral features essentially unexplored. Ballantyne, Turner & Blaes (2004) and Ballantyne, Turner & Young (2005) studyed X-ray reflection off accretion disks in the photon bubble model for Seyfert galaxies, but using an unspecified external irradiating hard X-ray source, such as a tenuous, hot corona above the accretion disk surface, while we are focusing on the self-consistent local radiation feedback between the HDRs and LDRs within the inhomogeneous accretion flow. Furthermore, those authors did not explore parameters appropriate for ULXs.
In this paper we make predictions of the X-ray spectra from the photon bubble model of ULXs with a Monte Carlo/Fokker-Planck code coupled with the XSTAR program for X-ray reprocessing in the HDRs (reflection). We will be primarily interested in predictions of spectral features in addition to a warm MCDBB and soft power-law component, although this is not a study of any individual object. In addition we make predictions of a power-law component that extends above 10 keV which may not be detectable by Chandra or XMM-Newton but may be by Suzaku or future telescopes.
2 Model Setup
The simulation parameters were based on solutions found in Begelman (2001) and Begelman (2002). We summarize these solutions in § 2.1, and describe the simulation technique in § 2.2.
2.1 Disk Distribution
The physical picture emerging from numerical simulations of the photon bubble instability (Ruszkowski & Begelman, 2003; Turner et al., 2005) points towards a propagating pattern of slab-like shock trains (the HDRs) slanted with respect to the plane of the accretion disk. A solution to the disk structure has been derived by Begelman (2002), who found the relevant disk parameters to depend on: the accretion rate, , , the ratio of the HDR’s gas pressure to the magnetic pressure, and , the Shakura-Sunyaev viscosity parameter. Here is the opacity (assumed to be dominated by Thomson scattering; 0.4 cm2 g-1), is the speed of light, is the gravitational constant, and is the mass of the black hole; We used his solution to set up our simulations. Throughout this work we assumed and (resulting in an Eddington luminosity of erg s-1).
The Eddington enhancement factor, the ratio of the disk’s flux to the Eddington flux, is:
| (1) |
where is the geometric average of the LDR and HDR densities; is the distance from the black hole in terms of gravitational radii (); is the ratio of the height to the radius (); and . Begelman (2002) derives the following equation for :
| (2) |
Note that in Eqn. 2 we corrected a typographical error in Eqn. 13 of Begelman (2002). Based on Begelman (2002)’s expression for the average density, and equation 1, the following equations were derived for the densities in the HDR and LDR:
| (3) |
| (4) |
Although these densities refer to the disk midplane, the Shakura & Sunyaev (1973) solution for a radiation-dominated accretion disk shows that the density will be essentially constant in the vertical direction. Thus, we consider these densities to be the density at the photosphere. The temperature for the HDRs was found by assuming that all the gravitational potential energy is released in the HDRs, and thus, the flux emitted at the photoplane is set equal to the blackbody flux. This gives the Shakura & Sunyaev (1973) expression:
| (5) |
The “wavelength” of the plane-parallel shocks—i.e., this distance between HDRs—is given by
| (6) |
For the proton temperature in the LDRs, the virial temperature was used:
| (7) |
where is the proton’s mass.
The electron temperature in the LDR is expected to be significantly lower than the proton temperature due to Compton cooling by radiation from the HDRs. The LDR’s electron temperature was determined by implicitly solving a Fokker-Planck equation with the MC/FP code; see § 2.2 below. The magnetic field in the LDR was determined by assuming it to be in equipartition with the electrons.
The Eddington ratio is dependent on radius (equation 1), so for a given disk, outside of a certain radius () , and the disk becomes a homogeneous, Shakura-Sunyaev disk. Outside of this radius, the disk was represented by MCDBB with .
2.2 Simulation Description
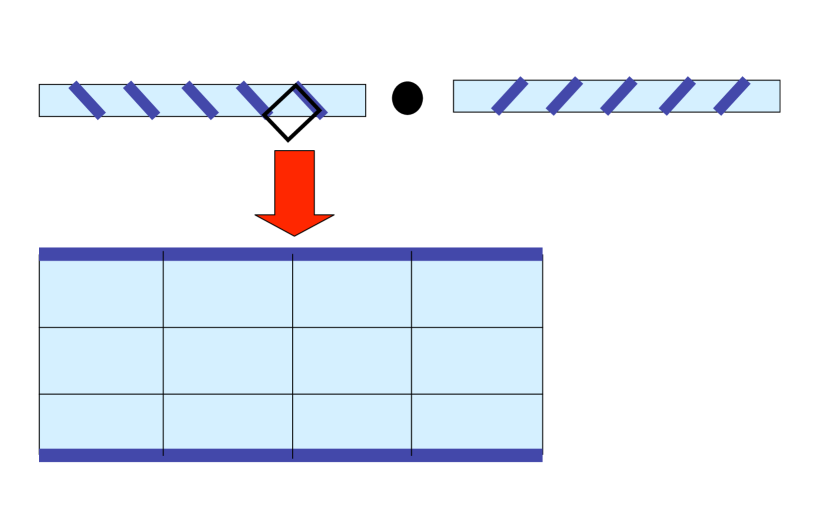
Equations 2 through 7 were used to determine the simulation parameters at various radii. To find the total spectrum of the disk, simulations were run at evenly-spaced radii and the results were averaged, weighted by disk area. At each radius, we simulated one individual LDR sandwiched by two HDRs in a plane-parallel geometry (see Fig. 1). Within the plane-parallel geometry the LDR is divided into 40 zones, 4 radial and 10 vertical. It seems reasonable to assume, that, since is much smaller than the radiation pressure scale height (Begelman, 2002), that the fraction of photons which escape (given by the ratio of the escape area to the region’s total surface area), will be %. Larger escape fractions could lead to smaller ionization parameters and greater reflection components, however, this was not explored in this work. Multiple Compton reflections are certainly possible with such a small escape fraction, however for nearly all of our cases, the reflected component was completely drowned out by the blackbody; see below. As a result, further iterations did not produce significantly different spectra.
The radiation transfer and self-consistent balance between electron heating and cooling within the LDR are simulated with the two-dimensional Monte Carlo/Fokker-Planck (MC/FP) code described in Böttcher, Jackson & Liang (2003) and Böttcher & Liang (2001). This code uses the Monte Carlo method of Pozdnyakov, Sobol & Sunyaev (1983) for Compton scattering and the implicit Fokker-Planck method of Nayakshin & Melia (1998) for the evolution of the electron distribution in a two-temperature plasma with a given proton temperature. In each zone, the Fokker-Planck equation is implicitly and independently solved. The Fokker-Planck technique takes into account heating/cooling by Coulomb/Møller interactions, Compton scattering, synchrotron/cyclotron processes.
Initially, the emission emanating from the HDRs was represented by blackbody spectra inserted at the upper and lower boundaries. Photons were also produced by synchrotron/cyclotron processes in the LDRs. Photons were subjected to Compton scattering and reflection off the HDRs. Escaping photons at the outer boundaries were added to an event file for later spectral extraction; this involves placing each escaping photon in a particular energy bin.
The proton temperature in the LDR was calculated from equation 7, and the electron temperature was calculated numerically within the MC/FP simulation (see Nayakshin & Melia, 1998; Böttcher, Jackson & Liang, 2003; Böttcher & Liang, 2001; Finke & Böttcher, 2005), which was run until the electron temperature reached a stable equilibrium. The MC/FP simulation was run to extract the photon flux and spectrum incident on the boundaries between the HDRs and the LDR. To calculate the expected spectral features from fluorescence line emission, radiative recombination, and Compton reflection, the impinging spectrum was used as an input into the latest version of XSTAR (Kallman & Bautista, 2001). Solar abundances of the most profuse astrophysical elements (H, He, C, Ca, N, O, Ne, Mg, Si, S, Ar, Ca and Fe) were assumed in the HDR, based on Grevesse, Noels & Sauval (1996). XSTAR was run in constant pressure mode; the pressure was calculated from the specified density and the ideal gas law. The main parameter in determining the reflection spectrum’s shape and intensity is the ionization parameter:
| (8) |
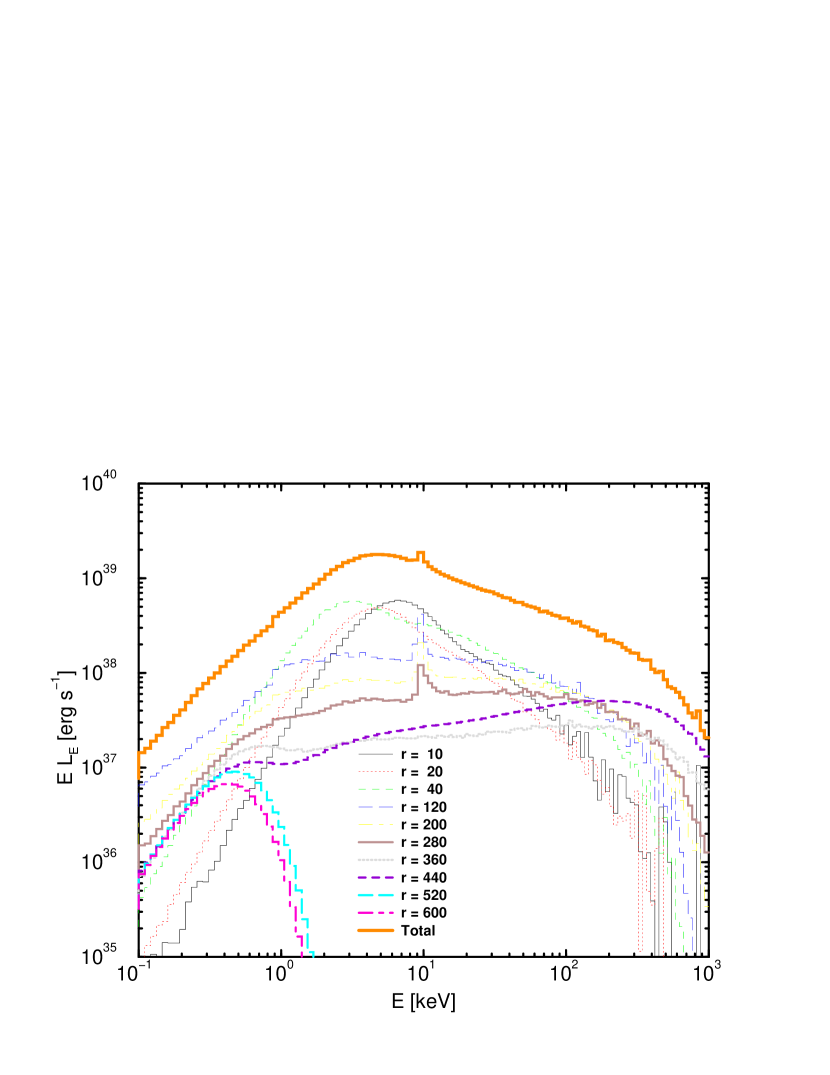
Note that XSTAR uses the flux calculated between 1 and 1000 Ry (13.6 eV to 13.6 keV). In order to circumvent XSTAR’s limitation to densities cm-3, the impinging flux was re-scaled to keep the ionization at the value corresponding to the physical situation. The inverse flux scaling was applied to the XSTAR output spectrum. Keeping constant insures that the scaling of a flux dominated by recombination features, is properly recovered. Testing of XSTAR with various densities but the same seems shows that this is appropriate for the energy range of interest. The resulting reflection spectrum was then added to the intrinsic blackbody from the HDR as boundary sources in a second run of the MC/FP code for the final evaluation of the emanating X-ray spectrum. For an example of a simulation, with spectra at different radii, see Fig. 2.
3 Results
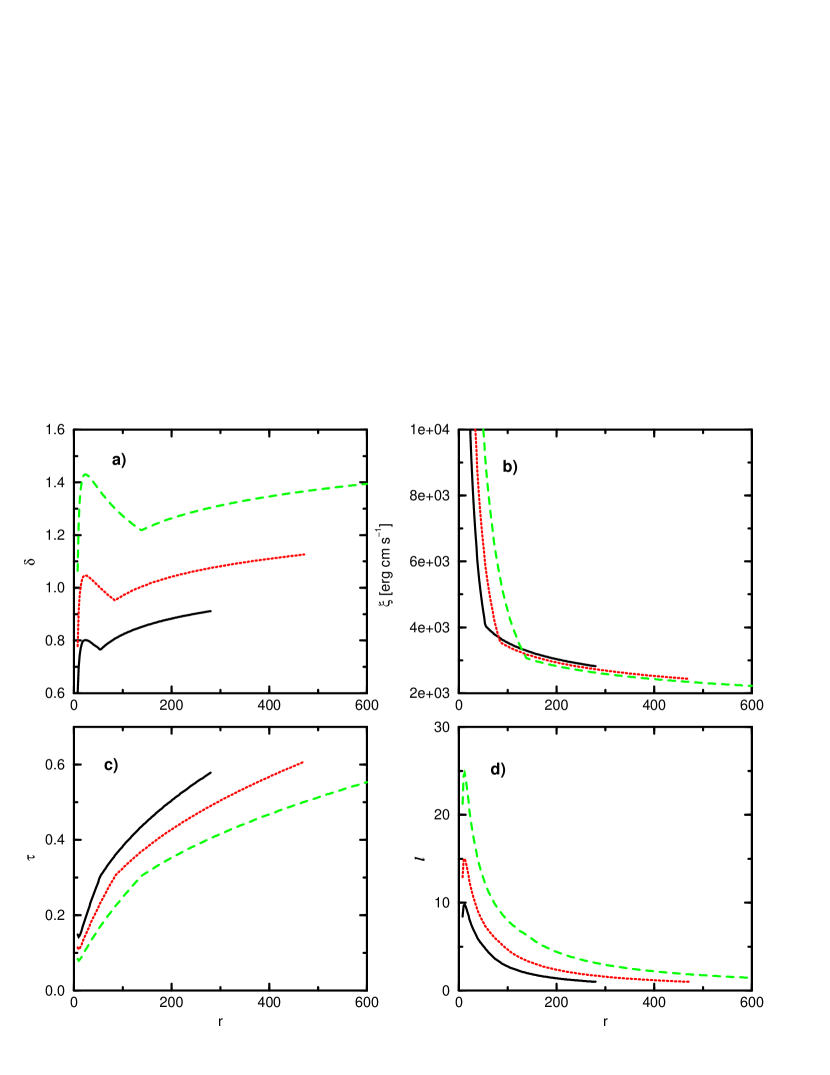
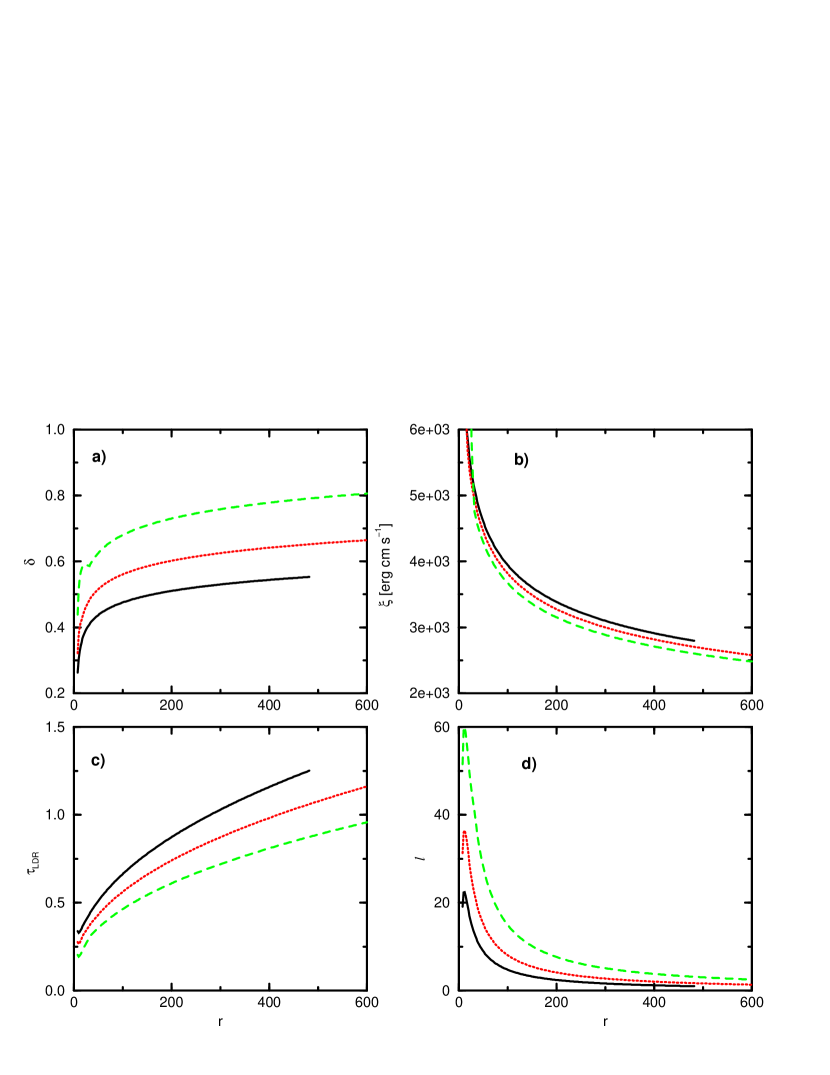
The simulation parameters and fit results can be seen in Table 1. The important disk parameters and are plotted as a function of radius in Figs. 3 to 5.
The transition between the expressions for (Eqn. 2) can be readily seen in panel (a) of Fig. 3, with the first expression being used at lower radii. At higher , the transition occurs at lower radii, or not at all. Note that several simulations violate the thin-disk condition (), especially the high and/or low ones. These solutions should thus be viewed with caution.
The ionization parameter decreases with radius, as is observed in our simulations, seen in panel (b) of Figs. 3 to 5. At no point does drop below erg cm s-1, so the reflection component will be small ( of the total) for all cases.
The optical depth, , is proportional to , and is essentially always increasing with . Thus the spectra have more luminosity from Comptonization at larger radii. It is also larger for smaller accretion rates due to its dependence () by virtue of increasing with increasing . Thus we expect a greater Comptonization component for smaller . We can see that for our simulations, this is in fact the case (Fig. 6). We can also see in Table 1 that the fractional power emitted through Comptonization decreases with increasing , as expected. This also corresponds to the decrease in , the photon index () with increasing . One can also see in Figs. 3—5 that as increases, increases. Again, this is because , and as increases, decreases.
The ratio peaks at , as can be seen in panel (d) of Figs. 3– 5. This is close to where the peak flux is expected in a typical Shakura-Sunyaev accretion disk. Also note that increases with increasing , as one would expect from eqn. 1 ().
For each simulation, the total reflection component from XSTAR was summed up for all radii. The soft X-ray spectra were fit with a MCDBB. The MCDBB and reflection components were subtracted from the total spectra revealing the Comptonization components. This component was fit with a power-law and exponential cutoff () above 25 keV. The results of this decomposition and fits are summarized in Table 1; the individual fit components for the simulations can be seen in Fig. 7. Note that these fit components are the sum of the simulations at all radii. The only simulation that has a significant reflection feature visible in its spectrum is Sim. 2, with a blended Fe XXV/XXVI feature at with an equivalent width of eV, and an edge at (O K). This simulation also has the highest fraction of its emission from the reflection component. One can see in Fig. 2 that the reflection component is strongest at —280.
In Fig. 2, one can see that the Comptonization component gets stronger at larger radii, as one would expect with the increasing optical depth. The overall spectra are generally dominated by the high-energy Comptonization component, especially for higher . The Comptonization component in many cases extends far down in photon energy into the few keV range and often dominates the total bolometric luminosity, even when the total spectrum appears to be dominated by a thermal soft X-ray component.
This component contributes to the spectra even at low energies, down to , as seen in Fig. 7. In Fig. 2, one can see that the Comptonization component gets stronger at larger radii, as one would expect with the increasing optical depth. This explains the significant Comptonization component to the lower energy part of the spectrum. Eventually, though, one gets to the radius where photon bubbles can no longer be sustained (), and there is no longer a Comptonization component, as seen in in Fig. 2. Results for other simulations are similar to Fig. 2. As increases, the increases, as can be seen in Figs. 3—5 and Table 1.
Spectral pivoting can be seen in the all of the simulations in Fig. 6. This is due to the approximately same amount of luminosity in the Compton components of the different simulations. The energy dissipated in the LDRs is related to the proton temperature, which in our simulations does not depend on accretion rate. This is not an unrealistic assumption, as one would not expect the protons to radiate significantly. However, when the LDRs become more optically thick the energy dissipation becomes more efficient due to multiple Compton scatterings.
4 Discussion
Our simulations explore 0.5–10 keV luminosities up to erg s-1 which does not include some of the brightest ULXs. For our setup, luminosities much greater than this will violate the thin disk condition, except possibly for the highest value of . It does not seem likely that photon bubbles could support much greater luminosities.
Our results are significantly different from previous, similar works. Merloni et al. (2006) perform similar calculations for a low density accretion region with imbedded optically thick clumps and considered reflection between these clumps. They used ionization parameters comparable to ours ( erg cm s-1, among others) and achieved much stronger reflection components with no feature. This is a consequence of the substantially lower temperature of the soft blackbody (ultraviolet) photons used as an input into the Comptonization scheme in their model: their Comptonization component extends down to energies (in contrast to a few keV in our case). For comparable , calculated from the 1—1000 Ry flux the number of photons above the Fe K edge is thus much smaller than in our case. Therefore, heavy metals are almost fully ionized in most of our simulations, leading to weak or absent line features and a relatively weak Compton reflection component. Ballantyne, Turner & Blaes (2004) explored reflections from a hot corona off of an inhomogeneous disk and found the spectrum can differ significantly from reflection off a homogeneous disk. They also had stronger reflection features than our results, due to lower ionization parameters, and no feature.
Feng & Kaaret (2005) and Stobbart, Roberts & Wilms (2006) fit ULXs’ X-ray spectra with various models; when fit with a MCDBB or MCDBB and low-energy blackbody, their fits had inner disk temperatures similar to ours. However, we find that our model is unable to explain a soft-excess. We note that no feature has been detected in the spectra of ULXs, although features at other energies have been detected (Strohmayer & Mushotzky, 2003; Agrawal & Misra, 2006; Kont et al., 2004; Dewangan, Griffiths & Rao, 2006), although these features could originate from a wind rather than reflection features in the disk. ULX observations above by, Suzaku or the next generation of hard X-ray imaging instruments might be able to detect the hard power-laws we predict, although we realize such observations would be difficult. Suzaku observations of two ULXs in NGC 1313 did not detect any component above 10 keV above the background (Mizuno et al., 2007), although their MCDBB + power-law fits do seem to agree with our spectra, and the variability of these sources is much less than observed in Galactic black hole candidates.
Unfortunately, our simulations do not reproduce a soft excess as has been observed in many ULXs. It is possible that the soft excess originates from Compton downscattering of radiation by wind (e.g., Begelman, 2001), and so a lack of its production in our simulations does not disprove the photon bubble model for ULXs.
If the excess is explained, our model could explain ULXs well fit with a keV blackbody. Higher energy observations ( keV) could determine this; if they found a stable hard X-ray power-law 2—2.4 for a long period of time, this would be evidence for the photon bubble model in ULXs, due to the fact that a lower mass compact object would have less variability (Kalogera et al., 2004). A feature could also be considered a signature of photon bubbles in ULXs; it has not been found in any other simulation of accreting black holes.
We note that our spectra are similar to the very high state of X-ray binaries such as GX 339-4 (Belloni et al., 2006) and GRO J1655-40 (Saito et al., 2006), which have similar photon indices as found in our simulations. For smaller accretion rates, the photon bubble model may be a viable model to explain the very high state of X-ray binaries.
Since this is an exploratory study, we have made a number of simplifying assumptions. We have assumed a plane-parallel geometry; zones could be corrugated or vary in random ways, which could lead to multiple reflections, increasing the reflection component (Fabian et al., 2002). We have assumed constant densities across LDRs. This may alter the Comptonizing region of the spectra, but probably would not lead to significant differences. We have completely neglected several items. Taking into account General Relativistic effects could gravitationally broaden the spectrum. However, most of the emission originates at , too far out to be greatly affected by GR. We have assumed and to be constant in the vertical direction, neglecting color corrections; this may be validated by the more detailed vertical solution of Begelman (2006), who found that the corrections should be minor. Time variability is beyond the scope of this study and is poorly understood, and thus would involve poorly constrained parameters. It is also possible that the spectra could be modified by further Comptonization in a corona above the disk, which we have also neglected. This would make the spectra even harder than they already are, possibly too hard to match observations. However, recent magnetohydrodynamic simulations have shown difficulties in creating coronae (Hirose, Krolik, & Stone, 2006) and the photon bubble model may be an alternative to the standard disk-corona geometry. Future simulations could take advantage of more detailed analytic solutions (e.g., Begelman, 2006) and hydrodynamic simulations (e.g., Turner et al., 2005) and could include reprocessing in a corona and/or a disk wind.
References
- Agrawal & Misra (2006) Agrawal, V. K. & Misra, R., 2006, ApJ, 638, L83
- Arons (1992) Arons, J., 1992, ApJ, 388, 561
- Ballantyne, Turner & Blaes (2004) Ballantyne, D. R., Turner, N. J. & Blaes, O. M., 2004, ApJ, 603, 436
- Ballantyne, Turner & Young (2005) Ballantyne, D. R., Turner, N. J., & Young, A. J., 2005, ApJ, 619, 1028
- Begelman (2001) Begelman, M. C., 2001, ApJ, 551, 897
- Begelman (2002) Begelman, M. C., 2002, ApJ, 568, L97
- Begelman (2006) Begelman, M. C., 2006, ApJ, 643, 1065
- Belloni et al. (2006) Belloni, T., et al., 2006, ApJ, 367, 1113
- Böttcher, Jackson & Liang (2003) Böttcher, M., Jackson, D. R., & Liang, E. P., 2003, ApJ, 586, 339
- Böttcher & Liang (2001) Böttcher, M. & Liang, E. P., 2001, ApJ, 552, 248
- Colbert & Mushotzky (1999) Colbert, E. J. M., & Mushotzky, R. F., 1999, ApJ, 519, 89
- Colbert & Ptak (2002) Colbert, E. J. M., & Ptak, A. F., 2002, ApJS, 143, 25
- Cropper et al. (2004) Cropper, M., Sorio, R., Mushotzky, R. F., Wu, K., Markwardt, C. B., & Pakull, M., 2004, MNRAS, 349, 39
- Dewangan et al. (2005) Dewangan, G. C. et al., 2005, ApJ, 635, 198
- Dewangan, Griffiths & Rao (2006) Dewangan, G. C., Griffiths, R. E., & Rao, A. R., 2006, ApJ, 641, L125
- Dewangan, Titarchuk, & Griffith (2006) Dewangan, G., Titarchuk, L., & Griffiths, R. E., 2006, ApJ, 637, L21
- Fabian et al. (2002) Fabian, A. C., Ballantyne, D. R., Merloni, A., Vaughan, S., Iwasawa, K., & Boller, Th., MNRAS, 331, L35
- Fabbiano (1988) Fabbiano, G., 1988, ApJ, 330, 672
- Fabbiano et al. (2003) Fabbiano, G., Zezas, A., King, A. R., Ponman, T. J., Rots, A., & Schweizer, F., 2003, ApJ, 584, L5
- Feng & Kaaret (2005) Feng, H., & Kaaret, P., 2005, ApJ, 633, 1052
- Finke & Böttcher (2005) Finke, J. D. & Böttcher, M., 2005, PASP, 117, 483
- Gammie (1998) Gammie, C. F., 1998, MNRAS, 297, 929
- Georganopoulos, Aharonian & Kirk (2002) Georganopoulos, M., Aharonian, F. A., & Kirk, J. G., 2002, A&A, 388, L25
- Grevesse, Noels & Sauval (1996) Grevesse, N., Noels, A., & Sauval, A., 1996, in “Cosmic Abundances” ASP Conference Series, 99, S. Hold & G. Sonneborn, eds.
- Gutierrez (2006) Gutierrez, C. M., 2006, ApJ, 640, L17
- Hirose, Krolik, & Stone (2006) Hirose, S, Krolik, J. H., & Stone, J. M., 2006, ApJ, 640, 901
- Hui, Krolik & Hubeny (2005) Hui, Y., Krolik, J. H., & Hubeny, I., 2005, ApJ, 625, 913
- Kallman & Bautista (2001) Kallman, T., & Bautista, M. 2001, ApJS, 133, 221
- Kalogera et al. (2004) Kalogera, V., Henninger, M., Ivanova, N., & King, A. R., 2004, ApJ, 603, L41
- King et al. (2001) King, A. R., Davies, M. B., Ward, M. J., Fabbiano, G., & Elvis, M., 2001, ApJ, 552, L109
- Kont et al. (2004) Kong, A. K. H., Di Stefano, R., & Yuan, F., 2004, ApJ, 617, L49
- Körding, Falcke & Markoff (2002) Körding, E., Falcke, H., & Markoff, S., 2002, A&A, 382, L13
- Liu & Mirabel (2005) Liu, Q. Z., & Mirabel, I. F., 2005, A&A 429, 1125
- Madhusudhan et al. (2006) Madhusudhan N., Justham, S., Paxton, B., Pfahl, E., Podsiadlowski, Ph., & Rappaport, S., 2006, ApJ, 640, 918
- Makishima et al. (2000) Makishima K. et al., 2000, ApJ, 535, 632
- Markowitz et al. (2003) Markowitz, A., et al., 2003, ApJ, 593, 96
- Matsumoto et al. (2001) Matsumoto, H., Tsuru, T. G., Koyama, K., Awaki, H., Canizares, C. R., Kawai, N., Matsushita, S., & Kawabe, R., 2001, ApJ, 547, L25
- Merloni et al. (2006) Merloni, A., Malzac, J., Fabian, A. C., & Ross, R. R., 2006, MNRAS, 370, 1699
- Mizuno et al. (2007) Mizuno, T., et al., 2007, PASJ, 59, 257
- Nayakshin & Melia (1998) Nayakshin, S., & Melia, F., 1998, ApJS, 114, 269
- Pakull & Mirioni (2003) Pakull, M. W., & Mirioni, L., 2003, RevMexAA, 15, 197.
- Pozdnyakov, Sobol & Sunyaev (1983) Pozdnyakov, L. A., Sobol, I. M., & Sunyaev, R. A., 1983, Astrophys. Space Phys. Rev., 2, 189
- Roberts et al. (2006) Roberts, T. P., Kilgard, R. E., Warwick, R. S., Goad, M. R., & Ward, M. J., 2006, MNRAS, 371, 1877
- Ross, Fabian & Ballantyne (2002) Ross, R. R., Fabian, A. C., & Ballantyne, D. R., 2002, MNRAS, 336, 315
- Ruszkowski & Begelman (2003) Ruszkowski, M. & Begelman, M. C., 2003, ApJ, 586, 384
- Saito et al. (2006) Saito, K., Yamaoka, K., Fukuyama, M., Miyakawa, T. G., Yoshida, A., & Homan, J., (2007), in “Sixth Microquasar Workshop: Microquasars and Beyond”, astro-ph/0702022
- Shakura & Sunyaev (1973) Shakura, N. I., & Sunyaev, R. A., 1973, A&A, 24, 337
- Stobbart, Roberts & Wilms (2006) Stobbart, A.-M., Roberts, T. P., & Wilms, J., 2006, MNRAS, 368, 397
- Strohmayer & Mushotzky (2003) Strohmayer, T. E. & Mushotzky, R. F., 2003, ApJ, 586, L61
- Terashima & Wilson (2004) Terashima, Y. & Wilson, A. S., 2004, ApJ, 601, 735
- Turner et al. (2005) Turner N. J., Blaes, O. M., Socrates, A., Begelman, M. C., & Davis, S. W., 2005, ApJ, 624, 267
- Winter et al. (2005) Winter, L. M., Mushotzky, R. F., & Reynolds, C. S., 2005, in “El Escorial X-ray Universe 2005 meeting”, astro-ph/0511493
- Winter et al. (2006) Winter, L. M., Mushotzky, R. F., Reynolds, C. S., 2006, ApJ, 649, 730
| Sim. No. | [keV] | [keV] | |||||||||
|---|---|---|---|---|---|---|---|---|---|---|---|
| 1 | 200 | 0.01 | 1.4 | 280 | 2.8 | 1.3 | 2.18 | 460 | 0.22 | 0.73 | 0.05 |
| 2 | 400 | 0.01 | 1.6 | 472 | 4.4 | 2.5 | 2.42 | 440 | 0.26 | 0.63 | 0.11 |
| 3 | 900 | 0.01 | 2.0 | 860 | 6.9 | 4.7 | 2.42 | 290 | 0.56 | 0.40 | 0.05 |
| 4 | 200 | 0.1 | 1.4 | 482 | 5.0 | 1.7 | 1.96 | 280 | 0.17 | 0.82 | 0.01 |
| 5 | 400 | 0.1 | 1.6 | 804 | 6.5 | 2.9 | 2.12 | 220 | 0.27 | 0.74 | 0.01 |
| 6 | 900 | 0.1 | 2.0 | 1456 | 9.4 | 5.3 | 2.24 | 140 | 0.39 | 0.59 | 0.02 |
| 7 | 200 | 0.5 | 1.4 | 698 | 5.8 | 1.8 | 1.75 | 190 | 0.14 | 0.85 | 0.01 |
| 8 | 400 | 0.5 | 1.6 | 1164 | 8.5 | 3.1 | 1.78 | 160 | 0.17 | 0.79 | 0.05 |
| 9 | 900 | 0.5 | 2.0 | 2100 | 11.9 | 5.6 | 1.95 | 160 | 0.31 | 0.68 | 0.02 |