The Distance to SS 433/W50 and its Interaction with the Interstellar Medium
Abstract
The distance to the relativistic jet source SS 433 and the related supernova remnant W50 is re-examined using new observations of H I in absorption from the VLA, H I in emission from the GBT, and 12CO emission from the FCRAO. The new measurements show H I in absorption against SS 433 to a velocity of 75 km s-1 but not to the velocity of the tangent point, which bounds the kinematic distance at kpc. This is entirely consistent with a kpc distance determined from light travel-time arguments (Blundell & Bowler, 2004). The H I emission map shows evidence of interaction of the lobes of W50 with the interstellar medium near the adopted systemic velocity of km s-1. The western lobe sits in a cavity in the H I emission near the Galactic plane, while the eastern lobe terminates at an expanding H I shell. The expanding shell has a radius of 40 pc, contains M☉ of H I and has a measured kinetic energy of ergs. There may also be a static H I ring or shell around the main part of W50 itself at an LSR velocity of 75 km s-1, with a radius of 70 pc and a mass in H I of M☉. We do not find convincing evidence for the interaction of the system with any molecular cloud or with H I at other velocities. The H I emission data suggest that SS 433 lies in an interstellar environment substantially denser than average for its distance from the Galactic plane.
This Population I system, now about 200 pc below the Galactic plane, most likely originated as a runaway O-star binary ejected from a young cluster in the plane. Given a modest ejection velocity of km s-1, the binary could have reached its present location in Myr at which time the more massive member became a supernova. New astrometric data on SS 433 show that the system now has a peculiar velocity of a few tens of km s-1 in the direction of the Galactic plane. From this peculiar velocity and the symmetry of the W50 remnant we derive a time since the SN of yr.
keywords:
ISM: H I — SNR: individual (W50) — ISM: jets and outflows — stars: individual (SS 433) — supernova remnants1 Introduction
From its discovery as an eclipsing X-ray binary star emitting relativistic jets, the distance to SS 433 and the W50 supernova remnant (SNR) in which it is embedded has been somewhat uncertain. The peculiar and exciting properties of this system were first described by Margon et al. (1979), who estimated its kinematic distance as 3.5 kpc from observations of the velocity of highly saturated foreground interstellar NaII lines and a straightforward model for Galactic rotation. As the properties of SS 433 became better understood — it is a compact object in a binary system ejecting relativistic jets along an axis which precesses through small angles — the determination of its distance became more important in fixing the physical size of the observed phenomena. From a measurement of the proper motion of individual radio structures within the SS 433 jets, and the assumption of a constant jet velocity, Hjellming & Johnston (1981a, b) derived a distance of kpc, which was soon adopted as the canonical value for the system (Margon, 1984).
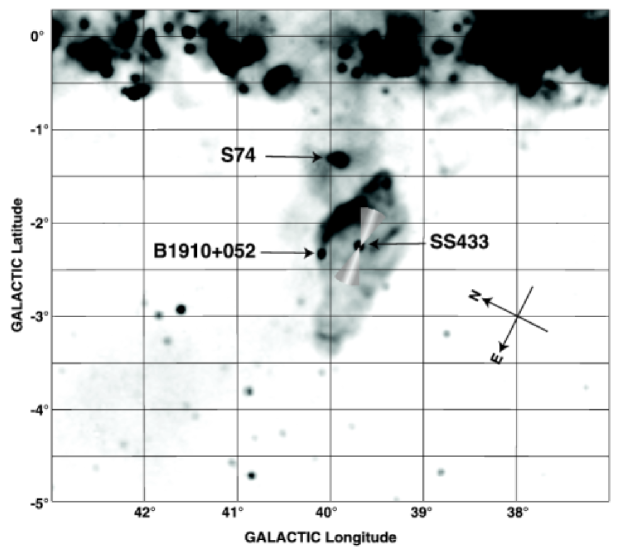
Figure 1 shows SS 433 and W50 in relation to the Galactic plane and other objects in the same part of the sky. SS 433 is located at , in the centre of the radio continuum source W50, which is thought to be either a supernova remnant or a stellar wind bubble (Königl, 1983). The SS 433 system consists of a compact object surrounded by an accretion disc and a ‘donor’ star, of (Hillwig et al., 2004). Material from the donor star passes to an accretion disc surrounding the compact object and generates two relativistic jets moving at 0.26c in opposite directions which have apparently created the lobes (or “ears”) punched through the rim of the circular SNR W50 (Begelman et al., 1980; Margon, 1984). The jet axis precesses with a cone opening angle of around a position angle of (Margon, 1984; Stirling et al., 2002), though at their maximum extent they show evidence of having been collimated to an effective opening angle (Brinkmann et al., 2006). The jet closer to the Galactic plane is usually referred to as the ‘Western’ jet and the other as the ‘Eastern’. The presence of a (hence young) star in SS 433 clearly marks this system as part of Population I, a classification whose implications we will discuss in .
The stellar component of SS 433 cannot be assigned a distance from traditional spectro-phometric or kinematic techniques: the nature of the donor star is still uncertain (Fuchs et al., 2006), as is the extinction, while the optical systemic radial velocity of km s-1 () may have a significant random component acquired during the supernova (SN) (Hillwig et al., 2004). But as a radio source, SS 433 can be used as a target for H I absorption measurements: the kinematics of the intervening gas seen in absorption can provide limits on the location of SS 433, limits which are not likely to be affected by conditions close to the source itself (Murdin, Clark, & Martin, 1980). Such measurements were first made by van Gorkom, Goss, & Shaver (1979) and showed that SS 433, and by implication the entire W50 remnant, absorbed H I only at a km s-1, which limits the kinematic distance to kpc. The authors noted that their measurements might be consistent with a kinematic distance of as much as 4.7 kpc, but this rather uncertain upper limit was rendered less probable by subsequent observations of H I absorption toward the extragalactic radio continuum source B1910+052 only from SS 433 (Fig. 1), which has a rich absorption spectrum at all velocities up to the maximum allowed from Galactic rotation (Dickey et al., 1983). This implies that if SS 433 were actually 5 kpc from the Sun, H I should be seen in absorption against it to at least 75 km s-1, more than 20 km s-1 higher than was detected. (Throughout this paper velocities are given with respect to the LSR defined from “Standard Solar Motion” (Delhaye, 1965) unless otherwise noted.)
Observations of 12CO from molecular gas added to the puzzle. SS 433/W50 lies more than 2 degrees from the Galactic plane, an uncommonly large latitude for Population I objects in the inner Galaxy except for those quite near to the Sun. Observations of 12CO showed that there is a large molecular cloud covering SS 433 with a velocity in the range 27–36 km s-1 and an implied distance of 2.2 kpc (Huang, Dame & Thaddeus, 1983; Yamamoto et al., 1999), though the ‘far’ kinematic distance of kpc might also be possible. The 12CO data did not show strong kinematic or morphological evidence for an interaction between W50 and the molecular cloud, but the coincidence of an SNR and molecular cloud from the Galactic plane was thought to make their association likely. Furthermore, the HII region S74 lies projected on the edge of the W50 remnant (Fig. 1), between the remnant and the Galactic plane. S74 is associated with 12CO emission at 48 km s-1 and the spectro-photometric distance to its exciting star is reported as kpc (Brand & Blitz, 1993; Forbes, 1989), though the quality of this distance determination is unclear. At a distance of 2.1 kpc S74 is about 50 pc below the plane, well within the range of displacements of HII regions in the inner Galaxy (Lockman, Pisano, & Howard, 1996). SS 433/W50 might thus plausibly be connected with S74, another Population I object, were they actually near each other along the line of sight.
The energetic event which produced the W50 remnant, and the action of the SS 433 jets, should leave some mark on the interstellar medium (ISM), for most of the kinetic energy of the jets is not radiated (Brinkmann et al., 2006). A study of the H I emission around W50 at angular resolution (Dubner et al., 1998) reported evidence of an interaction between W50 and the neutral ISM at velocities ranging from 35 to 50 km s-1. Dubner et al. (1998) combined their data with previous H I measurements toward W50 (Koo & Heiles, 1991), to propose a model in which W50 has a systemic velocity of km s-1 and is surrounded by a shell of H I expanding at km s-1. The kinematic distance proposed for SS 433/W50 by Dubner et al. is kpc.
Recently a new distance estimate for SS 433 has been derived by Blundell & Bowler (2004), who fitted a high-resolution radio observation of the SS 433 jets to a projection of the standard kinematic model over two complete precession cycles of the jets, and analyzed asymmetries in the radio structure over arc-second scales caused by light-travel time effects. They find a distance of kpc, which differs by as much as a factor from distance estimates based on the association between SS 433/W50 and interstellar matter.
The discrepancy has prompted us to obtain new H I absorption, H I emission and 12CO measurements of the SS 433/W50 system to reassess the contradictory evidence. In this paper we discuss the Galactic kinematics in the direction of SS 433, present the new H I and CO data, then show that they are entirely consistent with a distance of 5.5 kpc for the system. We also find evidence in the new H I emission data for interaction between SS 433/W50 and the ambient ISM, for a static ring or H I shell around W50, and for an expanding H I shell which may be ‘fossil’ evidence that the Eastern jet of SS 433 once extended past the current boundries of the radio continuum source.
2 Observations
2.1 VLA H I Absorption Measurements
The Very Large Array (VLA) of the NRAO was used to observe SS 433 during two periods of about 40 minutes each on 5 June 1998 when it was being moved from A to B configuration. The nearby 1.2-Jy object J1950+081 was used as a phase calibration source. The bandpass and total flux density scale were calibrated by observations of 3C48. The first observations were made with a velocity coverage of 160 km s-1 at a resolution of 1.29 km s-1 over 127 channels. The synthesized beam is at a position angle of . The rms noise per channel is 3.5 mJy/beam while the continuum peak is 612 mJy/beam. During the second set of independent observations the bandwidth was twice as large, giving a velocity resolution of 2.58 km s-1, an rms noise of 3.0 mJy/beam, and angular resolution of at a position angle of for this epoch. The continuum peak at this resolution is 750 mJy/beam. The rms noise in H I opacity per channel is about 0.004 for both sets of observation.
2.2 GBT H I Emission Measurements
An image in the 21-cm emission line of H I was constructed for the region around SS 433 using archival data from the Robert C. Byrd Green Bank Telescope (GBT) as well as observations made specifically for this project with the GBT. In all cases the spectra cover about 500 km s-1 in total, centred at km s-1 with a channel spacing of 1.03 km s-1 and an effective velocity resolution of 1.25 km s-1. The region around W50 was mapped by making a series of scans in Galactic longitude at a fixed latitude. Spectra were measured every in both coordinates. Each position was observed for . The data were gridded to a final resolution of , slightly finer than Nyquist sampling for the angular resolution of the GBT. The ‘on-the-fly’ observing and subsequent gridding gave the final maps an effective angular resolution of in Galactic longitude and latitude, respectively. A 2nd order polynominal was fitted to emission-free regions of the spectra, and the rms noise in the final spectra is 0.10 K.
The H I emission associated with SS 433 is relatively bright, so stray radiation from GBT sidelobes (Lockman & Condon, 2005) should not be an issue here. There was, however, a small error in the velocity tracking while observing some portions of the mapped region, which resulted in an km s-1 error in the velocity scale of many spectra. This is of a velocity channel width, but it can vary systematically from row to row, and can be seen as a faint striping when there are strong gradients in . For quantitative purposes this problem is negligible, but it does occur in some of the images.
2.3 FCRAO Emission Map
The 12CO data were obtained for us by C. M. Brunt and M. H. Heyer using the 14 m telescope of the Five College Radio Astronomy Observatory (FCRAO) with the SEQUOIA 32 pixel focal plane array. An area about centred on SS 433 was fully sampled at an angular resolution of , and the data were gridded into a cube with a pixel size of . Spectra cover 65 km s-1 from 7.5 to 72.5 km s-1 at a velocity resolution of 0.063 km s-1, though for this paper we smoothed the spectra to a velocity resolution of 0.25 km s-1. The rms noise in the spectra is about 0.4 K. Further information on the FCRAO 14-m system is given in Heyer, Williams, & Brunt (2006).
3 H I Absorption and the Kinematic Distance of SS 433
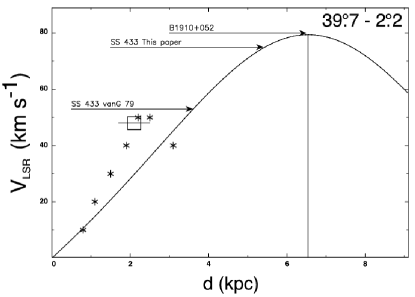
Figure 2 shows the expected run of with distance from the Sun, , in the direction of SS 433 for a flat rotation curve with kpc and km s-1. Other models for Galactic rotation in the inner Galaxy (e.g., Burton (1992); Clemens (1985)) differ from a flat curve by only a few km s-1 at the distances shown in the Figure. For an azimuthally symmetric rotation curve, is symmetric about the tangent point distance, , then becomes negative at kpc, where . The value of at the tangent point, , for the flat rotation curve model is within a few km s-1 of measured values of for 12CO in the Galactic plane at similar longitudes (Clemens, 1985) and also agrees with the maximum velocity of H I absorption toward the extragalactic radio source B1910+052, which lies projected on the rim of W50 (Dickey et al., 1983).
The line of sight to SS 433 at lies beyond the region of the Galaxy influenced by strong streaming motions around the Galactic bar (e.g., Weiner & Sellwood (1999)), but large-scale density wave motions may still be important (e.g., Englmaier & Gerhard (2006)). Brand & Blitz (1993) have tried to determine the true velocity field of the Galaxy using distances to the exciting stars of HII regions and velocities from 12CO measurements of the associated molecular clouds. Their results in the direction of SS 433 are shown by starred symbols in Fig. 2. The HII region S74 (which is projected on the edge of W50) is shown as an open square, with the distance uncertainty estimated by Forbes (1989). The S74 distance is based on measurement of a single star and may have an error larger than . S74 itself has significant weight in the determination of the Brand & Blitz velocity field in this direction, but there are a few other HII regions whose distance and kinematics also imply that the Galactic velocity field rises somewhat steeply for a few kpc from the Sun before returning to the ‘flat’ value at kpc (Brand & Blitz, 1993).
The arrow marked ‘SS 433 vanG 79’ shows the maximum velocity of H I absorption toward SS 433 found by van Gorkom, Goss, & Shaver (1979). While this gives kpc for a flat rotation curve, the Brand & Blitz (1993) empirical velocity field suggests that the limit might be even less stringent: kpc. The arrow labelled ‘B1910+052’ marks the velocity limit of H I absorption toward the radio continuum source B1910+052 only away from SS 433 (Dickey et al., 1983). This source has an H I absorption component at -20 km s-1 showing that it is kpc from the Galactic Centre and thus almost certainly extragalactic. At positive velocities it has H I in absorption continuously between 0 and 80 km s-1 and supplies us with two important facts: cool H I is most likely present at all permitted velocities along the line of sight to SS 433, and the value of given by the flat rotation curve is correct to within a few km s-1.
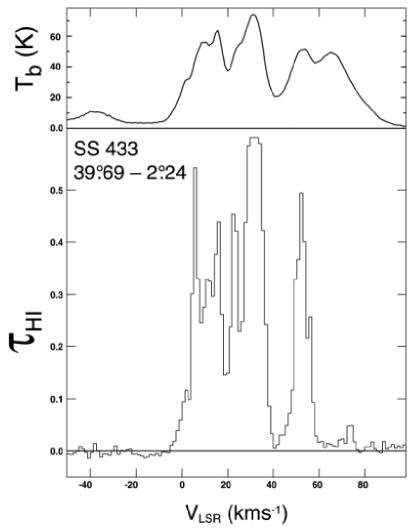
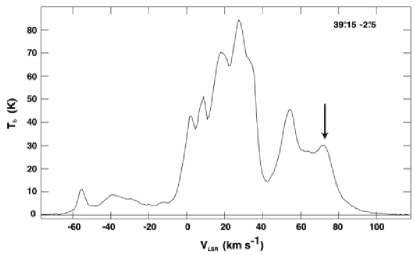
Figure 3 shows the spectrum of H I in absorption against SS 433 (lower panel) obtained from the new high-velocity resolution VLA observations and the corresponding emission spectrum from the GBT observations (upper panel). The independent VLA absorption spectrum made with lower velocity resolution is consistent with the data shown here. H I absorption components are detected to km s-1, a kinematic distance of kpc, as indicated by the arrow in Fig. 2. The relatively weak absorption at km s-1 was not detected in previous data, though hints of it at the level can be seen in the data of Dickey et al. (1983). In the new VLA spectra it is significant at a level above the noise.
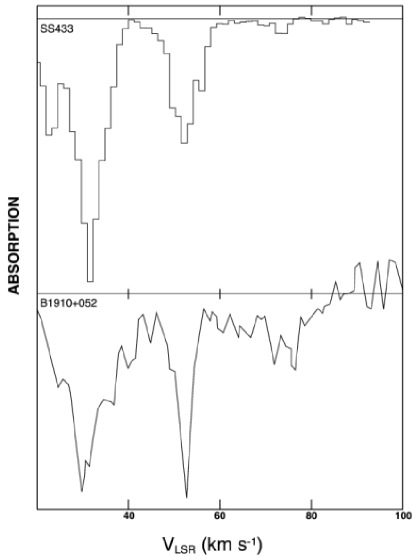
Figure 4 shows the high-velocity portion of the VLA H I absorption spectrum toward SS 433 (this paper) and toward B1910+05, the extragalactic source only from SS 433 (Dickey et al., 1983). The absence of H I absorption toward SS 433 at velocities km s-1, which is the terminal velocity where absorption is seen toward B1910+05, implies that SS 433 is nearer than the tangent point distance kpc. Thus the H I absorption data taken in total give kpc.
These values are consistent with the distance derived from a light-travel time analysis and we therefore adopt the Blundell & Bowler (2004) distance of kpc, and take km s-1 as the systemic velocity of the the equivalent standard of rest of the SS 433/W50 system, where the uncertainty is the typical random motion of cool H I clouds (Dickey & Lockman, 1990). This velocity is close to the mean velocity of the SS 433 binary system (Hillwig et al., 2004), which, however, may have a significant peculiar velocity acquired during the SN event. This is discussed more fully in .
4 SS 433 and the Molecular Cloud at 30 km s-1
In this section we examine the evidence that SS 433 is interacting with a molecular cloud at a velocity of about 30 km s-1, as has been suggested by some previous work (Huang, Dame & Thaddeus, 1983; Yamamoto et al., 1999).
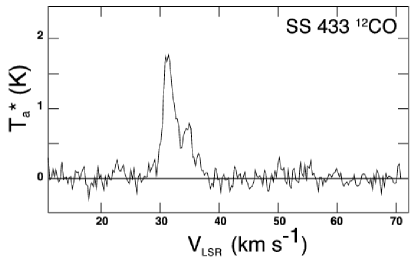
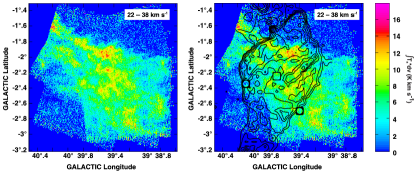
Figure 5 shows a 12CO spectrum towards SS 433 derived from the new observations with the FCRAO, while Figure 6 shows the 12CO emission integrated over the velocity range 22–38 km s-1. The image includes 12CO at all velocities which were considered to be connected with W50 in the earlier studies (Huang, Dame & Thaddeus, 1983; Yamamoto et al., 1999), which is virtually all of the 12CO in this part of the sky. The right panel of Fig. 6 shows the integrated 12CO intensities overlaid with contours of the 1.4 GHz continuum of W50 from Dubner et al. (1998). There is no obvious relationship between the 12CO emission and the radio continuum, and, except that they both lie somewhat below the Galactic plane, nothing in these data suggests any connection. Scrutiny of line velocity and line width maps leads to a similar conclusion.
The FCRAO 12CO data also show that the S74 HII region (Fig. 1) is not connected with either the SS 433/W50 system, or with the molecular cloud at 22 – 38 km s-1. 12CO emission associated with S74 is seen only between 40 and 47 km s-1, and only in the immediate vicinity of the nebula. There is no 12CO at the velocity of S74 within the boundries of W50, so the HII region S74 seems also to be a chance overlap on the sky with the edge of the remnant.
The highest velocity 12CO emission in this field comes at 56 km s-1 from a small cloud at , just touching the top of the western lobe. Both the FCRAO and the lower-resolution 12CO data (Huang, Dame & Thaddeus, 1983; Dame et al., 2001) have no significant 12CO emission at velocities km s-1 except for general emission from the molecular cloud layer near the Galactic plane at . Thus we find no evidence for a molecular cloud near the longitude, latitude and of SS 433. This has implications for the origin of the system, and will be addressed in .
In summary, despite their overlap on the sky, there is no evidence in 12CO for an association between the molecular gas near 30 km s-1 and the SS 433/W50 system.
5 The Interaction Between SS 433/W50 and Interstellar H I
5.1 The Western Jet: A Cavity in H I
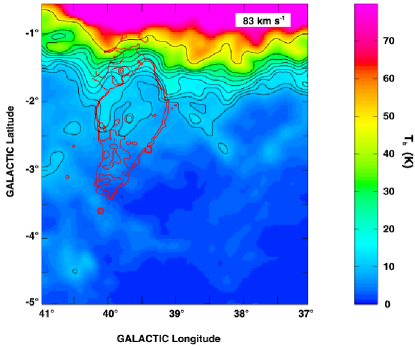
The Western lobe of SS 433 terminates at where the W50 radio continuum contours sit in a slight cavity in the H I, seen most clearly at km s-1, e.g., at the 83 km s-1 emission shown in Figure 7. It is likely that the interaction is more visible at the higher velocities simply because there is less confusion from unrelated emission.
5.2 The Eastern Jet: An Expanding H I Shell
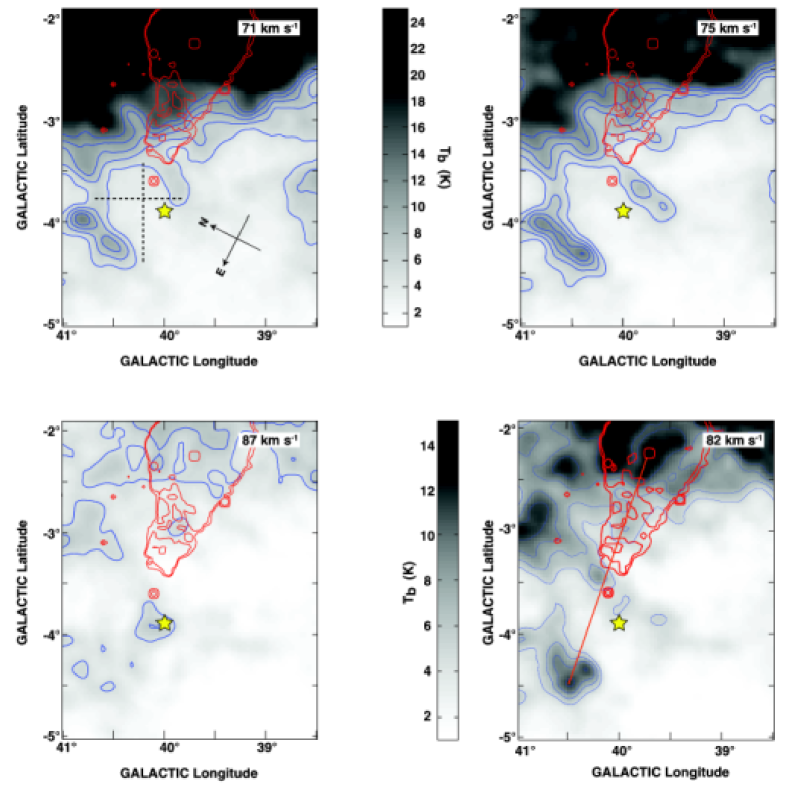
The eastern lobe of the continuum source terminates abruptly at the edge of a well-defined expanding shell of H I, shown at several velocities in Figure 8. The shell is at its maximum angular extent at the velocities of the top two panels of the Figure, and at its greatest velocity in the lower left panel, where it has contracted to a single receding ‘cap’. The expanding shell is open to the South, perpendicular to the axis of the jet, and may also have a gap where it overlaps the continuum lobe itself. The solid red line in the Figure lies along the extension of the axis of the SS 433 jets. At 82 km s-1 the axis of the jet intersects a chevron of H I which points in the direction of the jet motion (lower right panel). This feature is also visible in Fig. 7.
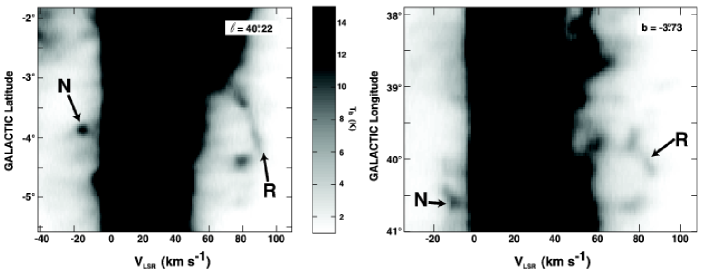
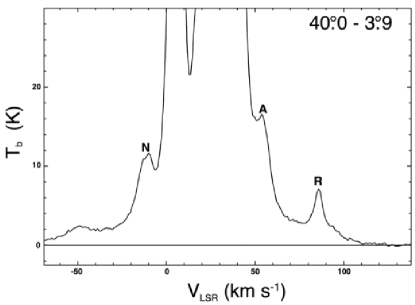
The expansion of the shell is demonstrated in Figure 9, through velocity-longitude and velocity-latitude cuts along the direction of the dashed lines marked in Fig. 8. The centre of kinematic symmetry of the shell is at – at km s-1, and its expansion velocity is km s-1. Figure 10 shows a GBT H I spectrum at –, the position marked by the yellow star in Fig. 8. This particular spectrum was chosen for display because it shows the major components of the system most distinctly. The receding part of the shell (marked ‘R’) is well-separated in velocity from other H I emission and reaches km s-1, well beyond the terminal velocity in its direction (Fig. 2). The approaching side of the shell, labelled A, is a distinct component in the spectra, though it cannot be measured accurately at most locations. In this direction the receding component has cm-2 and a line width km s-1 (FWHM), values typical of directions through the centre of the shell, which have a range in of 3–9 cm-2 and in of 4–10 km s-1. In many places the shell appears to be barely resolved by the GBT beam: it must have an intrinsic thickness (FWHM) , or pc at the distance of SS 433.
5.2.1 Mass, density, and energetics
At an adopted distance of 5.5 kpc, a simulated shell with a Gaussian radial density profile, a radius to the peak of 40 pc and a thickness (FWHM) of 20 pc fit the data reasonably well. Assuming that the gap in the shell covers of its surface area, the total H I mass is . For the expansion velocity of km s-1, and a mean particle mass of , the total measured kinetic energy in the shell is ergs. The H I mass divided by the volume of the sphere to its outermost radius gives the initial density = 0.4–1.2 cm-3, a range which covers all plausible values of its size. This is about an order of magnitude larger than the interstellar densities expected this far from the plane (Dickey & Lockman, 1990). The properties of the expanding shell are summarised in Table 1, where the errors attached to each quantity include the range of measurement uncertainty and the effect of a kpc change in the adopted distance.
5.3 A static ring or shell around W50
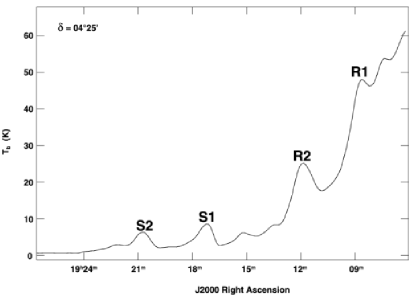
The H I emission at the adopted systemic velocity of 75 km s-1, as measured with the GBT along a path at constant declination, approximately parallel to the long axis of the SS 433 system, is shown in Figure 11. This track cuts through four distinct ridges of H I which are superimposed upon a strong gradient. The two ridges at higher Right Ascension belong to the expanding shell discussed in the previous section. The two ridges at lower Right Ascension appear to be the edges of a static H I ring or shell.
The GBT image of H I emission at 74 km s-1 is shown in Figure 12. In the right panel the temperatures have been scaled by to flatten somewhat the very strong H I brightness gradient near the Galactic plane and accentuate H I features which have a significant deviation from a smooth layer. The two western ridges in Fig. 11 come from cuts through an irregular ring of emission centred at on the upper part of the W50 remnant. It is possible that the H I cavity illustrated in Fig. 7 is part of this ring.
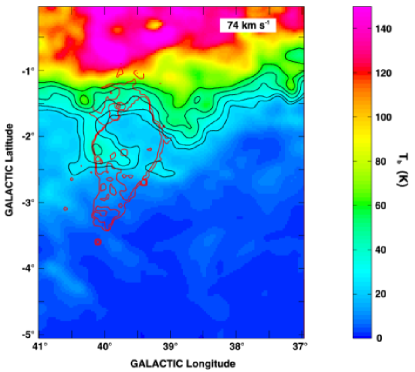
The H I ring appears to be slightly elliptical with an average diameter pc (for a distance of 5.5 kpc) and a thickness in places of about 40 pc. Figure 13 shows the H I spectrum at through the lower part of the ring. The ring is the highest velocity feature in the spectrum, severely blended with lower velocity gas, but distinguishable over the range km s-1. Its linewidth km s-1 (FWHM) and the brighter portions have cm-2.
We can find no evidence for expansion of this object. While an approaching segment might easily be lost in confusion from unrelated emission, any receding segment should be detectable easily in the wings of the spectra (see also ). The absence of evidence for expansion suggests either that the structure is a ring or torus, not a complete shell, or that it is a stalled shell with an expansion velocity less than a few km s-1.
5.3.1 Mass and Density
The uncertain topology causes a considerable uncertainty in the derived mass because of the need to disentangle the object from unrelated emission. The visible ring contains of H I, assuming the centre of the ring is at the background level. It can also be modelled as a complete shell, however, whose ring-like appearance results mainly from limb-brightening. In this case the data can be matched by a shell with a Gaussian radial density profile with a peak H I volume density cm-3 at a radius of 80 pc, a FWHM of 40 pc, and a total mass in H I of . The average interstellar density is given by the mass divided by the volume, which, because the volume of this object depends on its assumed shape, is not well constrained. Over the range of plausible assumptions we find cm-3, at least an order of magnitude greater than the average H I density expected this far from the Galactic plane (Dickey & Lockman, 1990), a relative excess similar to that found around the expanding shell.
6 H I emission Toward SS 433/W50 at other velocities
We searched for a possible association between W50 and H I emission at all other velocities and present the results here. Although there are some coincidences, we do not believe that they are significant.
6.1 +40 km s-1
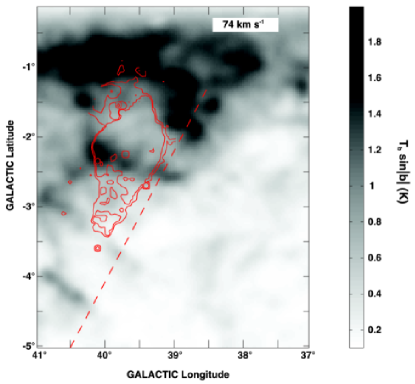
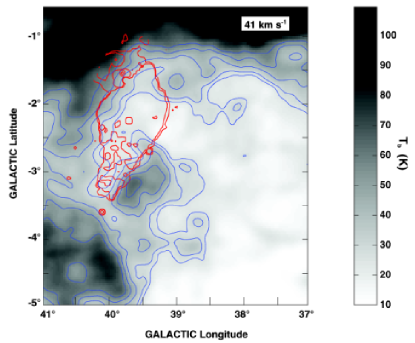
Dubner et al. (1998) detected a void in the H I surrounding W50 at a velocity near 40 km s-1 in maps made at resolution. Figure 14 shows the higher angular resolution GBT image of this velocity range. The radio continuum coincides with an H I minimum which has a morphology with some superficial resemblence to that of W50, just as was discovered by Dubner et al. (1998) in the lower-resolution data. The inference drawn by Dubner et al. that the minimum is a void created by the expansion of W50 into the surrounding medium is, however, quite difficult to understand in the context of all the other data presented here.
The main difficulty is with the velocity of the void, km s-1. A large void produced by an SN should have the velocity of the ambient ISM into which it expands, in this case km s-1. A void at 40 km s-1 corresponds to a kinematic distance of only 2–3 kpc, whereas all other evidence now places SS 433 at a distance of kpc and a systemic velocity near 75 km s-1. Moreover, the H I at 40 km s-1 does not seem to be concentrated into a single cloud, which might, however improbably, be co-located with SS 433 yet have a peculiar velocity of –35 km s-1. Instead, the H I seems to lie in a continuous ridge which is a large-scale interstellar feature, extending below the plane to at least . The liklihood that the H I at 40 km s-1 has a peculiar motion km s-1, surrounds SS 433, and has been evacuated by the SN, seems low.
We could speculate that the H I seen around W50 at 40 km s-1 is the swept-up shell from the expansion of the SN, accelerated toward us (and thus from 75 km s-1 to 40 km s-1) by the asymmetric action of the SS 433 eastern jet, whose axis is in fact tilted in our direction, on average, by about from the plane of the sky. But there is so much H I at 40 km s-1 that it would have ergs in this scenario. Moreover, the H I ridge at 40 km s-1 does not look like a swept-up wall, but extends off our image to higher longitude and more negative latitude. It seems to be a large H I cloud and not part of a shell. On consideration of energetics and morphology we find it implausible that the 40 km s-1 feature is associated with SS 433/W50.
The least gratifying but most likely circumstance given all the evidence is that the apparent connection at this velocity is a coincidential overlap along our line of sight of an unrelated H I feature. Whereas the expanding shell and ring discussed in the previous section have both a spatial and kinematic correspondance with the SS 433/W50 system, the void at 40 km s-1 matches only in its general shape. We conclude that it is unlikely that the apparent H I void at 40 km s-1 is related to SS 433.
6.2 High positive-velocity H I
Koo & Heiles (1991) reported the possible detection, though at low statistical significance, of very weak high-positive-velocity H I in measurements made with an angular resolution of in the direction of W50. In the Dubner et al. (1998) model this was assumed to be material accelerated by W50. The GBT data show no evidence for an excess of H I toward W50 at velocities km s-1 to a level of cm, and thus we find no evidence of a high-velocity receding neutral shell around W50.
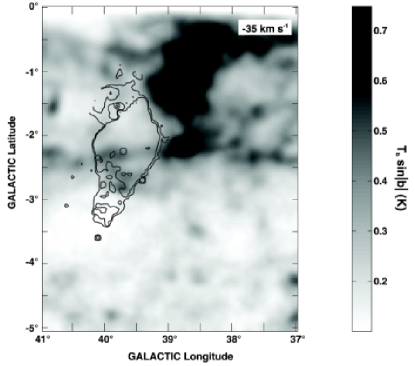
6.3 H I at -35 km s-1
Dubner et al. (1998) suggested that a ridge of H I in their data near –35 km s-1 might be material accelerated by the shock front associated with the near-side expansion of W50. There was also some evidence from earlier H I observations of a shell around W50 at this velocity (Gosachinskii & Khersonskii, 1987). The GBT image is shown in Figure 15 with scaled by to reduce the strong latitude gradient. We can find no concentration of H I that has a clear association with W50 in this velocity range.
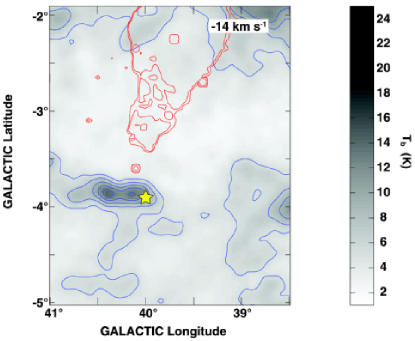
6.4 A possible component of the expanding shell at –14 km s-1
Fig. 16 shows the image of the H I emission feature labelled ‘N’ in Figs. 9 and 10. We are doubtful of any association with the expanding shell simply because its velocity of -14 km s-1 is so extremely different from that of the rest of the shell. Nonetheless, it is relatively compact and is projected on the centre of the expanding shell, so we consider the consequences of its association. This component has a peak cm-2 with a linewidth km s-1. The position of its peak is and it extends in longitude at in latitude for a size pc, where is the distance in units of 5.5 kpc. Its H I mass is , and if it has been ejected from the expanding shell, its kinetic energy would be ergs.
We will not discuss this cloud any further as we consider it unlikely to be associated with the expanding shell, whose systemic velocity is km s-1 and which seems to be a very regular structure with a uniform expansion velocity of km s-1.
7 The Origin of SS 433: A Runaway Binary from the Plane
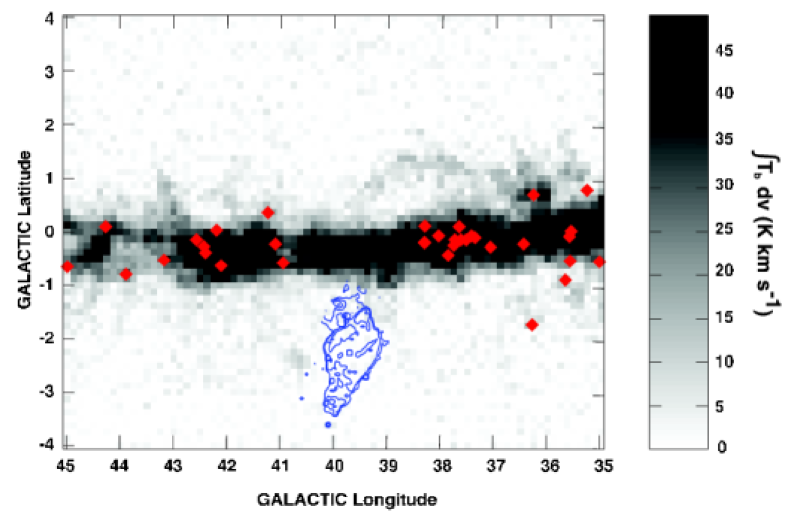
Most studies of the SS 433 system conclude that it is comprised of a compact object (possibly a black hole) which likely began its life as an O star, and a ‘donor’ star of mass (e.g., Hillwig et al. (2004); Fuchs et al. (2006)). By these standards, the system must be relatively young and belong to Galactic Population I. It is located, however, quite far from the Galactic plane. The young, massive stars in the inner Galaxy traced by HII regions have a vertical distribution with a dispersion pc, consistent with the scale height of OB stars in the solar neighbourhood (Lockman, Pisano, & Howard, 1996; Reed, 2000; Maíz-Apellániz, 2001). At a distance from the Galactic plane pc, the location of SS 433 is certainly unusual, and as a massive binary it would have attracted notice even if it had not become an extraordinary system. Its isolation is illustrated in Figure 17, which shows the radio continuum with respect to molecular clouds and HII regions in its area of the Galaxy. As noted in , there is no trace of a molecular cloud at its longitude, latitude and velocity. It is thus highly likely that it was formed near the plane and not at its present location, and must have acquired a peculiar vertical velocity km s-1 to reach z=–215 pc.
Most, if not all, early-type stars found far from the Galactic plane are runaways which have been ejected from their parent cluster (Blaauw, 1961; Gies, 1987). Some have a proper motion which allows them to be traced back to their origin (e.g., Hoogerwerf et al. (2001)). Binary stars can also be ejected from young clusters. The frequency of binaries among early-type runaway stars is small, but not zero (Mason et al., 1998; Martin, 2006; McSwain et al., 2007), and theoretical studies suggest that binaries containing massive stars can be ejected from clusters at velocities km s-1; the more massive the system ejected, the lower the ejection velocity (Leonard & Duncan, 1990). At the location in the Galaxy of SS 433, an object launched from with a vertical velocity km s-1 in the Galactic potential given by Wolfire et al. (1995) will reach the altitude of SS 433 in about 8 Myr. As importantly, because of the long turn-around time, it will stay at pc for between 8 and 18 Myr after leaving the plane. This corresponds to the main sequence lifetime of stars with (Hirschi et al., 2004). It is thus reasonable that SS 433 began in one of the young clusters in the Galactic plane, was given a random kick of a few tens of km s-1 (comparable to the velocity dispersion of the population of runaway OB stars (Stone, 1991)), and made its way as an OB binary to pc where the more massive star became a SN forming W50 and SS 433.
The other possibility is that the supernova occured while the binary was still in the Galactic plane and the SN caused its own ejection (Iben & Tutukov, 1997), now with a compact object as one member of the system (van den Heuvel et al., 1980). Arguments for this scenario are summarised by Königl (1983), who notes that it would find support if SS 433 has a peculiar velocity directed away from the Galactic plane.
Recent astrometric studies of SS 433 using the VLBA have been made at three epochs (A. Mioduszewski and M. Rupen, private communication) and a proper motion has been detected. Those results will be described in full elsewhere; here we use them in the discussion of the origin of SS 433 and its interaction with the ISM. The Mioduszewski and Rupen measurements in March 1998 and August 2005 combine to give a proper motion and milli-arcsec per year. At a distance of 5.5 kpc and a heliocentric velocity of km s-1 (Hillwig et al., 2004), we derive velocities relative to the LSR (standard solar motion) of , km s-1, where is positive radially outward from the Galactic centre, is positive in the direction of Galactic rotation, and is positive toward the North Galactic Pole. For a flat rotation curve at km s-1, the velocities in a frame corotating at SS 433 are V(SS 433) = -17, +225, +30 km s-1 in the R, and z directions, respectively. SS 433 thus has peculiar velocities relative to its local standard of rest of -17, +5, +30 km s-1, with uncertainties of perhaps 50% in each value. The measurements indicate that the total non-circular motion of SS 433 is small, km s-1, and directed mainly toward the Galactic plane nearly along the axis of the Western jet.
These results allow us to constrain the history of the system. If the O star binary was created in the Galactic plane and ejected before the SN stage, its age could be Myr, where the inequality applies if the ejection velocity was more than the minimum needed to achieve its current distance from the plane. Its current space velocity presumably reflects the kick that the system got during the SN, and contains no information on its history prior to the SN. Alternatively, if the supernova occured in the Galactic plane, and the system was then ejected, its current velocity reflects its dynamical history. It must have reached its greatest distance from the plane, turned around, and now be returning at km s-1, which requires a total time of 22 Myr in the Galactic potential of Wolfire et al. (1995).
Another factor is that SS 433 lies at almost the exact centre of W50 measured transverse to the axis of the jets, but is offset by about 4 pc () to the west along the jet axis as measured from the peak of the X-ray emission (Watson et al., 1983). Measured from the maximum extent of the radio lobes it is offset in the same direction by about 12 pc. Some asymmetry in the extent of the W50 lobes is expected because they are moving nearly perpendicular to the Galactic vertical density gradient, though in this case there are suggestions that local conditions may be atypical . The central part of W50 is, however, quite circular. If we ascribe the offset of SS 433 to its proper motion, it implies a time from the formation of W50 of y. This is identical to the lifetime of SS 433 estimated by Begelman et al. (1980) adjusting their values for a distance of 5.5 kpc, a jet luminosity of ergs s-1 and an ambient density of 0.5 cm-3.
We believe it is most likely that SS 433 was formed not far from where we observe it today, when the more massive member of a binary which had been ejected from the plane underwent its SN phase about years ago.
8 The impact of SS 433 on the Surrounding Interstellar Medium
The radio continuum lobes aligned with the SS 433 jets evidence interaction with the local ISM: measured from SS 433, the lobe directed toward the Galactic plane is 0.7 times the length of the lobe directed away from the plane. This is the expected ratio if the jet length is limited by swept-up interstellar matter in an H I layer with a vertical density profile given by Dickey & Lockman (1990). In the data presented here the most convincing imprint of this system on the ISM is found at velocities near the systemic velocity of 75 km s-1: the two H I shells, one expanding and the other static. While these have some resemblance to other interstellar shells, in detail they seem to be quite different.
| Property | Expanding | Static |
|---|---|---|
| ,–3 | ,–1 | |
| z (pc) | –375 | –170 |
| (km s-1) | ||
| (km s-1) | — | |
| (km s-1) | 5–8 | |
| radius (pc) | ||
| (FWHM) (pc) | ||
| M (M | ||
| Ek (ergs) | — | |
| n0 (cm-3) | 0.4 – 1.2 | 1 – 2 |
8.1 Origin of the Expanding Shell
Is the expanding H I shell found just off the tip of the Eastern jet related to, and possibly powered by SS 433? The key properties of this system are summarised in Table 1. If we were to interpret this object as a bubble driven by a stellar wind (Castor et al., 1975), for the observed size and mean density its age would be years and the required mechanical wind luminosity ergs s-1 or a total power of ergs. This might be supplied by a massive star with a wind velocity of 2000 km s-1 and a mass loss rate of M☉ y-1 (e.g., Kudritzki & Puls (2000); Krticka & Kubat (2007)) but we can find no evidence for such a star or any other energetic object within the shell, there is no radio continuum associated with the expanding shell in the maps of Dubner et al. (1998), and the shell is not visible in the X-ray maps from the ROSAT survey. Moreover, its location nearly 400 pc below the Galactic plane places it many scale-heights away from most Population I objects.
The edge of the shell, however, lies exactly on the termination of the radio continuum powered by the Eastern jet of SS 433, its velocity is close to that of the SS 433 system, and the projected jet axis goes precisely through the centre of the H I feature. The jets of SS 433 have a kinetic luminosity ergs s-1 (Margon, 1984; Panferov & Fabrika, 1997), which could supply the necessary energy in years at an efficiency of . The creation of the shell might have been a brief episode in the life of SS 433, marked now only by the fossil record left in H I. This sequence of events is speculative, but if SS 433 is the source of the shell, the shell age must be y, about an order of magnitude less than the age derived from simple application of the theory of wind-blown bubbles (Castor et al., 1975) for an object with its properties.
8.2 The Static Ring
The static ring is problematic. It is blended with unrelated gas, is not symmetric about SS 433 but is centred on the upper part of W50, and it corresponds to the shape of the radio continuum only along the edge of the western lobe. Indeed, its basic topology is uncertain. Higher resolution H I observations are necessary. There are H I shells observed in the LMC with a size similar to that of the ring, shells with a low expansion velocity as well, but these usually surround OB associations, and may not be relevant to the shell around W50.
Simple application of the equations for wind-blown bubbles (Castor et al., 1975) assuming an expansion velocity of km s-1, gives the rather large age of y. This is comparable to the free-fall time of an object from the location of SS 433 back to the Galactic plane, and is unlikely to be an accurate description of the age of the ring. The theory of bubbles and superbubbles has been reasonably successful when applied to the interstellar structures formed by winds and SN (e.g., Oey (2007)), but it does not seem to give reasonable results for the static H I ring associated with SS 433/W50.
8.3 The Average Interstellar Density
The average H I density, , is estimated to be 1 – 2 cm-3 at the location of the ring around W50 ( pc), and 0.4 – 1.2 cm-3 just below the end of the Eastern jet at pc. These values are more than an order of magnitude greater than the densities expected at these distances from the Galactic plane (Dickey & Lockman, 1990). It is interesting that there are other examples of well-defined H I shells which also appear to be expanding into substantially overdense regions (Stil et al., 2004; Gaensler et al., 2005). Perhaps the prominence of W50 in the radio continuum is enhanced because of its accidental location in a large interstellar H I cloud.
9 Summary Comments
The new H I absorption data reconcile the kinematic distance to SS 433 with the distance derived from an analysis of light-travel time effects (Blundell & Bowler, 2004). Absorption at +75 km s-1 is detected in two separate measurements at the significance level. All data now place SS 433 at a distance 5.5 kpc from the Sun with a systemic velocity km s-1. The HII region S74 and the molecular cloud at 30 km s-1, both of which overlap parts of the W50 remnant, have no association with the system and most likely lie in the foreground, as suspected by Margon (1984). We also find no convincing evidence for an association of any H I with W50 at velocities other than near 75 km s-1.
The determination of a modest proper motion of 35 km s-1 directed nearly along the Western jet (i.e. toward the Galactic plane) suggests that SS 433 originated as an O-star binary which was ejected early in its life from a cluster near the Galactic plane with a velocity away from the Galactic plane km s-1. The SN of the more massive star then occured close to where we now observe the system, and in that event it was given a modest kick back toward the Galactic plane. The location of SS 433 near the centre of symmetry of the radio continuum source W50 suggests that the SN occured years ago.
There is no molecular cloud (as traced by CO emission) associated with the system, but there seem to be two H I features: a static ring or shell around the upper part of W50, and an expanding shell touching the end of the Eastern lobe. There are many H I shells in the ISM (Menon, 1958; Heiles, 1979; McClure-Griffiths et al., 2002; Ehlerová & Palouš, 2005) often seen surrounding H II regions or clusters of young stars, in other instances without an identifiable source of energy (Stil et al., 2004), but well-developed H I shells around supernova remnants are rare. Studies of individual remnants often show patchy fragmented structures, perhaps because remnants expand into a complex ISM (Koo et al., 1993, 2004; Yar-Uyaniker et al., 2004). It may be significant that the average interstellar density derived for both H I features around W50 is about an order of magnitude greater than what would be expected at their distance from the Galactic plane. This seems to be a trend for some H I shells which are not near regions of star formation (Gaensler et al., 2005; Stil et al., 2004).
The expanding shell is quite interesting, for its measured kinetic energy is so large ( ergs) that it must have been formed by some energetic event, but it is quite far from the Galactic plane and there is no nearby candidate energy source except for SS 433. It is possible that the shell is a fossil remnant of a time when the Eastern jet extended out past the current radio continuum boundries – the jet has enough energy to create a bubble of this sort in years. On the other hand, there are examples of H I shells with unidentified energy sources, and it may be a challenge to understand how the kinetic energy of a collimated jet could produce a relatively symmetric expanding shell.
The SS 433 system is ideally situated for the study of the interaction between energetic events and the interstellar medium: it is separated from most confusing sources, accessible at many wavelengths, and has resonably well understood energetics. As noted by Königl (1983), the SS 433 jets may offer a unique probe of the ISM. Further study of H I in this region should be rewarding.
Acknowledgments
The National Radio Astronomy Observatory is a facility of the National Science Foundation operated under cooperative agreement with Associated Universities, Inc. We thank Alison Peck for assistance with the VLA observations, Mark Heyer & Chris Brunt for obtaining the FCRAO 12CO data and sharing it with us, and Amy Mioduszewski & Michael Rupen for sharing their proper motion data. We also thank Vivek Dwahan, Bob Benjamin, and Mike Shull for useful discussions.
References
- Maíz-Apellániz (2001) Maíz-Apellániz, J. 2001, AJ, 121, 2737
- Begelman et al. (1980) Begelman, M. C., Hatchett, S. P., McKee, C. F., Sarazin, C. L., & Arons, J. 1980, ApJ, 238, 722
- Blaauw (1961) Blaauw, A. 1961, Bull. Astron. Inst. Netherlands, 15, 265
- Blundell & Bowler (2004) Blundell, K.M., & Bowler, M.G. 2004, ApJ, 616, L159
- Brand & Blitz (1993) Brand, J., & Blitz, L. 1993, A&A, 275, 67
- Brinkmann et al. (2006) Brinkmann, W., Pratt, G. W., Rohr, S., Kawai, N., & Burwitz, V. 2006, ArXiv Astrophysics e-prints, arXiv:astro-ph/0610781
- Burton (1992) Burton, W.B. 1992, in The Galactic Interstellar Medium, Saas-Fee Advanced Course 21, ed. D. Pfenniger, & P. Bartholdi, (Springer-Verlag), p. 1
- Castor et al. (1975) Castor, J., McCray, R., & Weaver, R. 1975, ApJ, 200, L107
- Clemens (1985) Clemens, D.P. 1985, ApJ, 295, 422
- Cioffi et al. (1988) Cioffi, D. F., McKee, C. F., & Bertschinger, E. 1988, ApJ, 334, 252
- Dame et al. (2001) Dame, T. M., Hartmann, D., & Thaddeus, P. 2001, ApJ, 547, 792
- Delhaye (1965) Delhaye, J. 1965, Galactic Structure, ed. A. Blaauw & M. Schmidt, Univ. Chicago Press, 61
- Dickey et al. (1983) Dickey, J. M., Kulkarni, S. R., Heiles, C. E., & van Gorkom, J. H. 1983, ApJS53, 591
- Dickey & Lockman (1990) Dickey, J. M., & Lockman, F. J. 1990, ARA&A, 28, 215
- Downes et al. (1986) Downes, A. J. B., Pauls, T., & Salter, C. J. 1986, MNRAS, 218, 393
- Dwarkadas (2006) Dwarkadas, V. V. 2006, Ap&SS, 537
- Dubner et al. (1998) Dubner, G.M., Holdaway, M., Goss, W.M., & Mirabel, I.F. 1998, AJ, 116, 1842
- Ehlerová & Palouš (2005) Ehlerová, S., & Palouš, J. 2005, A&A, 437, 101
- Englmaier & Gerhard (2006) Englmaier, P., & Gerhard, O. 2006, Celest. Mech. and Dynam. Astr., 94, 369
- Forbes (1989) Forbes, D. 1989, A&AS, 77, 439
- Fuchs et al. (2006) Fuchs, Y., Koch Miramond, L., & Ábrahám, P. 2006, A&A, 445, 1041
- Gaensler et al. (2005) Gaensler, B. M., McClure-Griffiths, N. M., Oey, M. S., Haverkorn, M., Dickey, J. M., & Green, A. J. 2005, ApJ, 620, L95
- Gies (1987) Gies, D. R. 1987, ApJS, 64, 545
- Gosachinskii & Khersonskii (1987) Gosachinskii, I. V., & Khersonskii, V. K. 1987, Soviet Astronomy, 31, 621
- Heiles (1979) Heiles, C. 1979, ApJ, 229, 533
- Heyer, Williams, & Brunt (2006) Heyer, M.H., Williams, J.P., & Brunt, C.M. 2006, ApJ, 643, 956
- Hillwig et al. (2004) Hillwig, T. C., Gies, D. R., Huang, W., McSwain, M. V., Stark, M. A., van der Meer, A., & Kaper, L. 2004, ApJ, 615, 422
- Hirschi et al. (2004) Hirschi, R., Meynet, G., & Maeder, A. 2004, A&A, 425, 649
- Hjellming & Johnston (1981a) Hjellming, R.M., & Johnston, K.J. 1981a, Nature, 290, 100
- Hjellming & Johnston (1981b) Hjellming, R. M., & Johnston, K. J. 1981b, ApJ, 246, L141
- Hoogerwerf et al. (2001) Hoogerwerf, R., de Bruijne, J. H. J., & de Zeeuw, P. T. 2001, A&A, 365, 49
- Huang, Dame & Thaddeus (1983) Huang, Y.-L., Dame, T.M., & Thaddeus, P. 1983, ApJ, 272, 609
- Iben & Tutukov (1997) Iben, I. J., & Tutukov, A. V. 1997, ApJ, 491, 303
- Kim et al. (1999) Kim, S., Dopita, M. A., Staveley-Smith, L., & Bessell, M. S. 1999, AJ, 118, 2797
- Königl (1983) Königl, A. 1983, MNRAS, 205, 471
- Koo & Heiles (1991) Koo, B.-C., & Heiles, C. 1991, ApJ, 382, 204
- Koo et al. (1993) Koo, B.-C., Yun, M.-S., Ho, P. T. P., & Lee, Y. 1993, ApJ, 417, 196
- Koo & Kang (2004) Koo, B.-C., & Kang, J.-h. 2004, MNRAS, 349, 983
- Koo et al. (2004) Koo, B.-C., Kang, J.-H., & McClure-Griffiths, N. M. 2004, Journal of Korean Astronomical Society, 37, 61
- Krticka & Kubat (2007) Krticka, J., & Kubat, J. 2007, ArXiv Astrophysics e-prints, arXiv:astro-ph/0701411
- Kudritzki & Puls (2000) Kudritzki, R.-P., & Puls, J. 2000, ARA&A, 38, 613
- Leonard & Duncan (1990) Leonard, P. J. T., & Duncan, M. J. 1990, AJ, 99, 608
- Lockman (1989) Lockman, F. J. 1989, ApJS, 71, 469
- Lockman & Condon (2005) Lockman, F.J., & Condon, J.J. 2005, AJ, 129, 1968
- Lockman, Pisano, & Howard (1996) Lockman, F.J., Pisano, D.J., & Howard, G.J. 1996, ApJ, 472, 173
- Margon (1984) Margon, B. 1984, ARA&A, 22, 507
- Margon et al. (1979) Margon, B., Ford, H.C., Katz, J.I., Kwitter, K.B., Ulrich, R.K., Stone, R.P.S., & Klemola, A. 1979, ApJ, 230, L41
- Martin (2006) Martin, J. C. 2006, AJ, 131, 3047
- Mason et al. (1998) Mason, B. D., Gies, D. R., Hartkopf, W. I., Bagnuolo, W. G., Jr., ten Brummelaar, T., & McAlister, H. A. 1998, AJ, 115, 821
- McClure-Griffiths et al. (2002) McClure-Griffiths, N. M., Dickey, J. M., Gaensler, B. M., & Green, A. J. 2002, ApJ, 578, 176
- McSwain et al. (2007) McSwain, M. V., Boyajian, T. S., Grundstrom, E. D., & Gies, D. R. 2007, ApJ, 655, 473
- Menon (1958) Menon, T. K. 1958, ApJ, 127, 28
- Murdin, Clark, & Martin (1980) Murdin, P., Clark, D.H., & Martin, P.G. 1980, MNRAS, 193, 135
- Oey (2004) Oey, M. S. 2004, Ap&SS, 289, 269
- Oey (2007) Oey, M. S. 2007, IAU Symposium, 237, 106
- Panferov & Fabrika (1997) Panferov, A. A., & Fabrika, S. N. 1997, Astronomy Reports, 41, 506
- Reich et al. (1990) Reich, W., Fürst, E., Reich, P., & Reif, K. 1990, A&AS, 85, 633
- Reed (2000) Reed, B. C. 2000, AJ, 120, 314
- Stil et al. (2004) Stil, J. M., Taylor, A. R., Martin, P. G., Rothwell, T. A., Dickey, J. M., & McClure-Griffiths, N. M. 2004, ApJ, 608, 297
- Stirling et al. (2002) Stirling, A. M., Jowett, F. H., Spencer, R. E., Paragi, Z., Ogley, R. N., & Cawthorne, T. V. 2002, MNRAS, 337, 657
- Stone (1991) Stone, R. C. 1991, AJ, 102, 333
- van Gorkom, Goss, & Shaver (1979) van Gorkom, J.H., Goss, W.M., & Shaver, P.A. 1979, A&A, 82, L1
- van den Heuvel et al. (1980) van den Heuvel, E. P. J., Ostriker, J. P., & Petterson, J. A. 1980, A&A, 81, L7
- van Gorkom et al. (1982) van Gorkom, J.H., Goss, W.M., Seaquist, E.R., & Gilmore, W.S. 1982, MNRAS, 198, 757
- Velázquez & Raga (2000) Velázquez, P. F., & Raga, A. C. 2000, A&A, 362, 780
- Watson et al. (1983) Watson, M. G., Willingale, R., Grindlay, J. E., & Seward, F. D. 1983, ApJ, 273, 688
- Weaver et al. (1977) Weaver, R., McCray, R., Castor, J., Shapiro, P., & Moore, R. 1977, ApJ, 218, 377
- Weiner & Sellwood (1999) Weiner, B.J., & Sellwood, J.A. 1999, ApJ, 524, 112
- Wolfire et al. (1995) Wolfire, M. G., McKee, C. F., Hollenbach, D., & Tielens, A. G. G. M. 1995, ApJ, 453, 673
- Yamamoto et al. (1999) Yamamoto, F., Hasegawa, T., Morino, J., Handa, T., Sawada, T., & Dame, T.M. 1999, in Star Formation 1999, Proceedings of Star Formation 1999, held in Nagoya, Japan, June 21 - 25, 1999, Editor: T. Nakamoto, Nobeyama Radio Observatory, p. 110-111
- Yar-Uyaniker et al. (2004) Yar-Uyaniker, A., Uyaniker, B., & Kothes, R. 2004, ApJ, 616, 247
- Zealey et al. (1980) Zealey, W. J., Dopita, M. A., & Malin, D. F. 1980, MNRAS, 192, 731