Warm molecular hydrogen in the Spitzer SINGS galaxy sample
Abstract
Results on the properties of warm molecular hydrogen in 57 normal galaxies are derived from measurements of H2 rotational transitions in the mid-infrared, obtained as part of the Spitzer Infrared Nearby Galaxies Survey (SINGS). This study extends previous extragalactic surveys of emission lines of H2, the most abundant constituent of the molecular interstellar medium, to fainter and more common systems ( to L☉) of all morphological and nuclear types. In our sensitive integral-field observations covering kiloparsec-scale areas, the 17 m S(1) transition is securely detected in the nuclear regions of 86% of SINGS galaxies with stellar masses above M☉. The derived column densities of warm H2 (with temperatures above K), even though averaged over large areas, are commensurate with values observed in resolved photodissociation regions; the median of the sample is cm-2. They amount to a significant fraction of the column densities of total molecular hydrogen, between 1% and more than 30%. The power emitted in the sum of the three lowest-energy transitions is on average 30% of the power emitted in the bright [SiII] cooling line (34.8 m), and represents about of the total infrared power within the same area for star-forming galaxies, which is consistent with excitation in photodissociation regions. The fact that the H2 line intensities scale tightly with the emission in the aromatic bands, even though the average radiation field intensity within the same area varies by a factor ten, can also be understood if both tracers originate predominantly in photodissociation regions, either dense or diffuse. A large fraction of the 25 targets classified as LINERs or Seyferts, however, strongly depart from the rest of the sample, in having warmer H2 in the excited states, smaller mass fractions of H2 in the warm phase, and an excess of power emitted in the rotational transitions with respect to aromatic bands, the total infrared emission and the [SiII] line. We propose a threshold in H2 to aromatic band power ratios, allowing the identification of low-luminosity AGNs by an excess H2 excitation. A dominant contribution from shock heating is favored in these objects. Finally, we detect in nearly half the star-forming targets, in particular in low-density central regions of late-type galaxies, non-equilibrium ortho to para ratios, consistent with the effects of pumping by far-ultraviolet photons combined with incomplete ortho-para thermalization by collisions, or possibly non-equilibrium photodissociation fronts advancing into cold gas.
1 Introduction
Rotational transitions of molecular hydrogen, lying in the mid-infrared range between 5 and 30 m (Table 1), provide measurements of the mass and temperature distribution of the bulk of the warm molecular gas phase, at temperatures of to 1000 K. By contrast, the transitions from higher vibrational levels in the near-infrared, better studied because more easily observable from the ground, arise from gas at apparent excitation temperatures of more than 1000 K located in a thin layer of molecular clouds, hosting a negligible fraction (of the order of ) of the total H2 mass (Black & Dalgarno, 1976; Burton et al., 1992). The rotational lines are thus more appropriate tracers of molecular gas being exposed to moderate heating, and arise from a much larger volume fraction of the molecular clouds. They constitute one of the most important coolants of warm molecular gas (Neufeld & Kaufman, 1993).
H2 emission lines have been detected in a wide array of sources, including outflows from young stars (Gautier et al., 1976; Bally & Lane, 1982), photodissociation regions (Gatley et al., 1987; Tanaka et al., 1989), planetary nebulae (Treffers et al., 1976; Beckwith et al., 1978), supernova remnants (Treffers, 1979; Burton et al., 1989), large regions at the centers of galaxies (Thompson et al., 1978; Gatley et al., 1984) and extranuclear large-scale shocks in galaxy collisions (Herbst et al., 1990; Sugai et al., 1997; Appleton et al., 2006). The possible excitation mechanisms are accordingly varied. In normal galaxies, the major excitation source is expected to be the far-ultraviolet radiation of massive stars in photodissociation regions, with photon energies between 6 and 13.6 eV (Hollenbach & Tielens, 1997, and references therein). H2 molecules can be pumped by FUV photons into electronically-excited states, followed by fluorescence and radiative cascade through the vibration-rotation levels of the ground electronic state. Pure fluorescent spectra are produced only if the cascade is not significantly altered by collisions with hydrogen atoms and molecules; if the critical densities for collisional deexcitation are exceeded, a portion of the pump energy is converted to heat by collisions, and the lowest rotational levels are populated by collisions and thermalized. Pure fluorescence is thus much more likely in the vibrational transitions, that have high critical densities, than in the pure rotational transitions considered here, with critical densities below a few cm-3 for S(0) to S(3). Additionally, FUV photons can be absorbed by dust grains, followed by the ejection of photoelectrons that heat the gas. This also results in the thermal excitation of the low-energy levels of H2 by collisions with the warm gas. Besides the radiation of massive stars, a second important source of excitation is shocks, in molecular outflows, supernova remnants or cloud collisions in a disturbed gravitational potential (Shull & Hollenbach, 1978; Draine et al., 1983). In addition to the above processes, X-rays produced in active nuclei or in supernova remnant shocks can partially ionize and heat the gas over large column densities, leading to H2 excitation by collisions with hydrogen atoms and molecules, and with fast electrons (Lepp & McCray, 1983; Draine & Woods, 1991; Maloney et al., 1996). Finally, H2 molecules can be formed directly into excited states.
Surveys of molecular hydrogen line emission in galaxies have been so far mostly restricted to starbursts, active galactic nuclei and ultraluminous systems, and have been performed mostly in the near-infrared, targetting vibration-rotation lines that arise from upper levels with much higher excitation energies than the mid-infrared lines. It has been speculated that the major source of H2 heating in star-forming galactic nuclei was shocks in supernova remnants, based on comparison of the luminosity of some vibration-rotation H2 lines with a limited number of Galactic templates and with shock models (Moorwood & Oliva, 1988; Mouri et al., 1990). However, scaling individual templates to the integrated emission of galaxies has large inherent uncertainties, and the near-infrared line ratios most often used to discriminate between thermal and non-thermal emission are not always sufficient to distinguish between shocks and fluorescent excitation followed by collisional deexcitation in high-density regions (Sternberg & Dalgarno, 1989). Puxley et al. (1988) surveyed starburst galaxies in several vibration-rotation lines, and found that the dominant excitation mechanism was pumping by the far-ultraviolet radiation of massive stars, rather than collisional excitation. Davies et al. (2003) reached the same conclusion for a small sample of ultraluminous galaxies, in which the first vibrational level is thermalized by high densities in photodissociation regions. Active nuclei (LINERs or Seyferts) can show an excess of H2 emission relative to hydrogen recombination lines and aromatic bands (e.g. Moorwood & Oliva, 1988; Larkin et al., 1998), but the exact nature of the additional source of excitation, namely X-ray excitation, fluorescence induced by a non-thermal ultraviolet continuum, or shocks induced by dynamical perturbations, is often unclear (e.g. Quillen et al., 1999). It is however unlikely that significant H2 emission could arise from interaction between molecular clouds and jets from Seyfert nuclei (Rotaciuc et al., 1991; Knop et al., 2001).
The detection of a rotational line of H2 was first reported by Beck et al. (1979) (the S(2) transition at 12.3 m in Orion) from observations at Las Campanas Observatory. It was soon followed by many more ground-based detections, but the majority of data on the rotational spectrum of H2 were produced by the SWS instrument on board ISO (e.g. Lutz et al., 2000; Rigopoulou et al., 2002). Furthermore, with previous infrared spectroscopic capabilities, observations of normal galaxies have proven difficult due to sensitivity limitations, so that our current knowledge is mainly extrapolated from studies of very bright objects, maybe not representative of the general galaxy population. The purpose of this paper is thus to extend previous work to fainter systems than formerly accessible, and to characterize directly the generic properties of the warm molecular hydrogen content of normal galaxies. The SINGS sample (Spitzer Infrared Nearby Galaxies Survey; Kennicutt et al., 2003), covering a broad range of infrared luminosities, morphologies and nuclear types, is ideally suited to such a pursuit.
Studies of rotational lines alone, without information on vibrational levels, have very limited diagnostic value concerning the source of excitation, because the low critical densities of the rotational levels make it likely that they will be thermalized most of the time, and thus cannot be used to distinguish between the various heating mechanisms. Because observations of vibration-rotation transitions in the near-infrared are still scarce for normal galaxies, and because they are typically performed in apertures that are not matched to our observations, we did not attempt to include vibrational levels in our analysis. The characterization of excitation mechanisms and physical conditions in the gas would greatly benefit from such information, but would necessitate an additional dedicated survey.
The rotational lines are, however, energetically important and can characterize the temperature and density conditions of a large mass fraction of the interstellar medium in galaxies, i.e. that consisting of warm molecular gas. From a SWS survey of rotational lines in nearby starburst and Seyfert galaxies, Valentijn et al. (1996) and Rigopoulou et al. (2002) obtained mass fractions of H2 in the warm phase of several percent. In ultraluminous galaxies observed with Spitzer, Higdon et al. (2006) derive much lower mass fractions of warm gas, but the fact that the majority of their sample has only upper limits for the S(0) line makes it possible that the temperatures are overestimated (because computed from the S(1) to S(3) lines only, whenever S(0) is undetected) and thus the masses of warm H2 underestimated.
This paper presents observations of warm molecular hydrogen in nearby galaxies obtained as part of SINGS (Kennicutt et al., 2003). From these data, we present quantifications of the temperatures and column densities of warm H2 encountered in kiloparsec-scale areas, mostly nuclear regions, and a comparison of the power emitted in the rotational lines with those produced by [SiII] at 34.8 m, which is the dominant cooling line of normal galaxies in the mid-infrared range, and by dust. We emphasize the different properties of star-forming regions and nuclei classified as LINERs or Seyferts, and discuss their H2 excitation mechanisms. The data, analysis methods and observational results are described in Sections 2 to 5.111For easier comparison to future observations and models, ascii flux tables of all the measured quantities are available upon e-mail request. The interpretation of the main findings is presented in Sections 6 and 7, and a summary of the results and conclusions can be found in Section 8.
2 Data and measurements
2.1 Targets
The SINGS sample (Kennicutt et al., 2003), comprising 75 galaxies, is intended to be a valuable representative set of local galaxies that are not ultraluminous, and whose moderate distances ensure that the properties of the interstellar medium can be studied at relatively small spatial scales (a few hundreds of parsecs at the shortest wavelengths). Numerous sources with mild starbursts or low-luminosity active nuclei are included. Of this sample, we excluded from the present study the objects that were not observed in spectroscopic mode because of their very low brightness (DDO 154, Ho I, M81 dwA, M81 dwB), or containing very little dust and nebular emission within the nuclear area mapped by the high spectral resolution modules (the quiescent ellipticals NGC 584 and NGC 1404, the quiescent dwarf galaxies DDO 53, DDO 165, Ho IX and the asymmetric magellanic galaxies NGC 4236, NGC 5398, NGC 5408 and IC 4710). The dwarf galaxies IC 2574 and NGC 5474 were also rejected because they lack observations in some of the spectroscopic modules. Of the two star-forming dwarf galaxies with several extranuclear pointings, Ho II and NGC 6822, we retained only NGC 6822 here; the regions within Ho II are indeed two faint to allow an analysis of the H2 excitation diagram, contrary to some regions within NGC 6822. Low-mass galaxies with extranuclear pointings will be discussed elsewhere. NGC 3034 (M 82) was excluded due to the unavailability of nuclear spectroscopy from SINGS, as well as NGC 1377, which constitutes a galaxy class of its own very different from the rest of the SINGS sample, and has been discussed separately (Roussel et al., 2006). The sample for H2 measurements comprises 66 targets in 57 galaxies (Table 2). The pointings are centered either on the nuclear regions (for most targets) or on some bright star-forming complexes (for a few dwarf galaxies and a spiral galaxy). Diffuse regions within galactic disks are not covered by the present study.
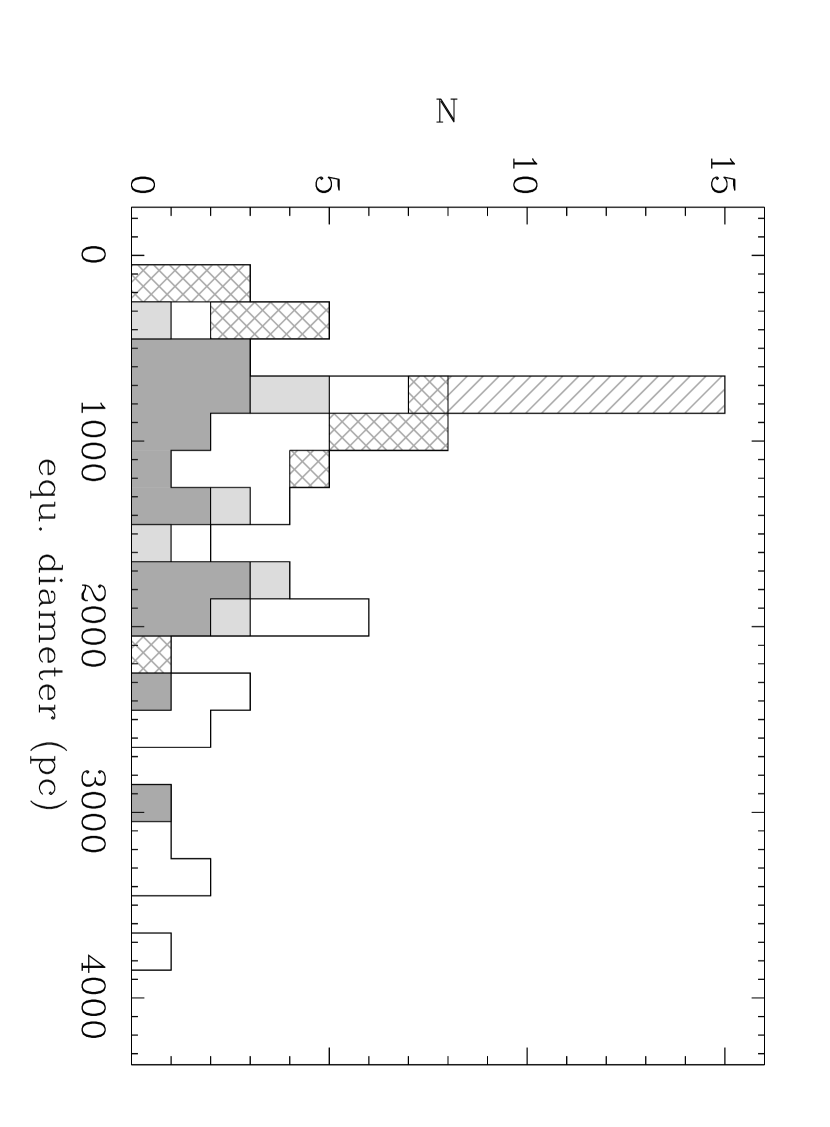
The aperture over which we extracted the spectra is the intersection of the various areas covered by all four spectroscopic modules. The central position and solid angle of this aperture, used to measure all the quantities presented in this paper (line and continuum fluxes), is listed for each galaxy in Table 2. In practice, the limiting size is that of the maps performed with the high-resolution modules, which were enlarged in a few cases in order to cover the emission from a star-forming circumnuclear ring. At the distances of the targets, the equivalent linear diameters of the apertures range from 60 pc to 3.8 kpc (distribution shown in Fig. 1), and the median is 900 pc. Although the apertures are in general small fractions of the optical extent of the galaxies, the measurements are still averages over very large and complex areas. It is expected that a large number of disconnected star formation sites, in addition to the nucleus, contribute to the total emission.
2.2 Broadband imaging
To estimate flux densities of the dust continuum and of the aromatic bands (also referred to as the emission from PAHs, or polycyclic aromatic hydrocarbons), we used images in the 3.6 m and 7.9 m bands of the IRAC camera (Fazio et al., 2004), and scan maps in the three bands of the MIPS instrument (Rieke et al., 2004) at effective wavelengths of 24, 71 and 156 m. Since in early-type galaxies photospheric emission can make an important contribution to 7.9 m fluxes, we subtracted an estimate of this component in order to obtain pure measurements of aromatic band emission. To this effect, we scaled 3.6 m fluxes, assumed to be dominated by stellar emission, as described in Helou et al. (2004). The resulting flux densities are noted .
The observing strategy and data reduction are described by Kennicutt et al. (2003). The full width at half maximum of the point spread function (PSF) is close to 2″ at 7.9 m, 6″ at 24 m, 18″ at 71 m and 40″ at 156 m. Flux calibration uncertainties are of the order of 10% in the IRAC bands, and 5%, 10% and 15% in the MIPS 24, 71 and 156 m bands, respectively. To correct for the effects of light scattering in IRAC arrays, we applied to flux densities measured from IRAC maps corrective factors that are appropriate for the photometry of extended sources within apertures of arbitrary size (derived by T. Jarrett and published by Dale et al., 2007). For our apertures, the correction factor at 7.9 m is of the order of 10%.
2.3 Spectroscopic data
The targets were observed in mapping mode with the IRS instrument (Houck et al., 2004), at low spectral resolution between 5 and 38 m, with the SL and LL slits (–130) and at high spectral resolution between 10 and 37 m, with the SH and LH slits (). The observing strategy is described by Kennicutt et al. (2003) and Smith et al. (2004). The data were pre-processed with the S13 version of the Spitzer Science Center pipeline. Pixels with an abnormal responsivity were masked, and spectral cubes were built with the Cubism software (Smith et al., 2007a). The flux calibration was performed as described by Roussel et al. (2006). We checked the accuracy of this procedure by systematically comparing broadband fluxes from imaging observations and from spectra, and line fluxes from high and low spectral resolution spectra, for bright lines that are minimally contaminated by broad aromatic features at low resolution (but note that even if the flux calibrations of the different modules were in perfect agreement, deviations would be expected from slight misalignment between the apertures). We obtain (for targets with Jy within a diameter of about 50″), (for targets with Jy within a diameter of about 30″ and accurately determined backgrounds in SL maps), , and (for targets with line fluxes above ).
2.4 Measurements
The S(0) to S(3) rotational transitions of H2 (Table 1) were measured for all targets. In addition, we measured the S(4) to S(7) transitions in three galaxies in which these lines are bright enough to become detectable at low spectral resolution (see Table 3).
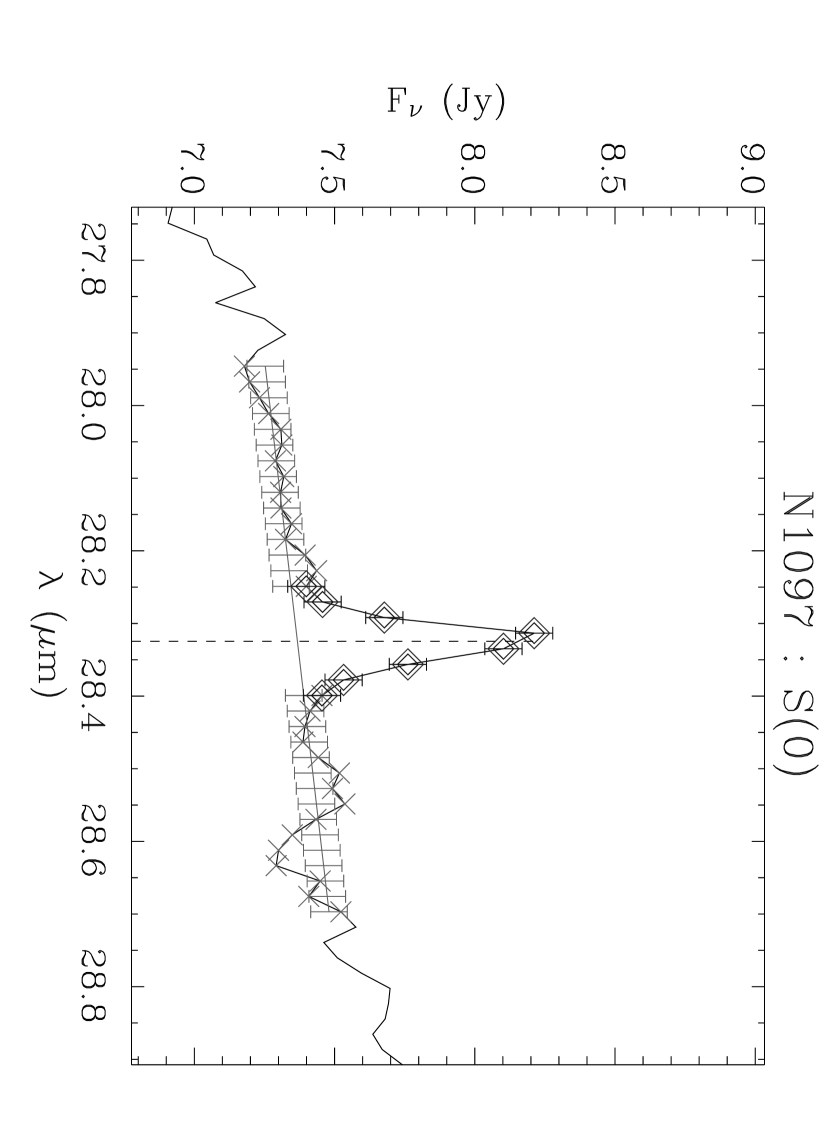
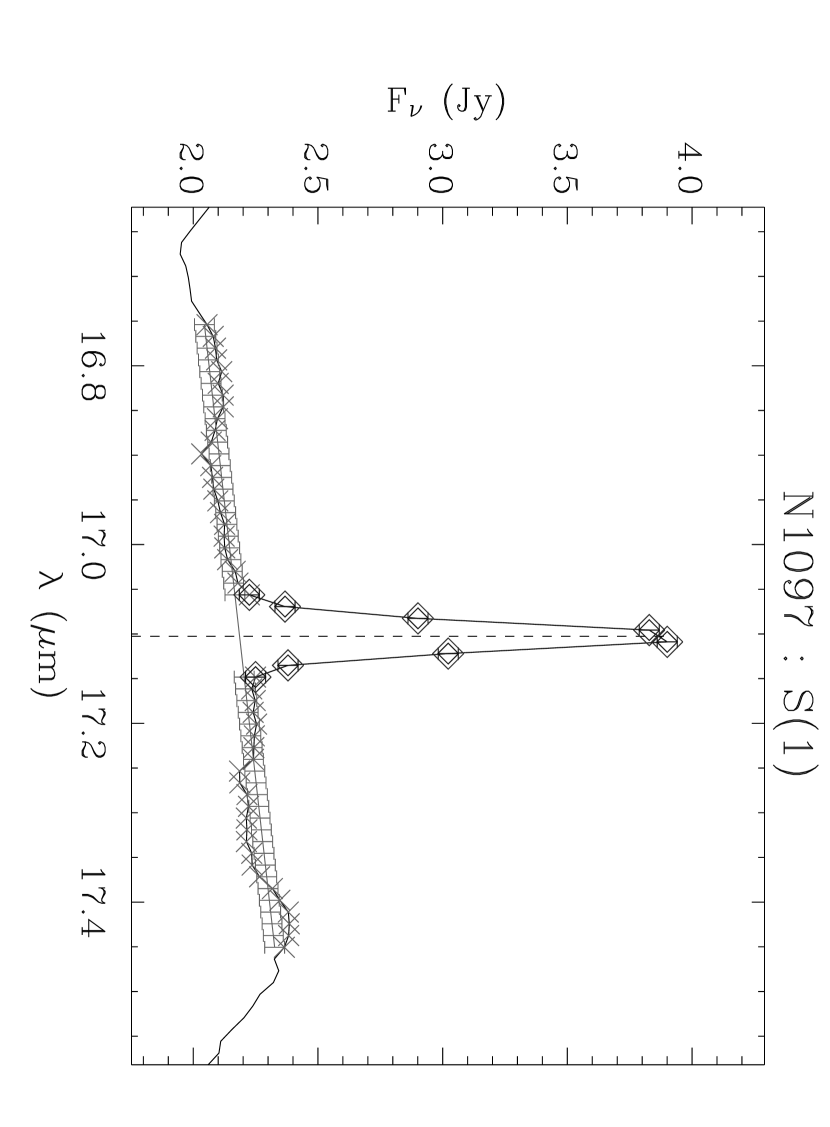
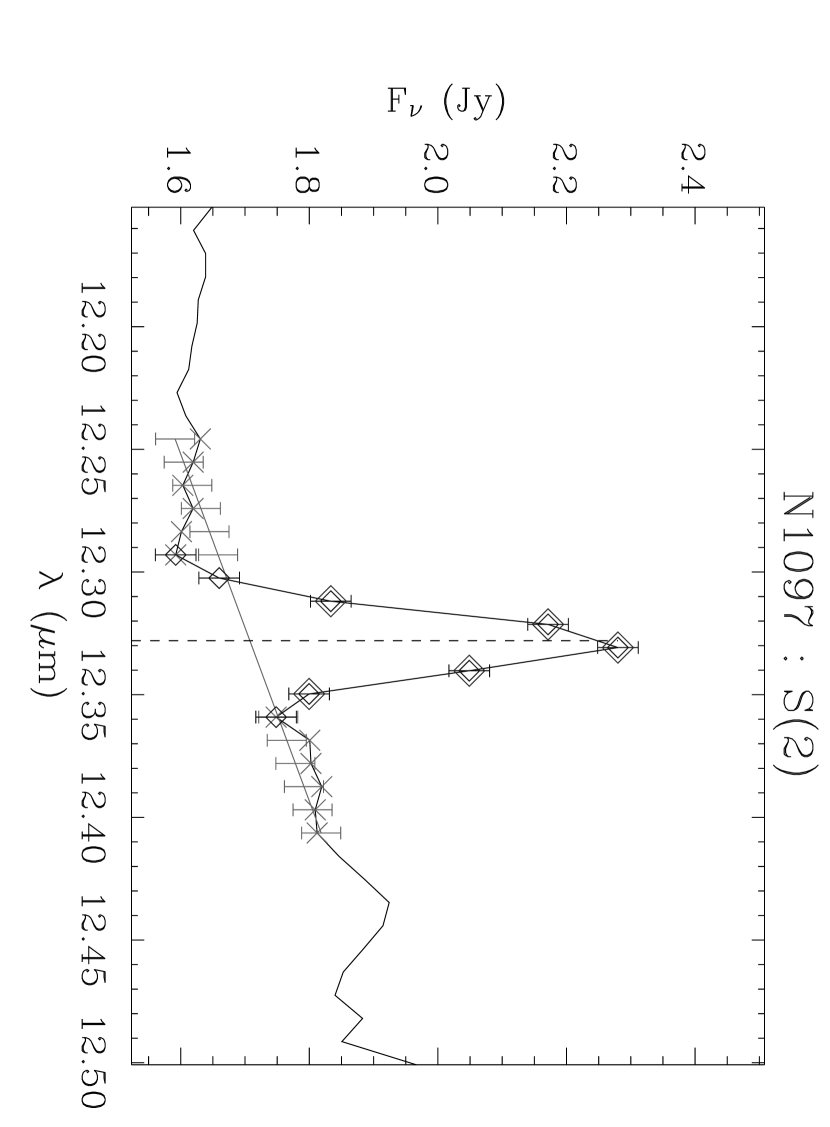
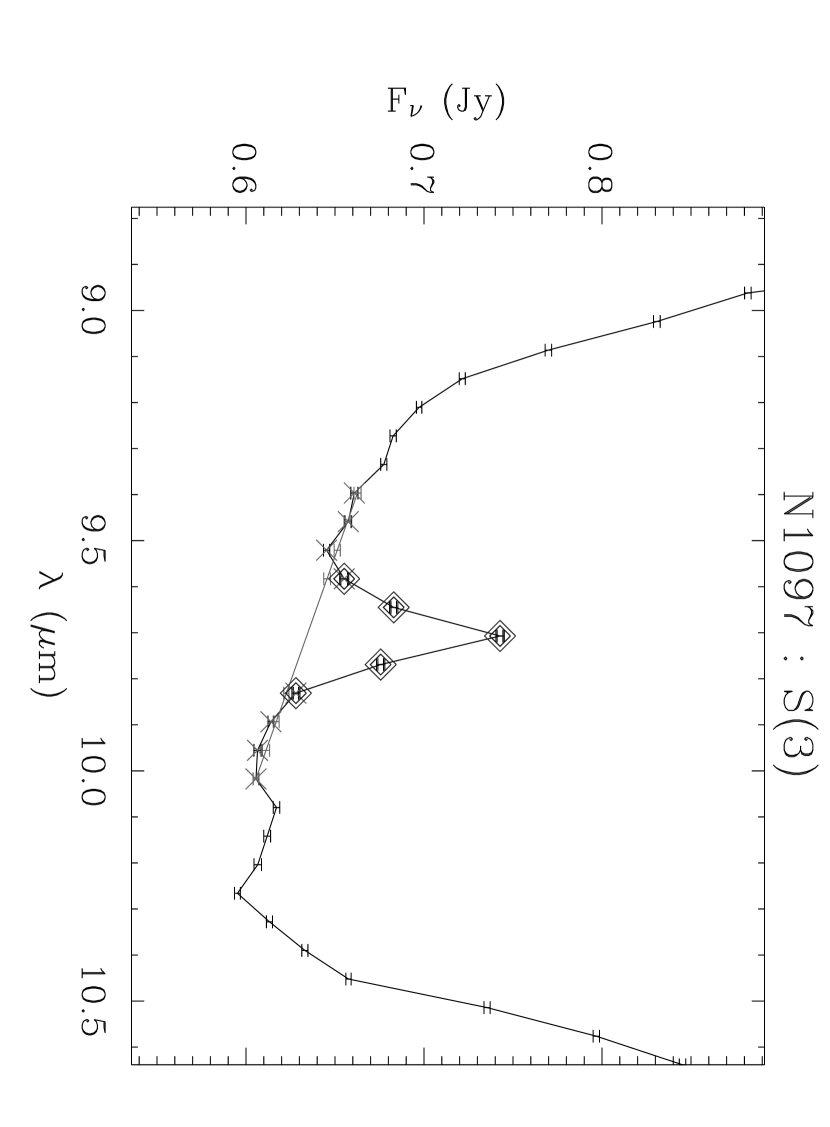
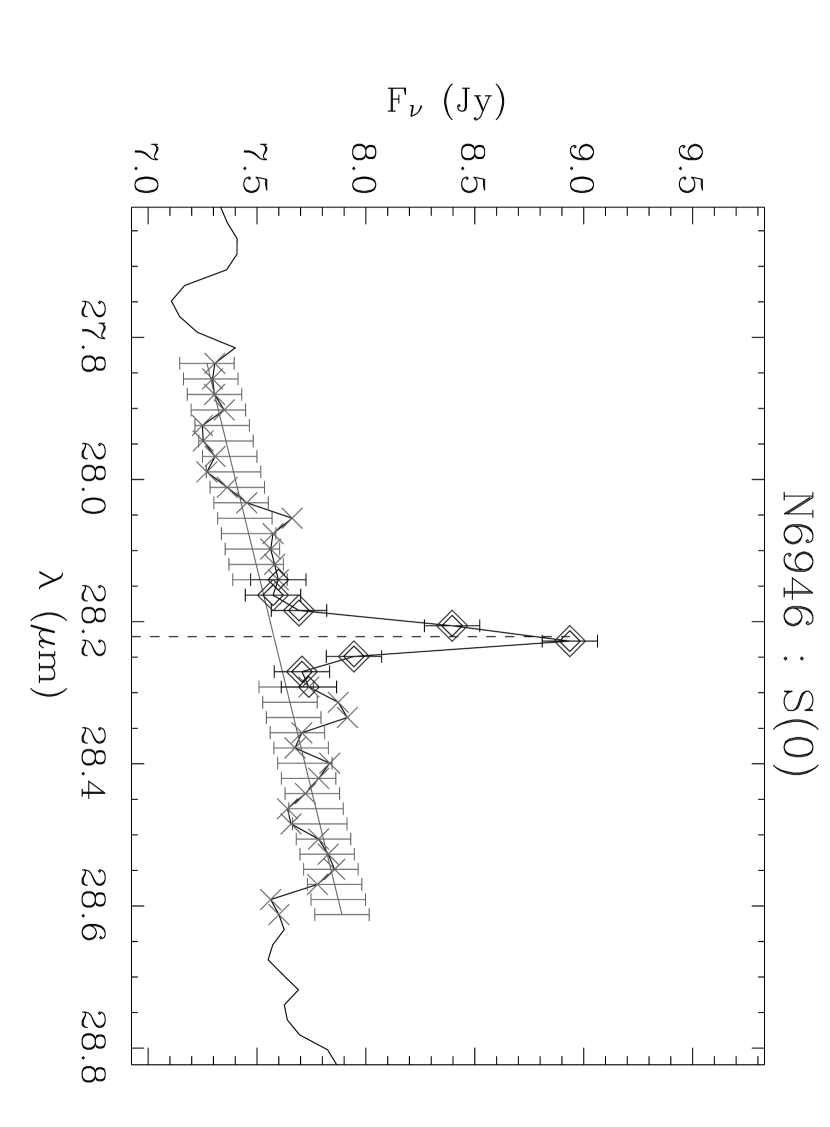
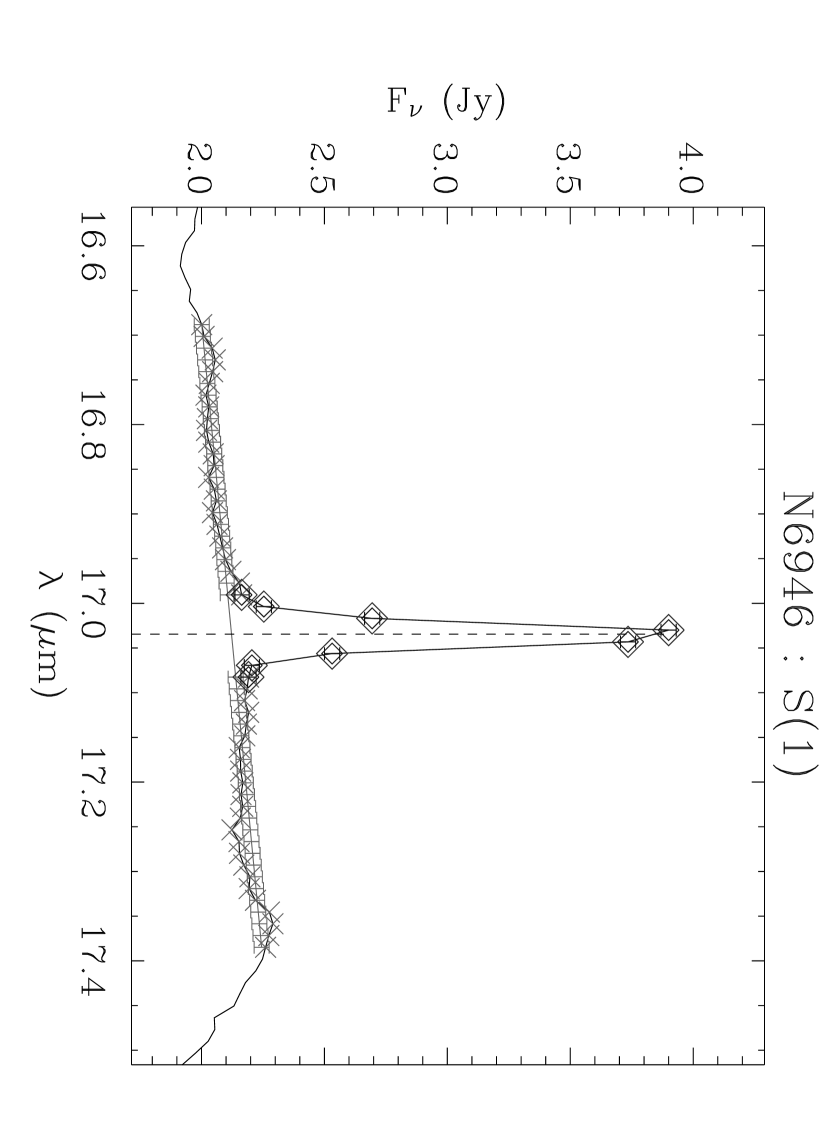
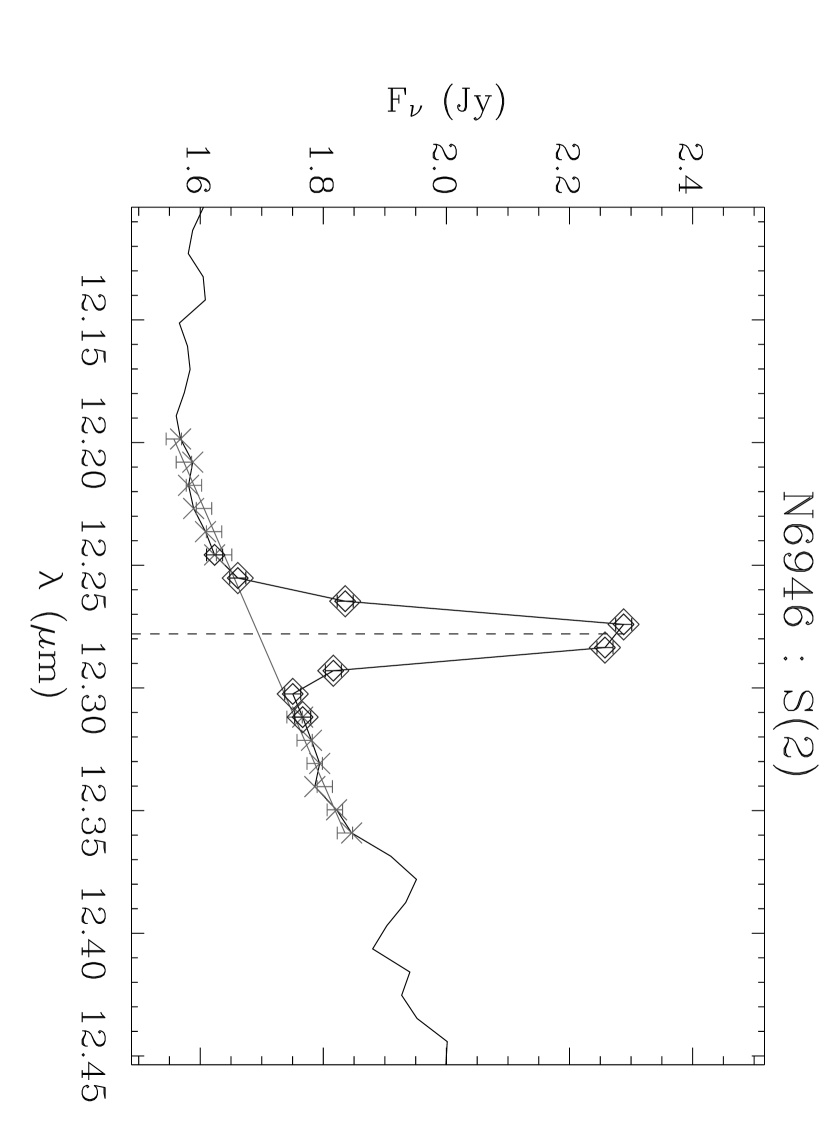
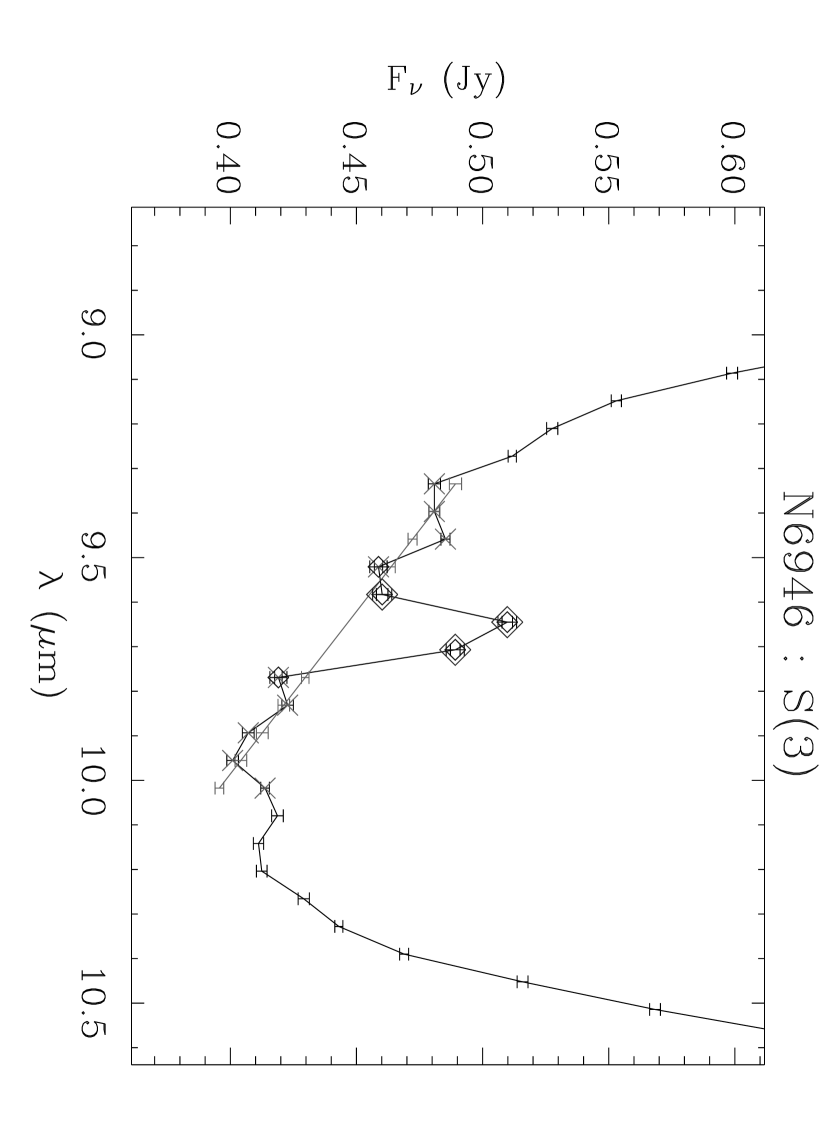
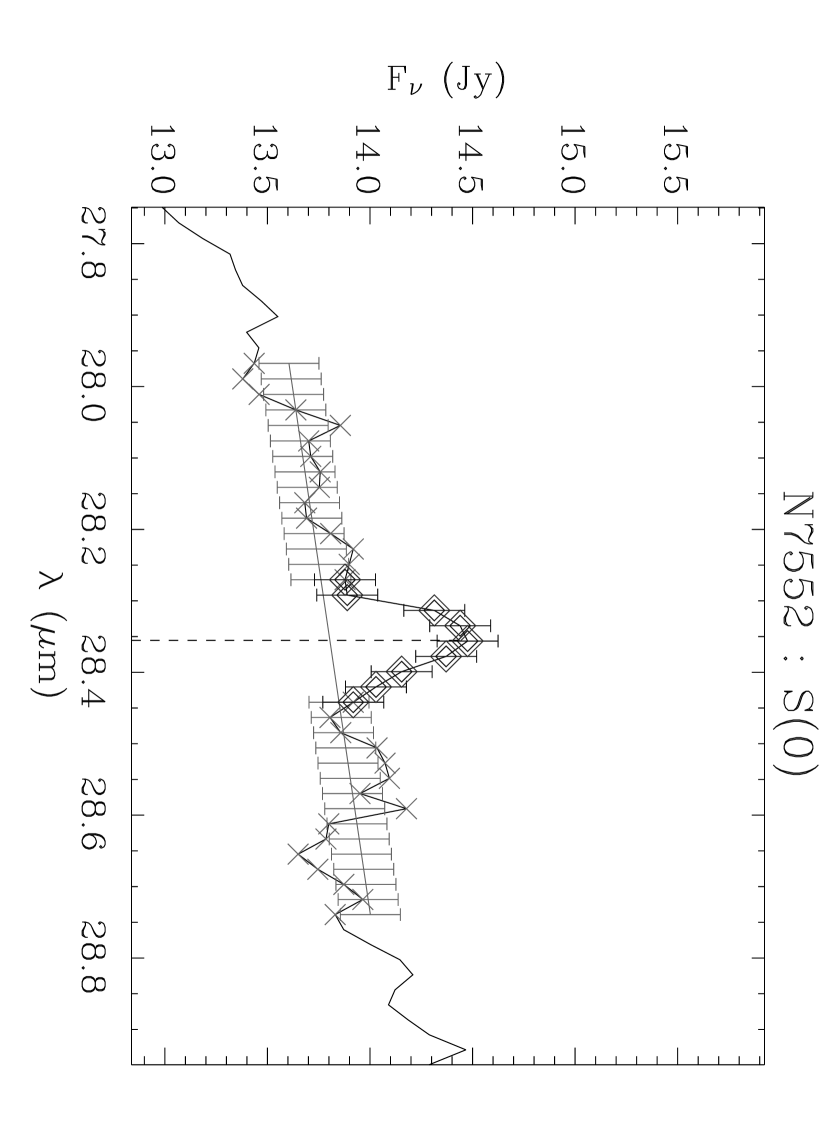
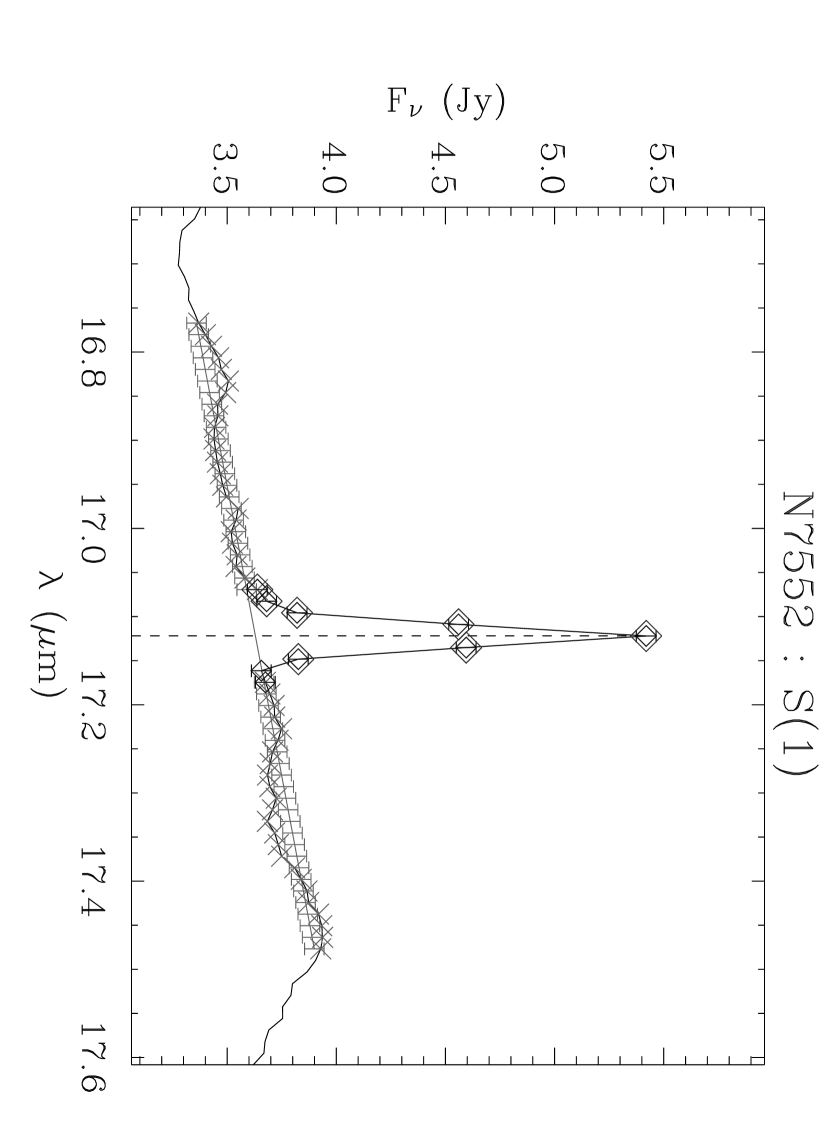
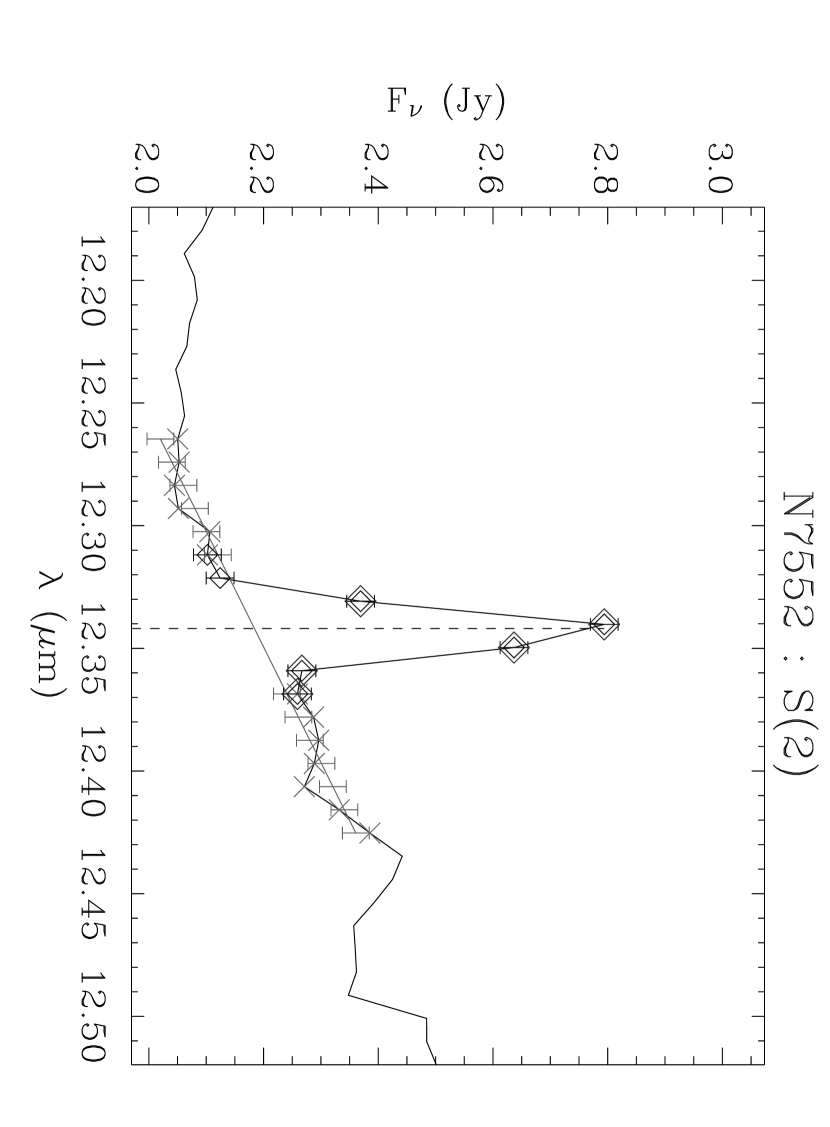
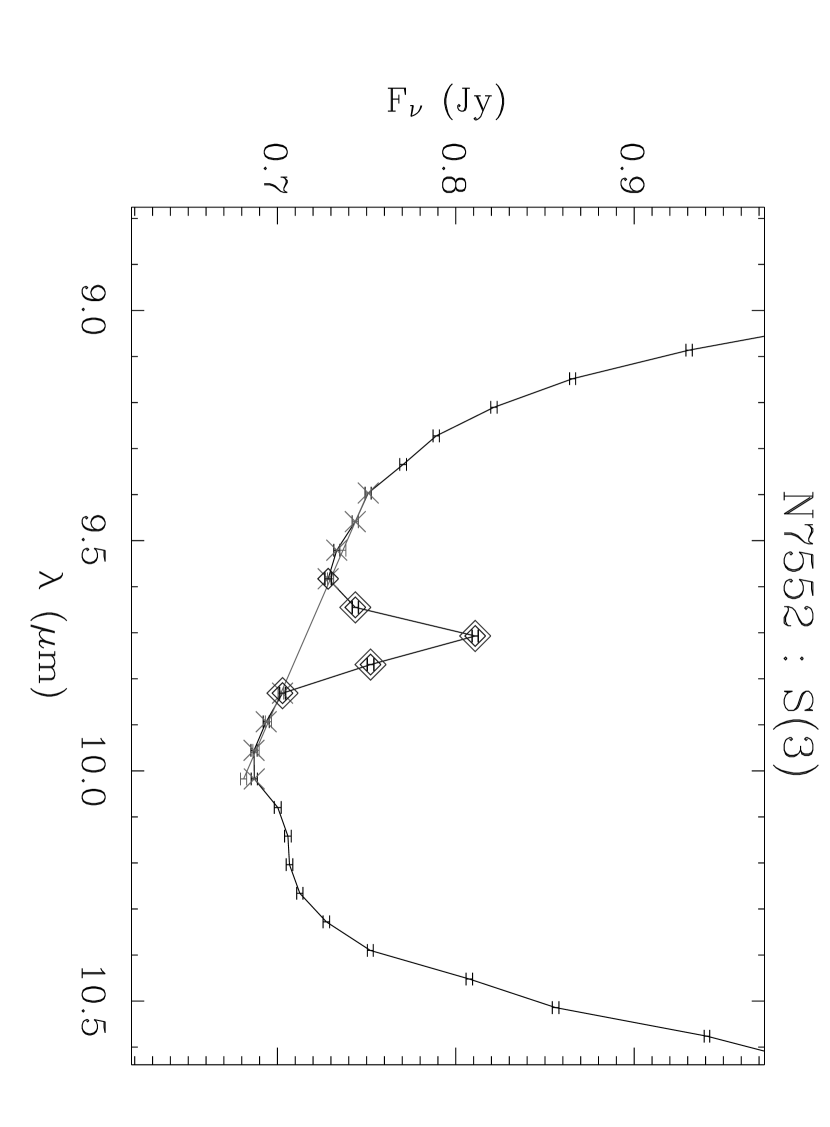
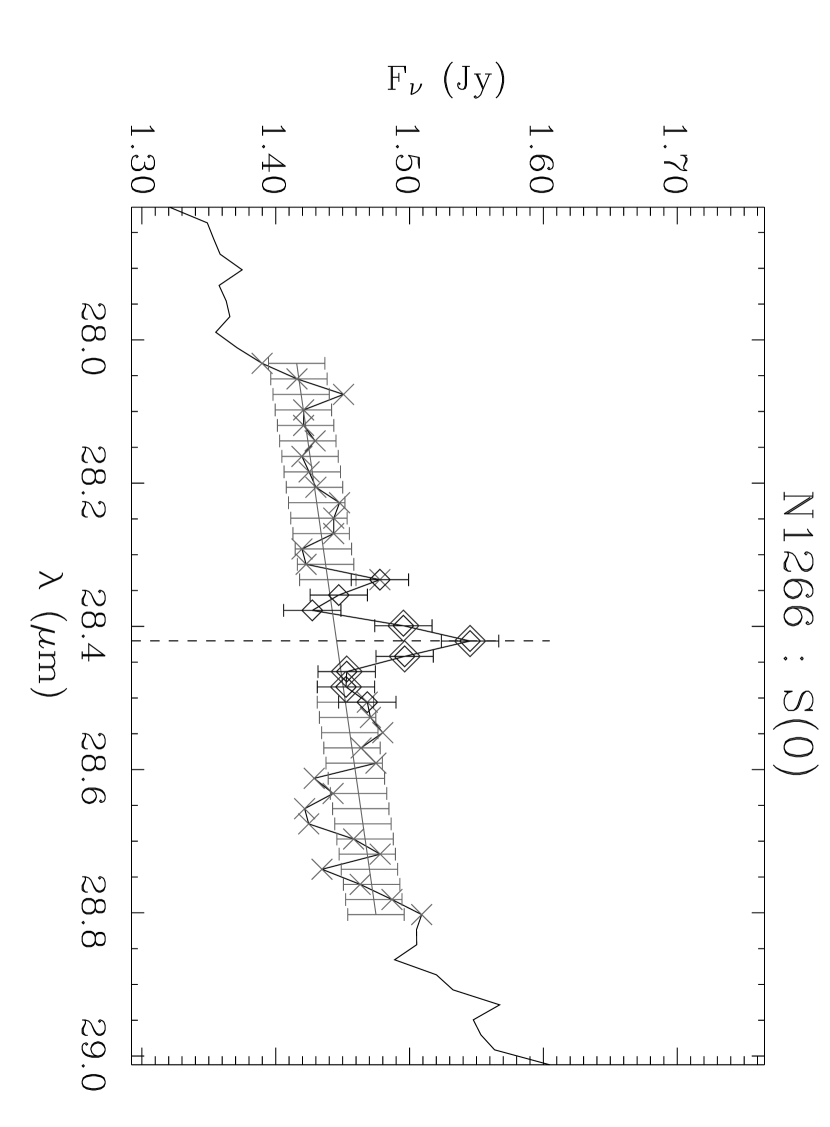
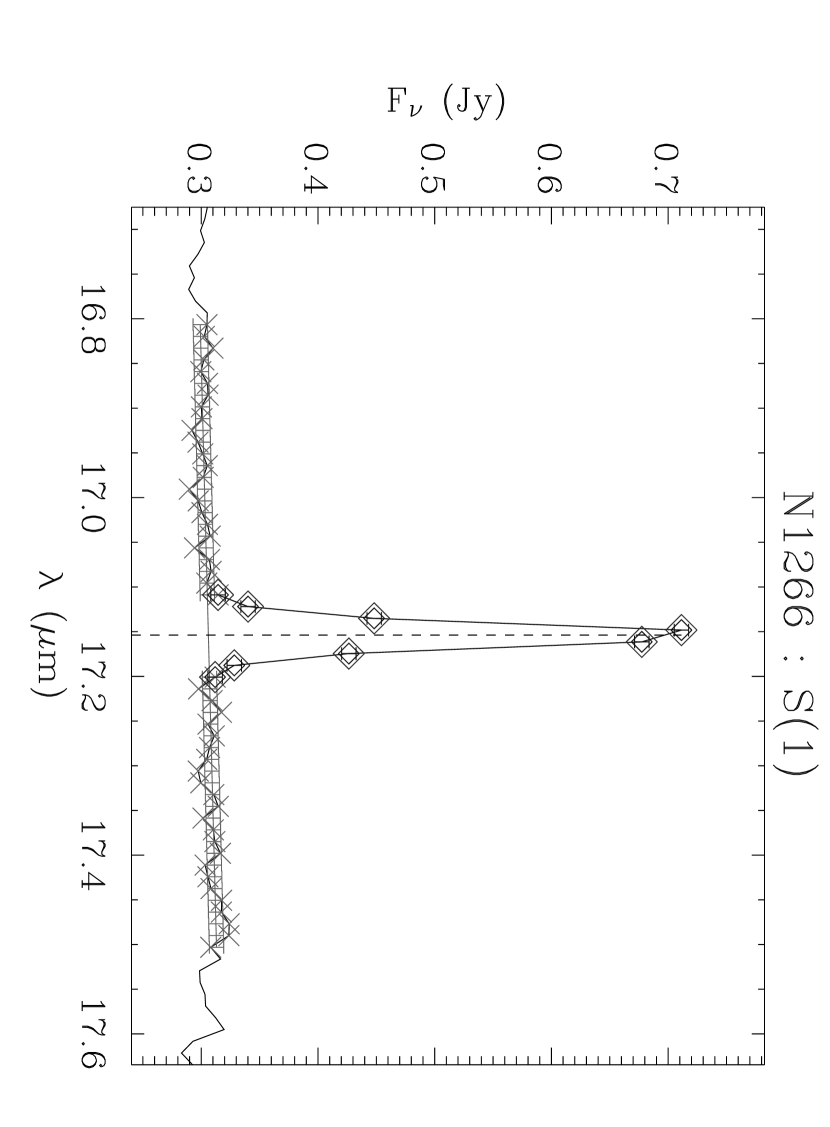
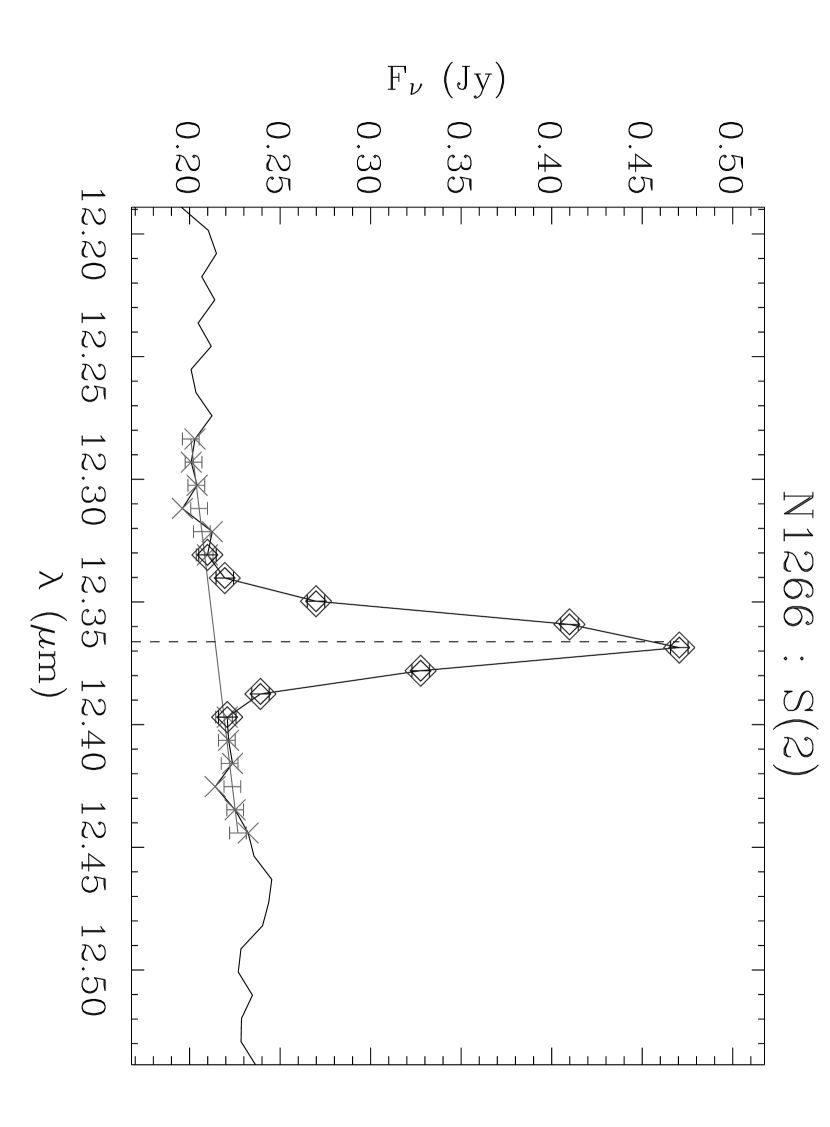
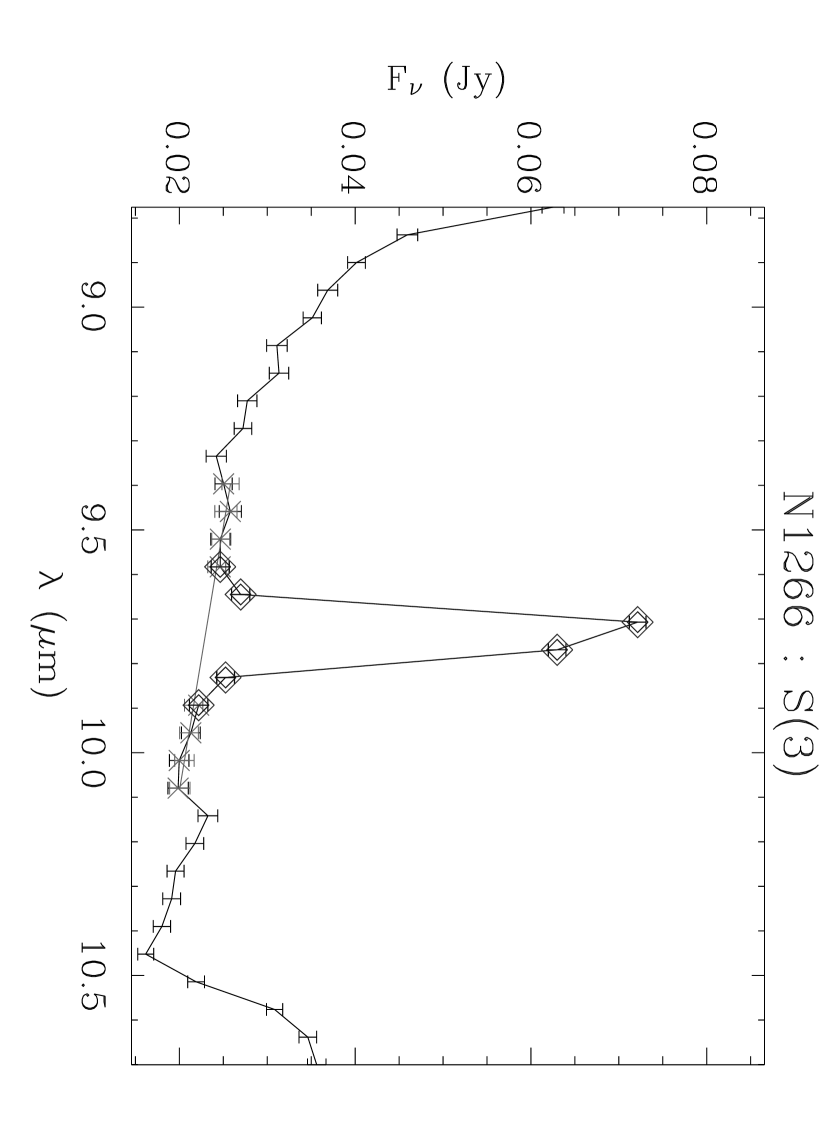
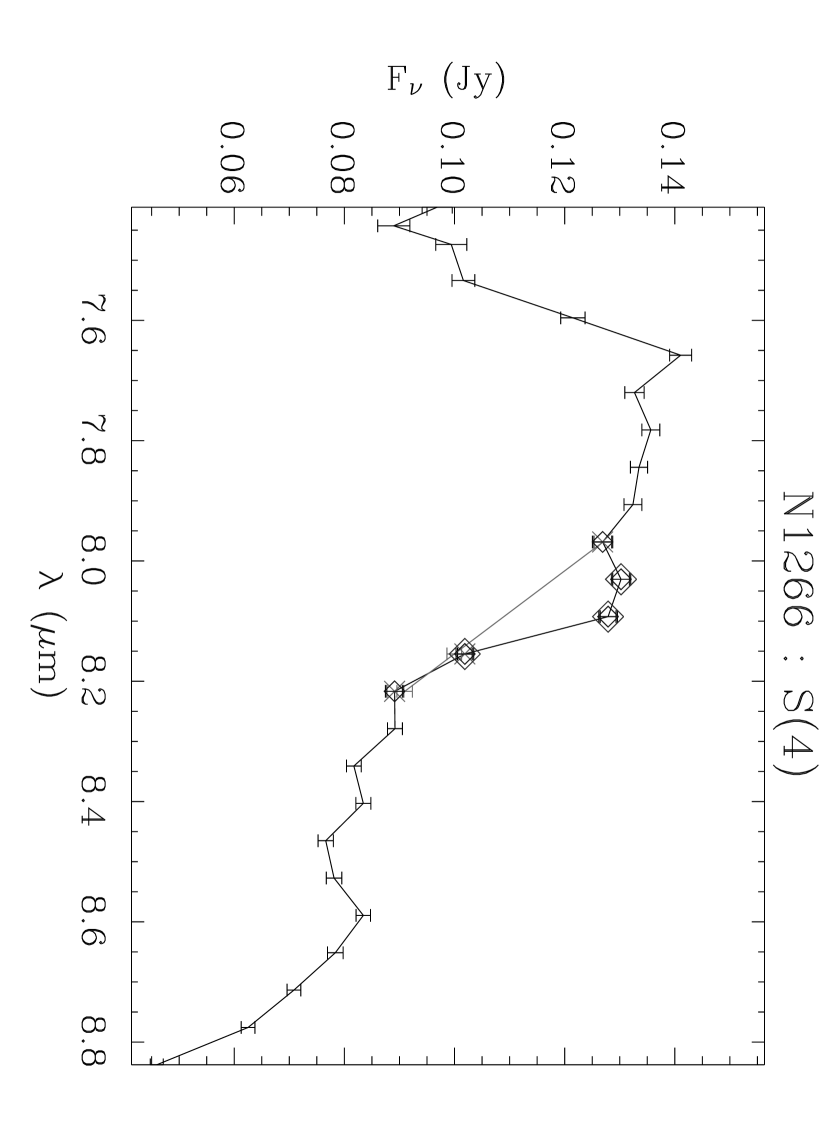
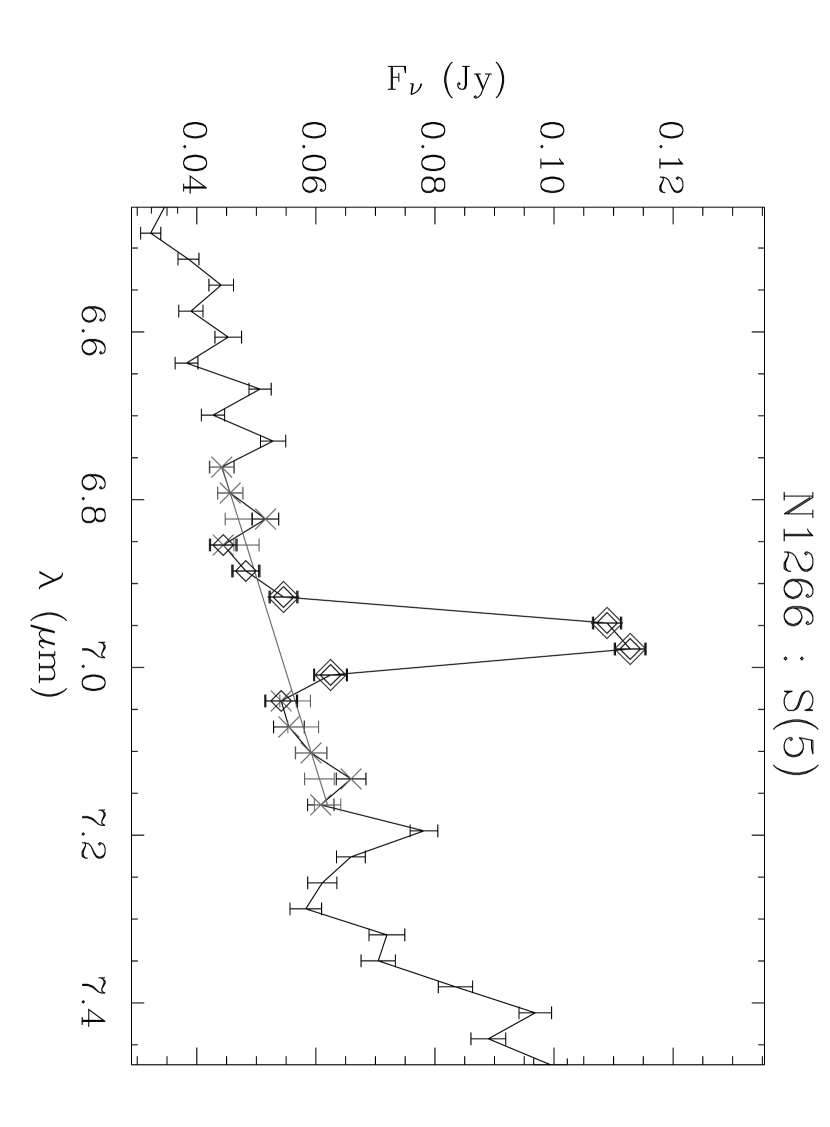
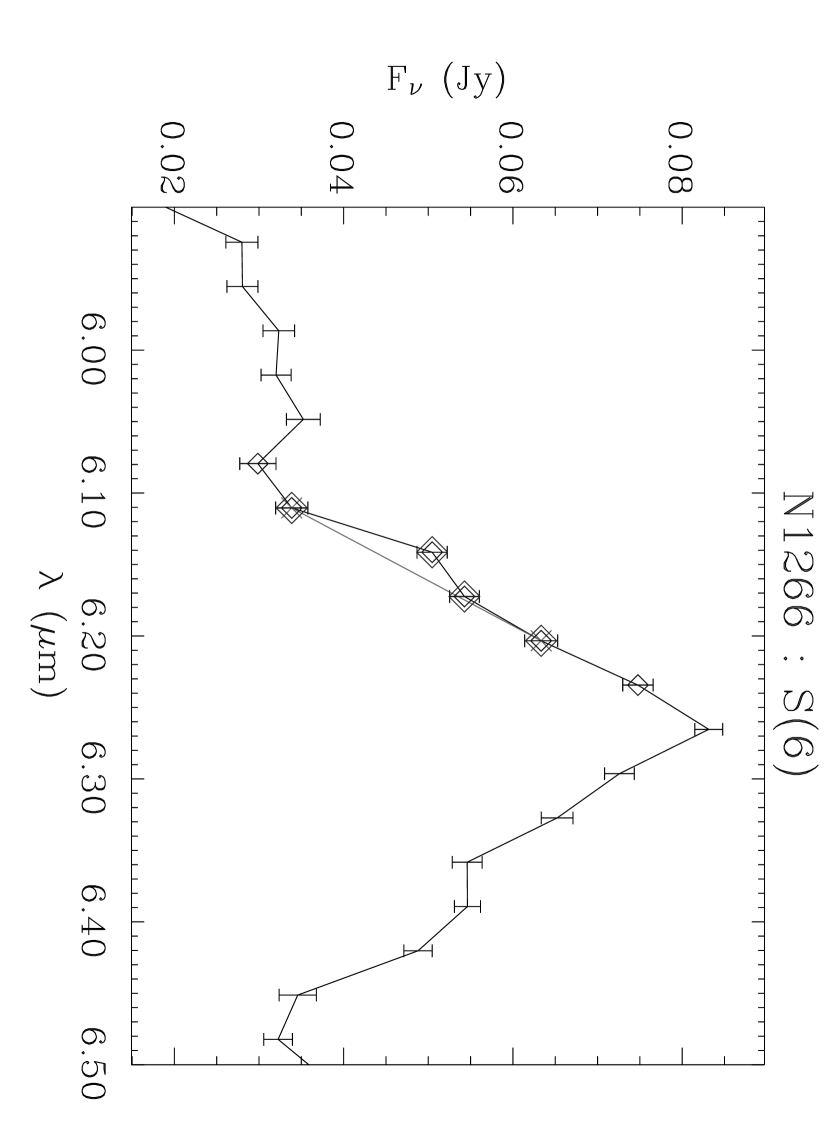
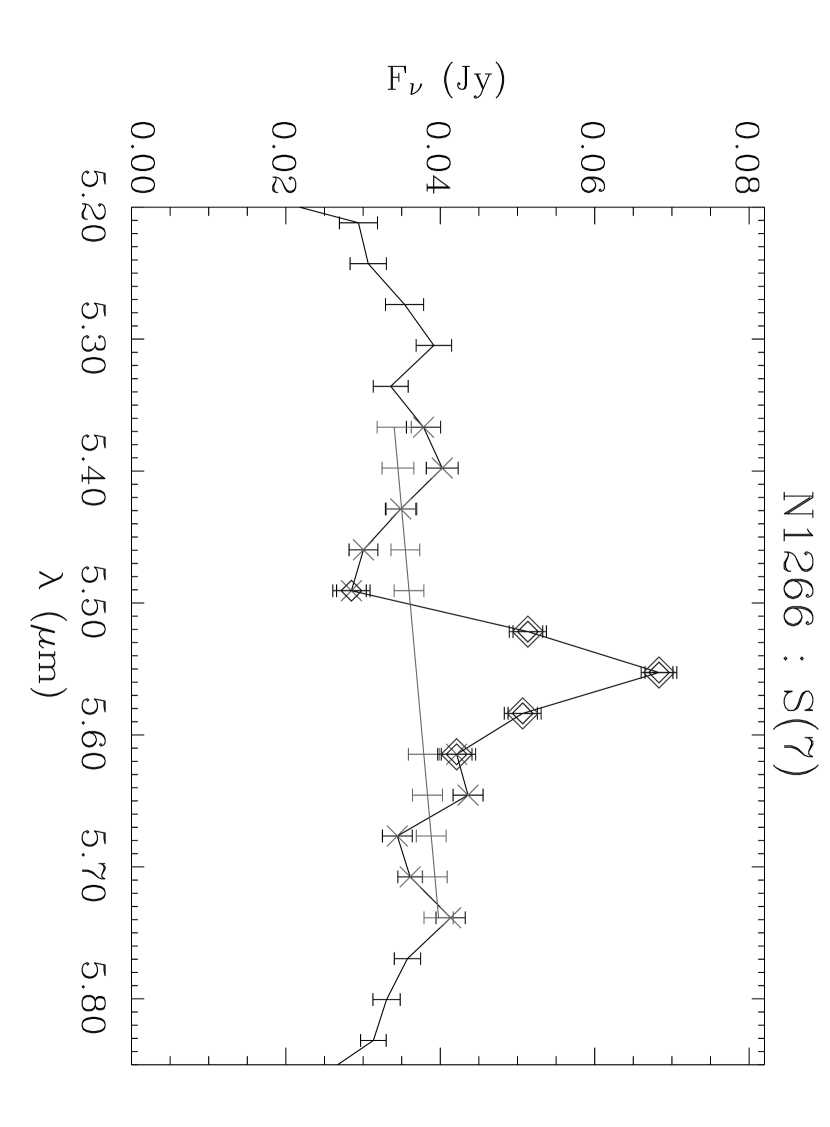
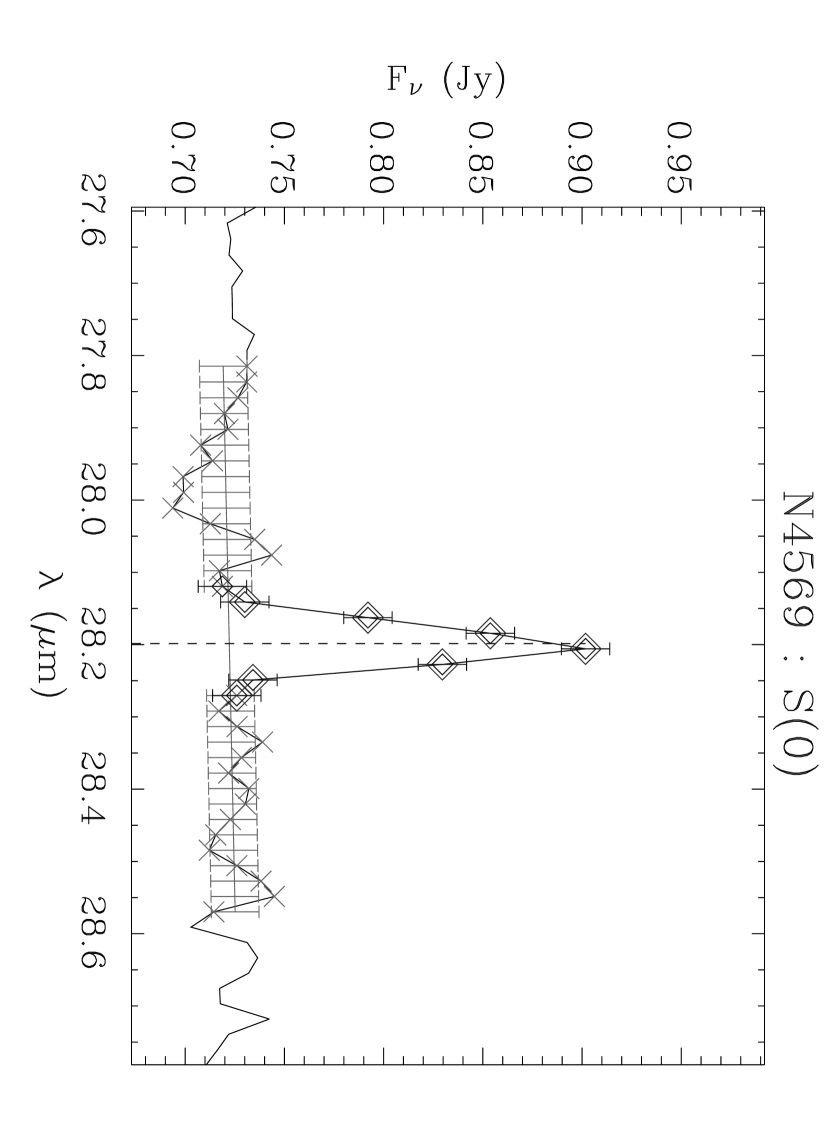
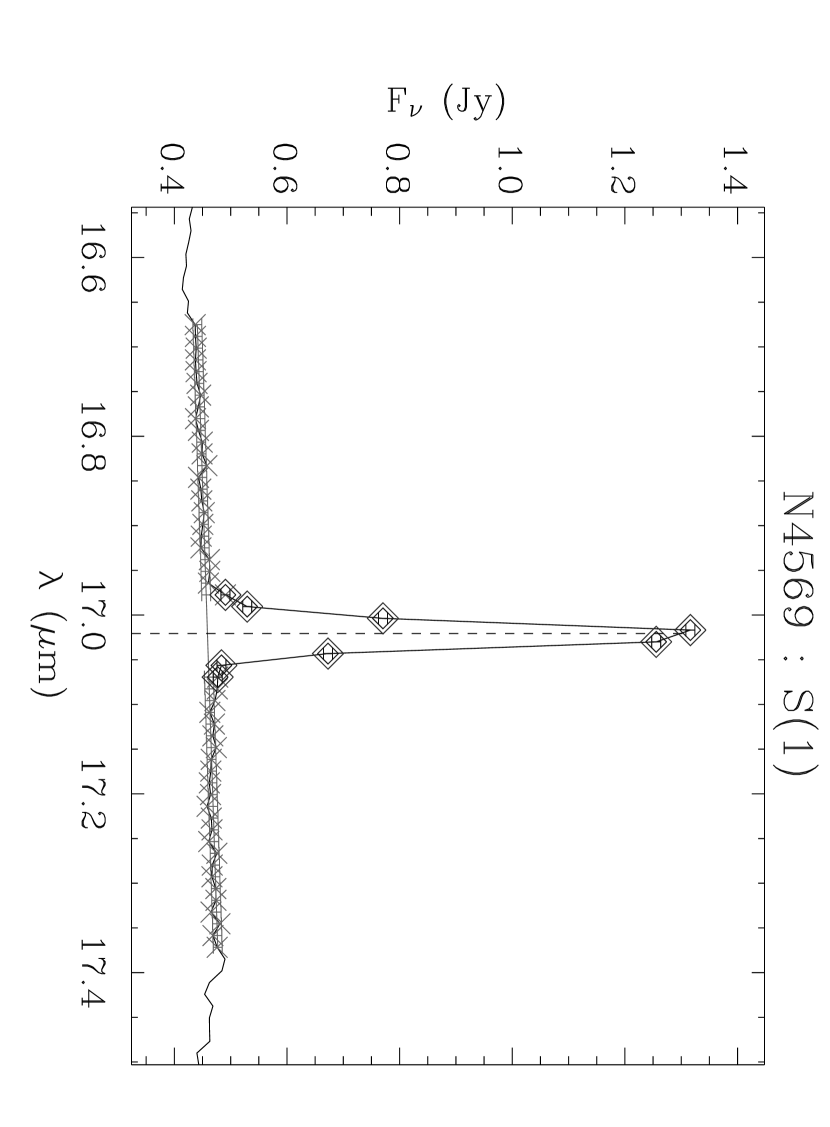
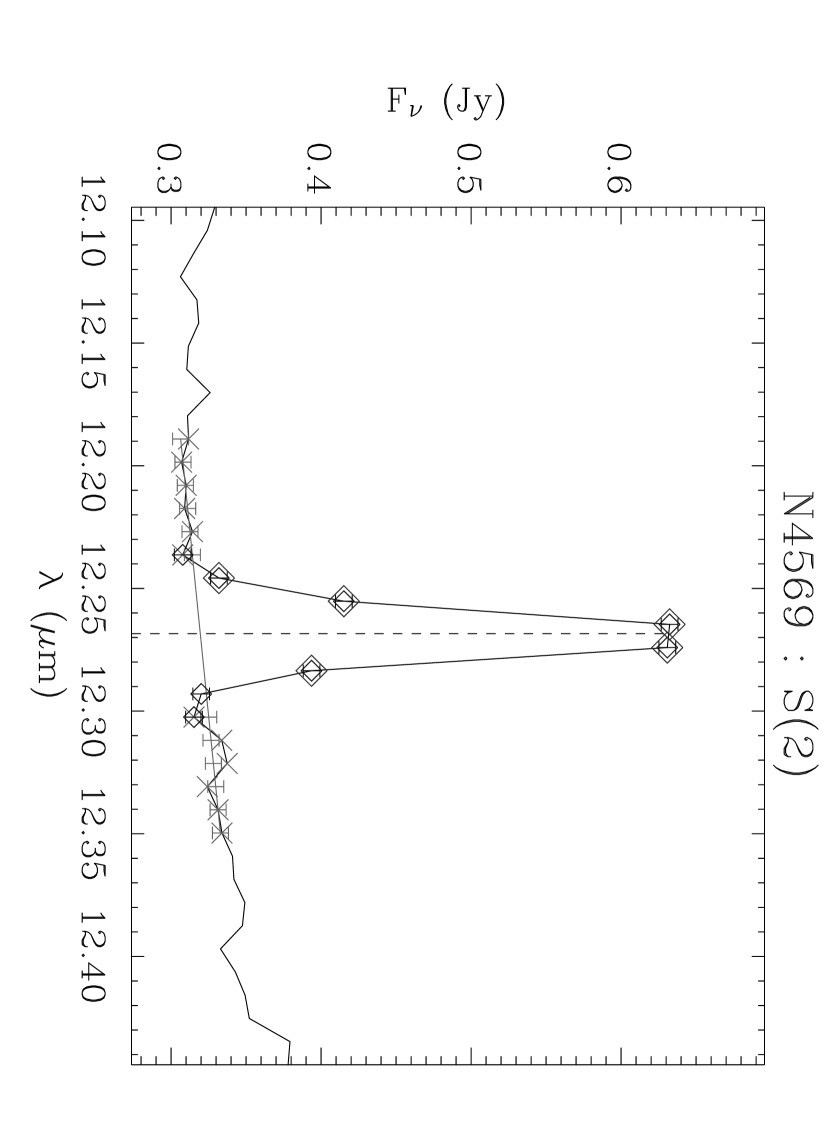
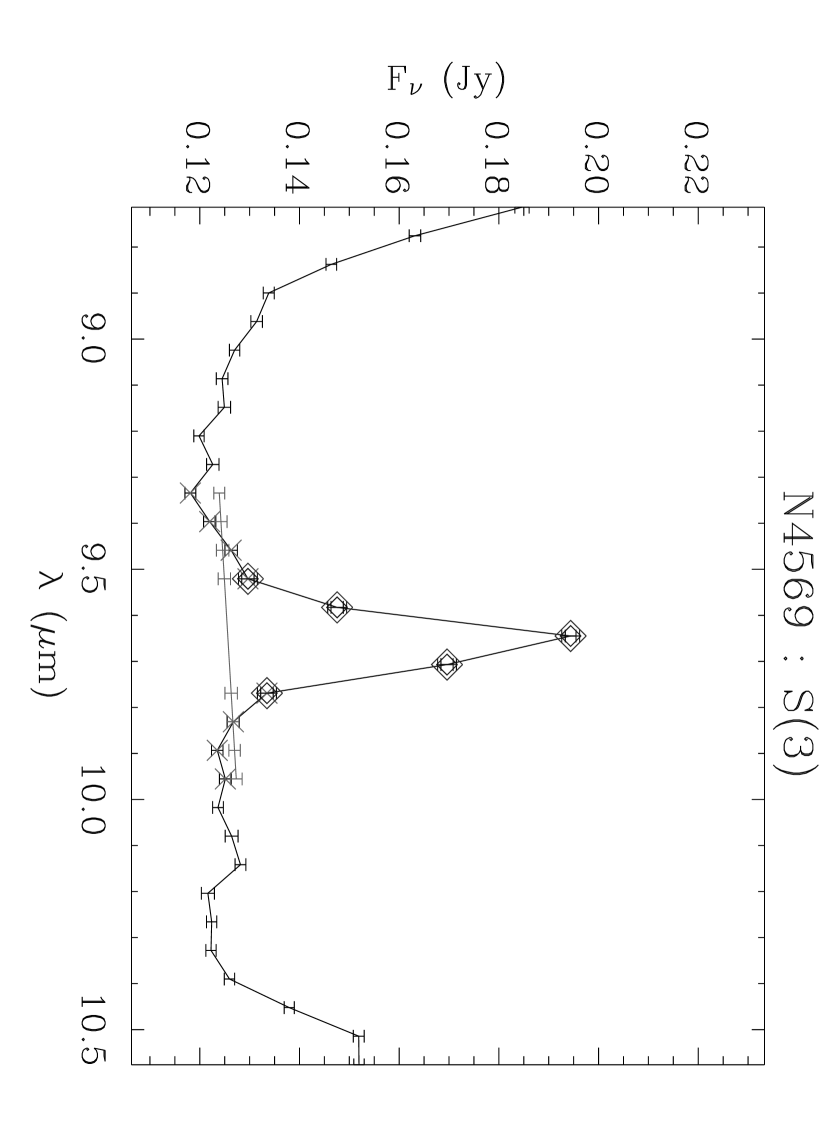
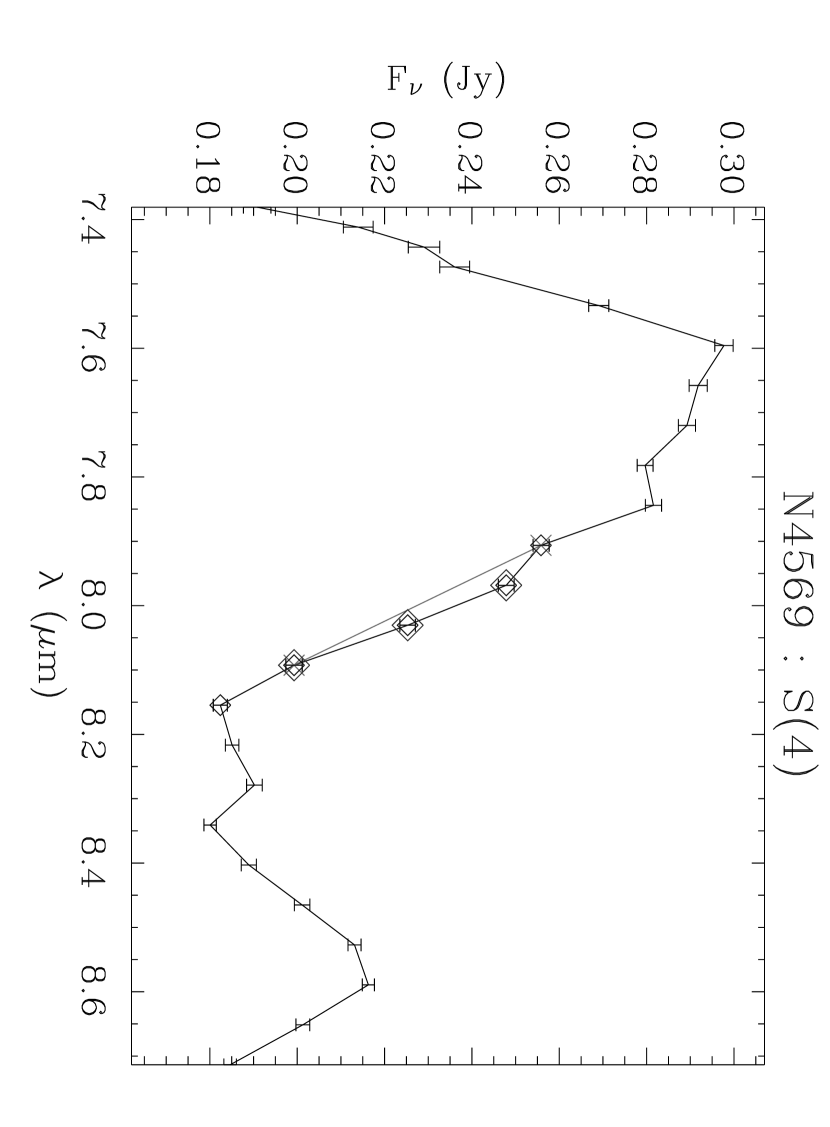
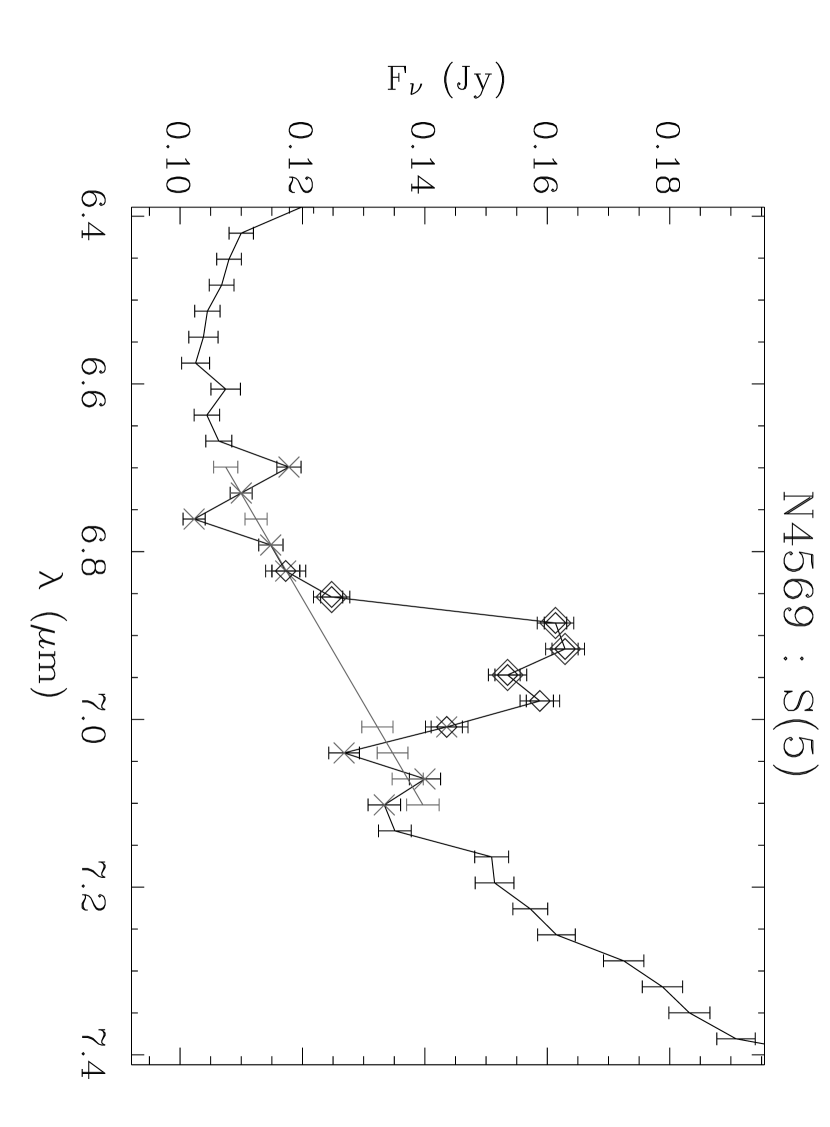
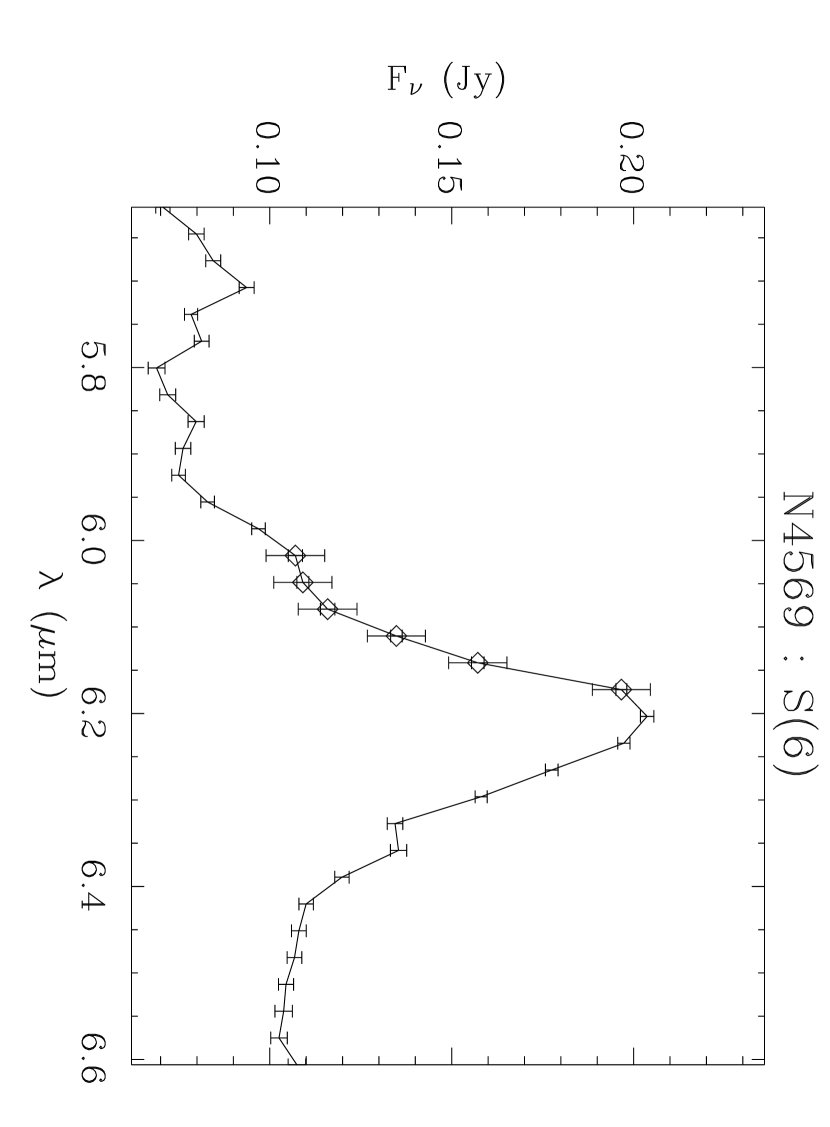
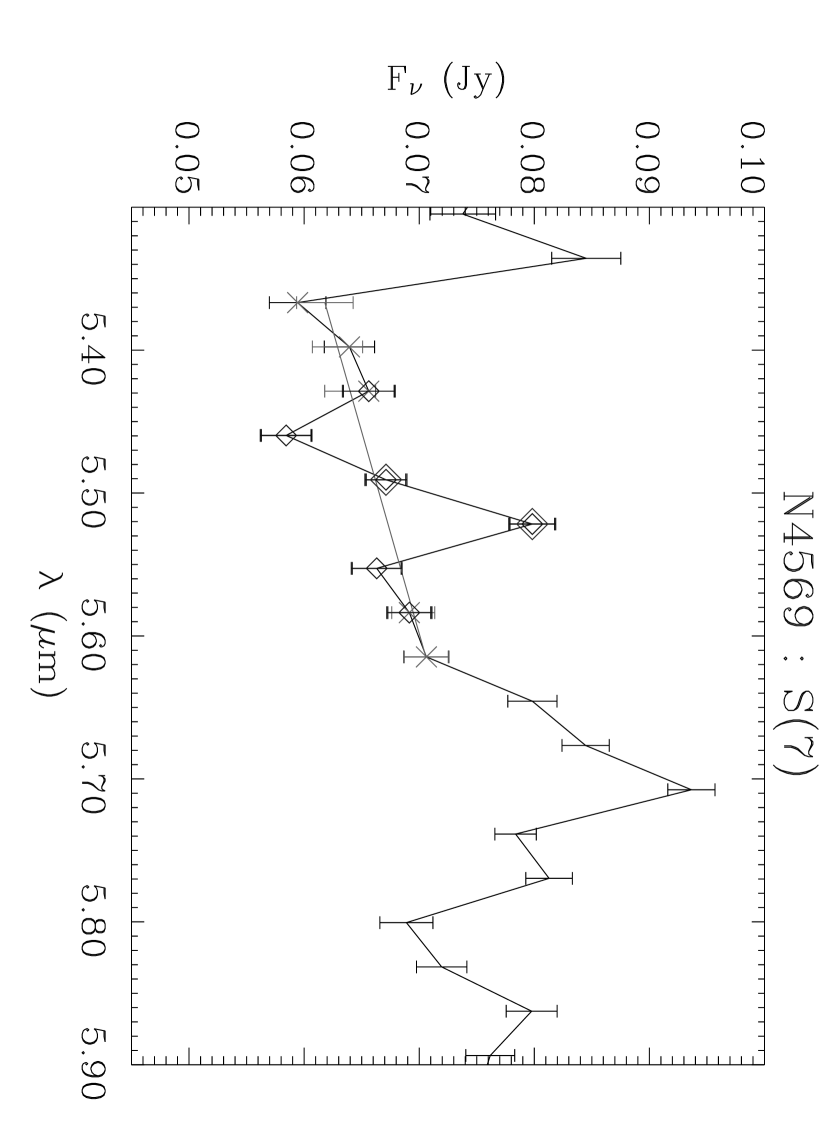
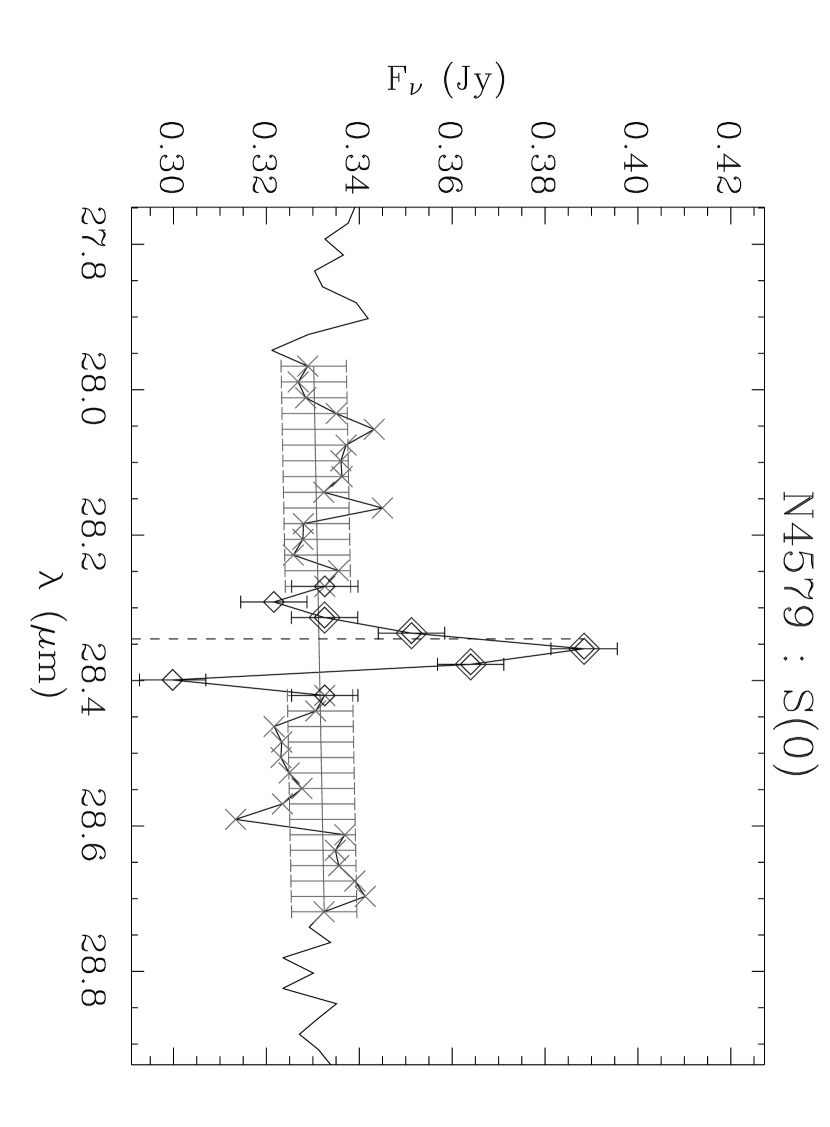
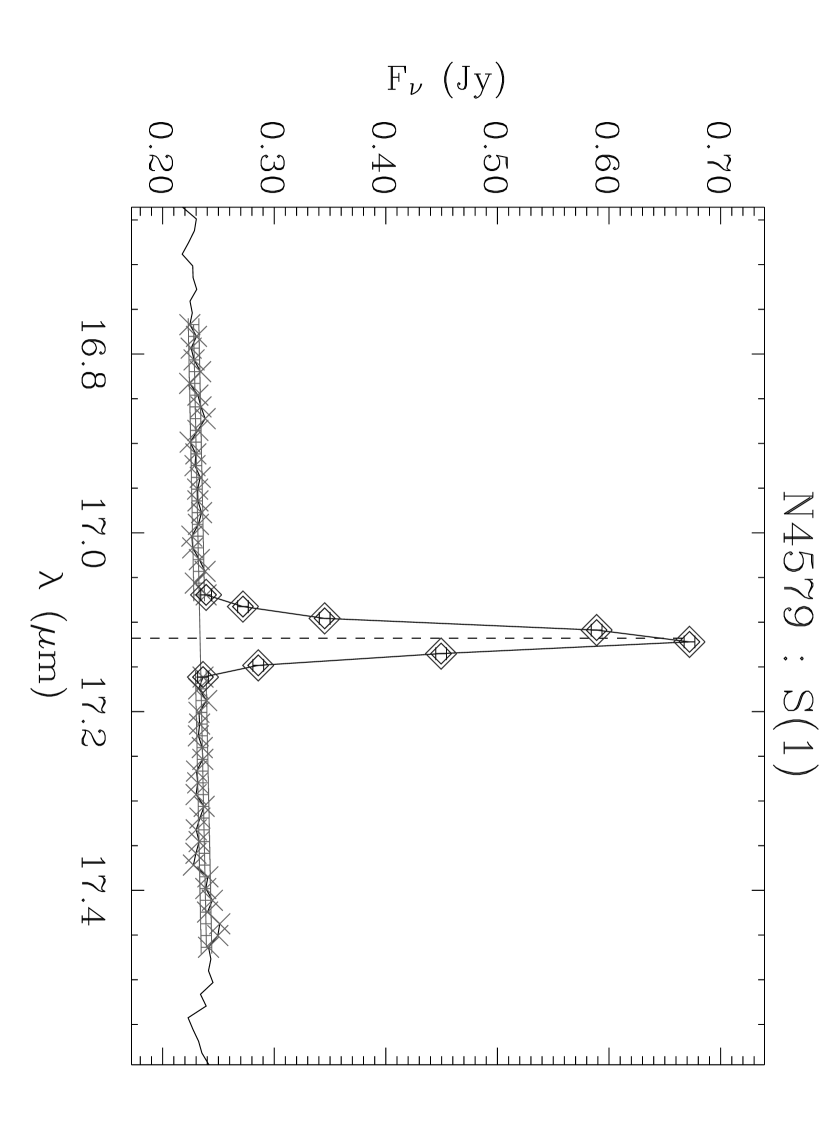
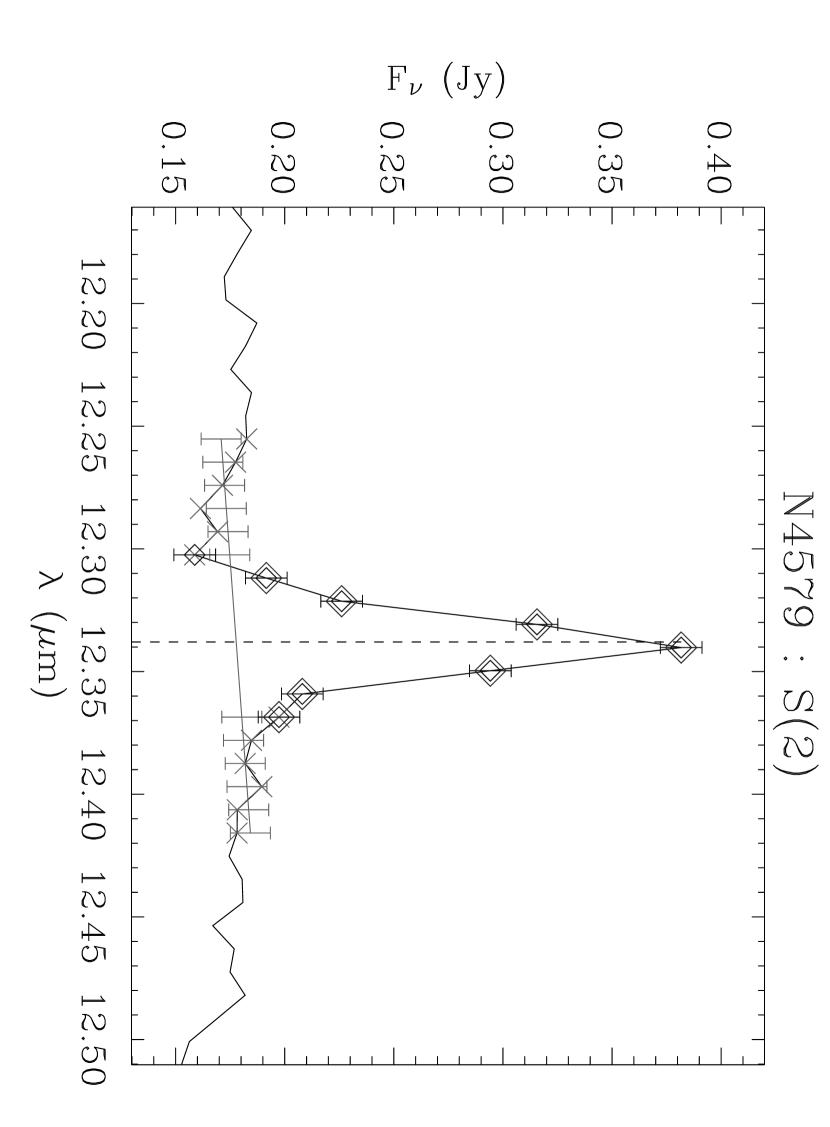
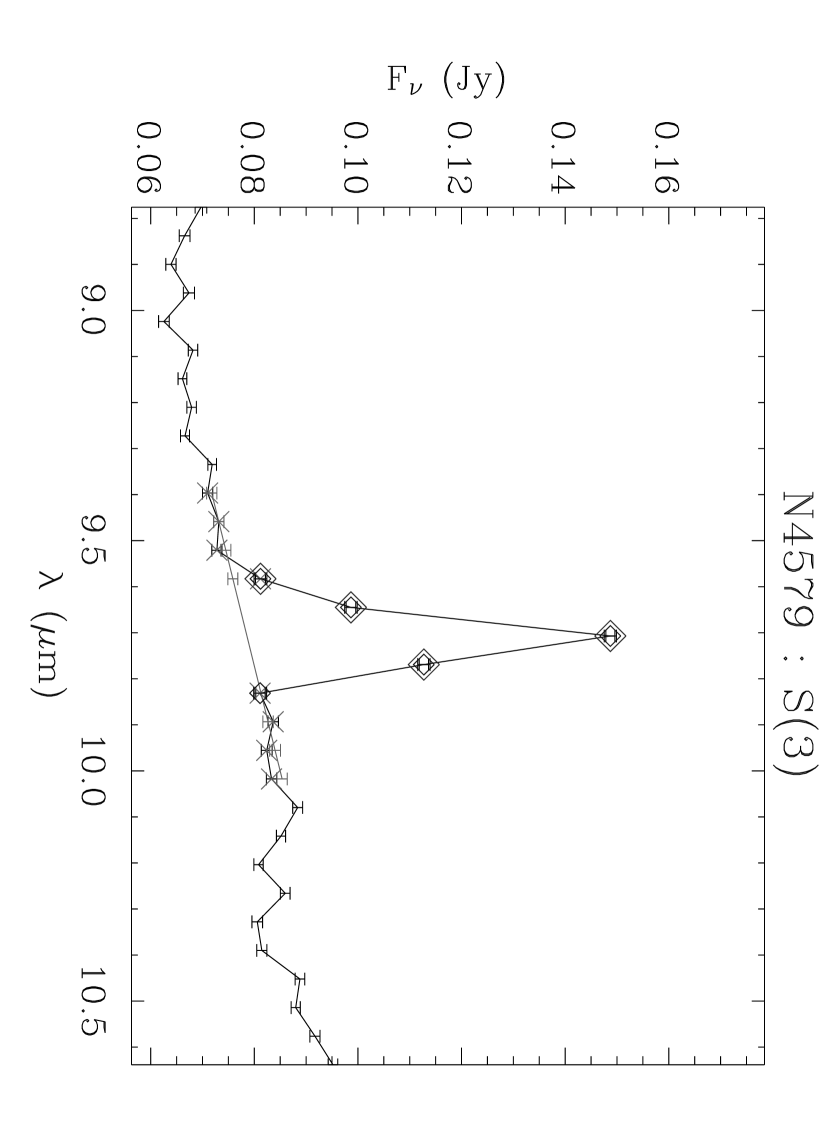
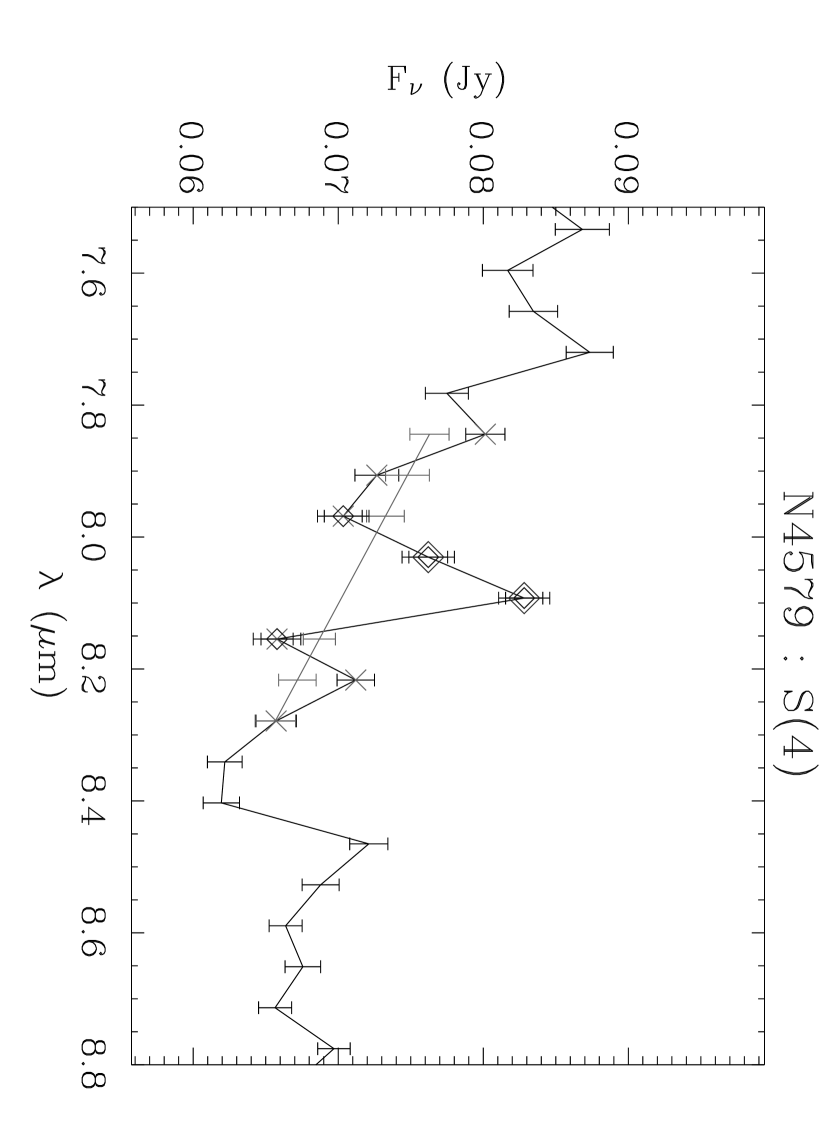
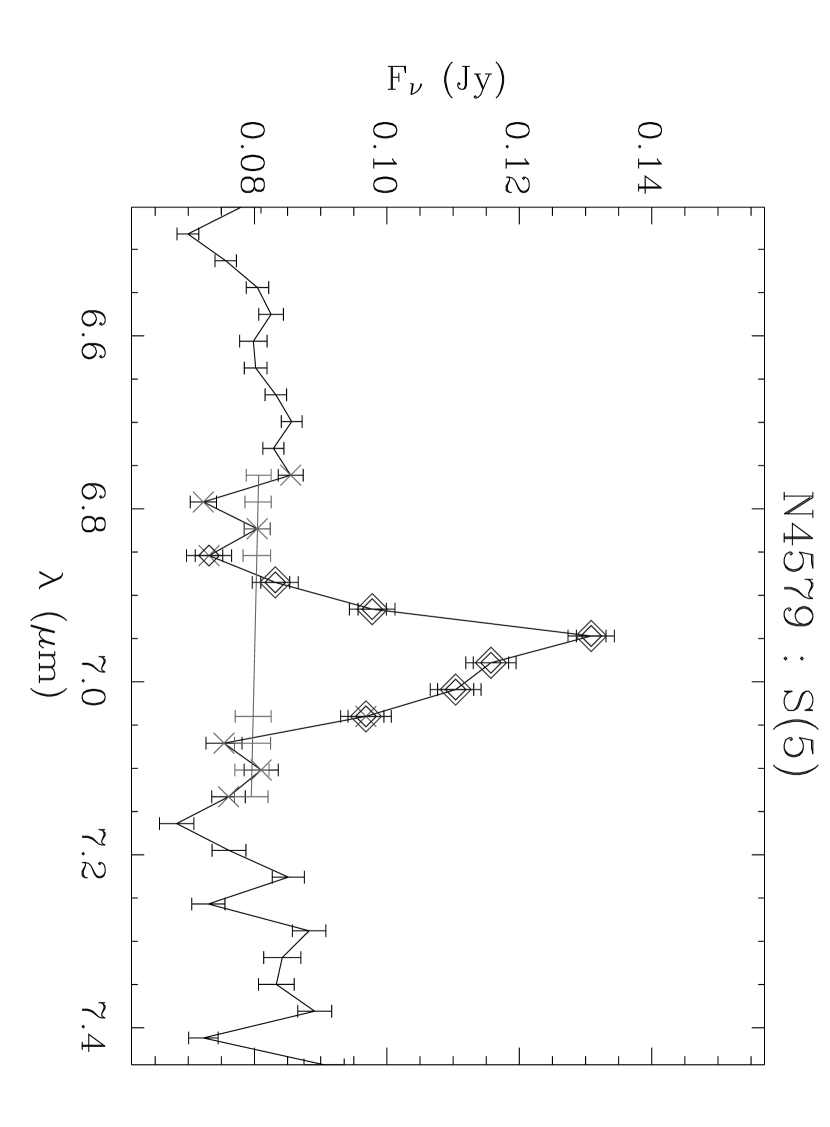
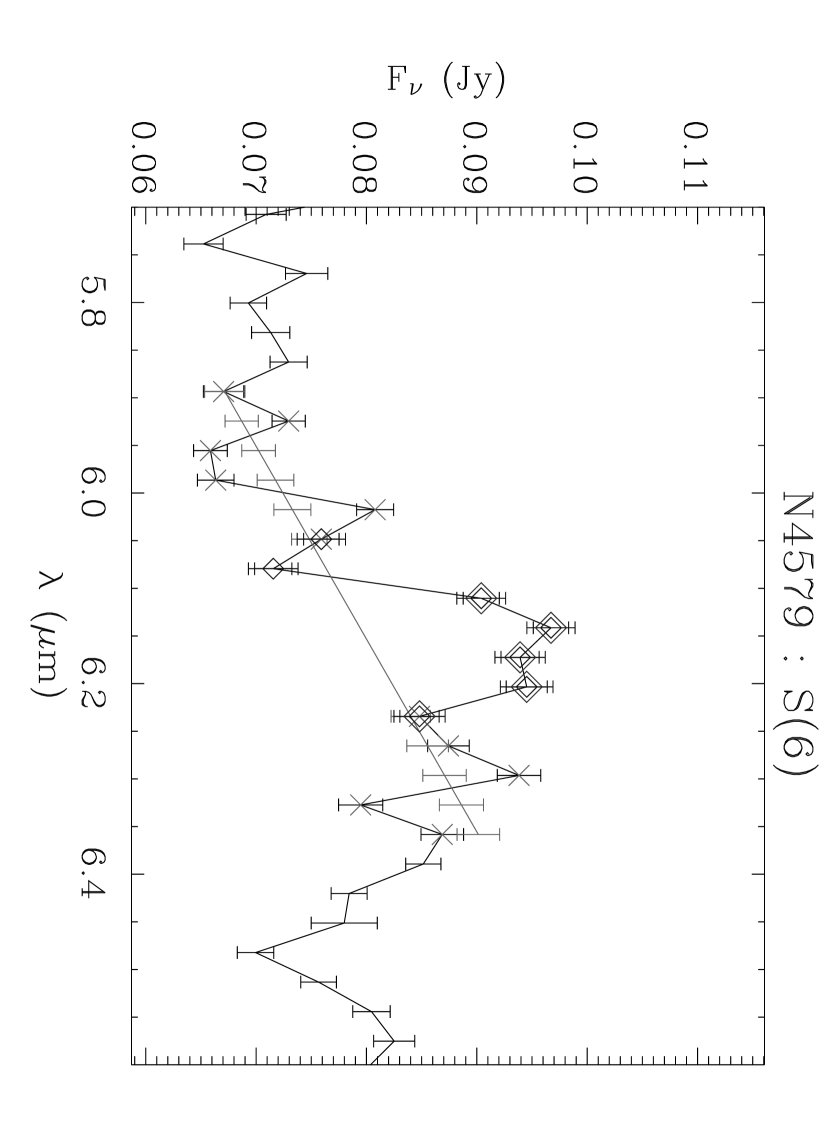
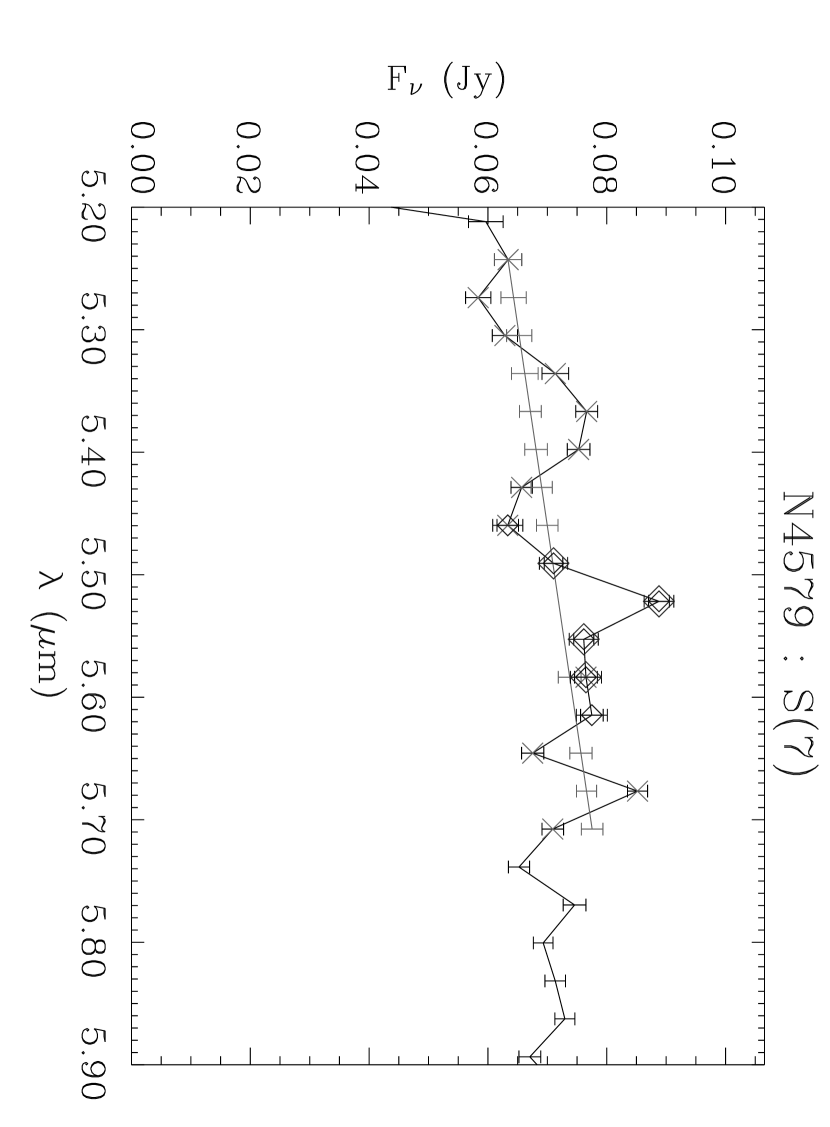
In high spectral resolution data, we defined errors from fluctuations of the pseudo-continuum, which was fitted as an affine function of wavelength (). In SL data, errors at each wavelength were estimated from spatial fluctuations of blank fields within the satellite spectral maps that are automatically obtained when the source lies in the other half of the slit (see Smith et al., 2004). Both the fluxes and the errors presented in Table 3 were then added linearly for each point of the line profile above the pseudo-continuum. The line profiles were constrained to have a width compatible with the spectral resolution, since the latter is sufficiently low that no line is resolved. Fig. 2 shows the line spectra for the representative galaxies NGC 1097, NGC 6946, NGC 7552, NGC 1266, NGC 4569 and NGC 4579.
The S(1) line is usually the brightest. Of the non-dwarf galaxies of the SINGS sample (with stellar masses estimated as by Lee et al. (2006) above M☉), the nuclear regions of 86% are securely detected in the S(1) line, with fluxes above three times the measured error. The other 14% are either ellipticals of the LINER type, or late-type spirals (Sc-Sd).
There are two galaxies in common between this sample and that of Rigopoulou et al. (2002), namely NGC 7552 and NGC 6946, the latter from the study of Valentijn et al. (1996). For both, our aperture is larger than the beam of ISO-SWS, which covered an area of 280 to 380 arcsec2. For the lines that were detected with SWS, we obtain fluxes that are higher by factors of 2.3 (S(1) in NGC 6946), 5.6 (S(0) in NGC 6946) and 1.1 (S(1) and S(3) in NGC 7552). The exact placement of the ISO-SWS beam is not known. For NGC 6946, given this uncertainty, it is conceivable that the H2 emission be twice as bright in our 800 arcsec2 aperture as in the SWS aperture; but the S(0) line flux of Valentijn et al. (1996) is inconsistent with our data.
For this study, we estimate total infrared fluxes (TIR) between 3 and 1100 m, defined as a linear combination of 24, 71 and 156 m flux densities. The formula of Dale & Helou (2002) is used here, and we have checked that replacing it with the more recent prescription by Draine & Li (2007) does not change the following results in any appreciable way. The infrared fluxes are measured within the same area as the other quantities for direct comparison. The PSF width at 156 m is however much larger than the size of our spectroscopic aperture, so that some extrapolation is needed. We first measure MIPS fluxes within the larger aperture used to compare total infrared fluxes with line fluxes measured in the LL module. Then, we scale these fluxes by the ratio of measured in the small aperture to measured in the larger aperture, which is equivalent to assuming that the spectral energy distribution does not change from an area of arcsec2 to an area of arcsec2. The associated errors are however expected to be small compared with the dynamic range of the quantities discussed in Section 5. Simulations of the overestimation of the far-infrared fluxes caused by the extrapolation, using a simple model of a point-source starburst (with the spectral energy distribution of Mrk 33) superposed on quasi-uniform emission from low radiation field intensity regions (with the colors of the central regions of NGC 24 or NGC 2403), indicate that the effect should be in most cases of the order of 20% (when the starburst and quiescent components contribute equally at 156 m), and in extreme cases reach a maximum of a factor 2 (when the quiescent component dominates). Smith et al. (2007b) reached a similar conclusion (see their Section 3.2).
3 Excitation diagrams
Excitation diagrams provide a convenient visualization of the distribution of level populations and allow first constraints on the excitation mechanisms (thermal or non-thermal) that can produce this distribution. They represent the column density in the upper level of each observed transition , normalized by its statistical weight , as a function of the upper level energy . The flux of a transition can be written as , where is the spontaneous emission probability, is the transition energy and is the beam solid angle. In the assumption of local thermodynamic equilibrium, the total column density can be derived from , where is the statistical weight (with the spin number for even J or para transitions, and for odd J or ortho transitions), and is the partition function (Herbst et al., 1996), valid for K.
The apparent excitation temperature can then be derived from each pair of transitions by:
| (1) |
with . Since both radiative decay and collisions with H2 change the rotational number by an even number, the ortho and para states are largely decoupled and should in principle be dealt with independently.
3.1 Ortho-para thermalization and departures therefrom
As emphasized by Burton et al. (1992), the lower rotational levels of H2 will be in collisional equilibrium over a wide range of conditions, because their critical densities are low. Figure 3 shows the critical densities of all the rotational transitions observable with the IRS instrument, as a function of temperature, computed using the functional form for the collisional de-excitation rate coefficient by H2 given by Shull & Beckwith (1982) and the transition probabilities given by Black & Dalgarno (1976). The derived critical densities for each line are about an order of magnitude lower than those for collisions with H computed by Mandy & Martin (1993), the comparison being made at 600 K, since Mandy & Martin (1993) provide results only for high temperatures.
The integrated emission from warm H2 in star-forming galaxies is likely to come predominantly from the densest photodissociation regions (PDRs) within the beam, with densities above cm-3 (Burton et al., 1992; Kaufman et al., 2006), in which case the lowest rotational levels will be thermalized. Observations of starburst galaxies with ISO-SWS (Rigopoulou et al., 2002) as well as ultraluminous galaxies with Spitzer-IRS (Higdon et al., 2006) are indeed consistent with this expectation. At first sight, the same applies to the galaxies studied here.
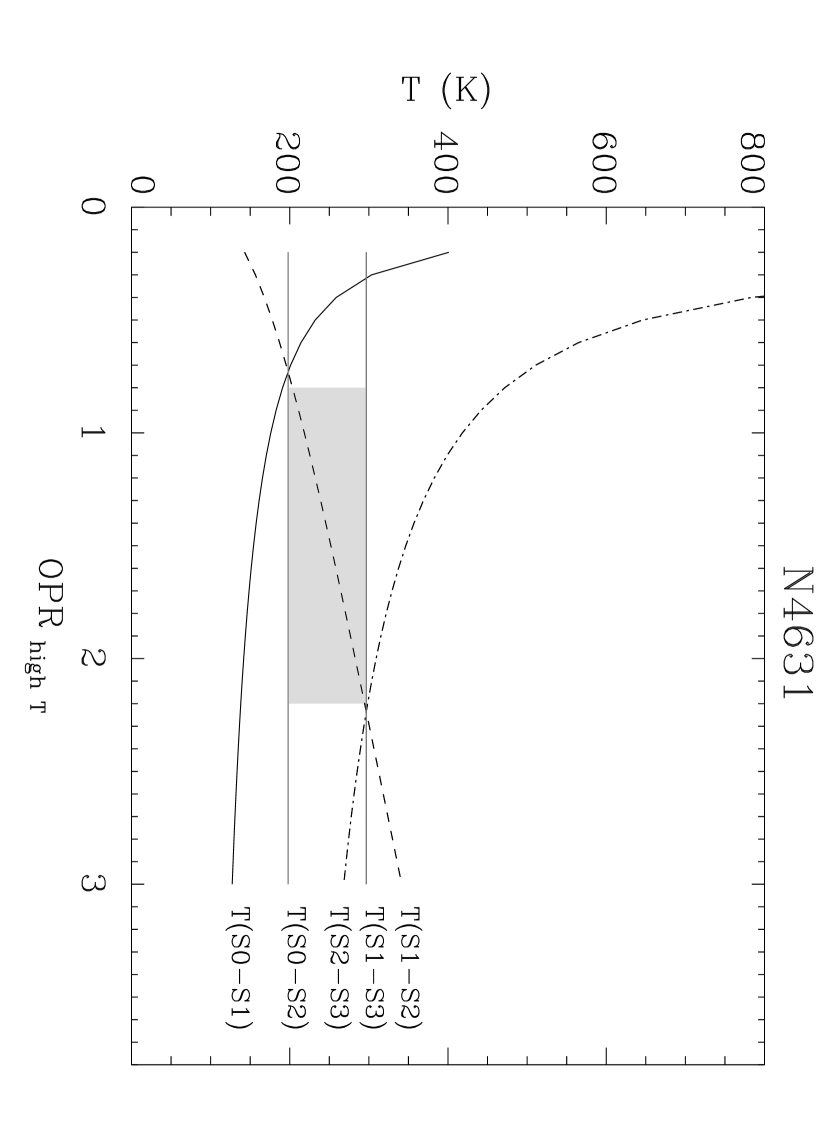
However, some of the excitation diagrams show departures from thermalization of ortho levels with para levels, in the sense that the apparent temperatures derived from each pair of transitions of consecutive rotational number are not monotonic as a function of upper level energy. Clear examples are NGC 1266 ( K, K and K); NGC 4254 ( K, K and K); and NGC 4631 ( K, K and K). Such deviations from thermalization can be explained by an ortho to para density ratio in the excited states apparently different from the equilibrium value. We have
| (2) | |||||
where the subscripts and designate ortho and para levels respectively ( and ). , equal to the actual ortho to para ratio () in the high-temperature limit, expresses deviations from local thermodynamic equilibrium (LTE) if it differs from three. It may be called the effective nuclear spin degeneracy ratio, but will hereafter be called the ortho to para ratio for convenience. In LTE, for K and for K (Burton et al., 1992), but at all temperatures. Although may be inferred for the excited states (), this does not imply that the ortho to para ratio of the bulk of the gas in the and states be out of LTE. In the following, LTE will refer more particularly to the equilibrium between the ortho and para levels, and not of the ortho levels or para levels separately. Extinction effects are discussed in Section 3.3 and the interpretation of values is postponed to Section 6.
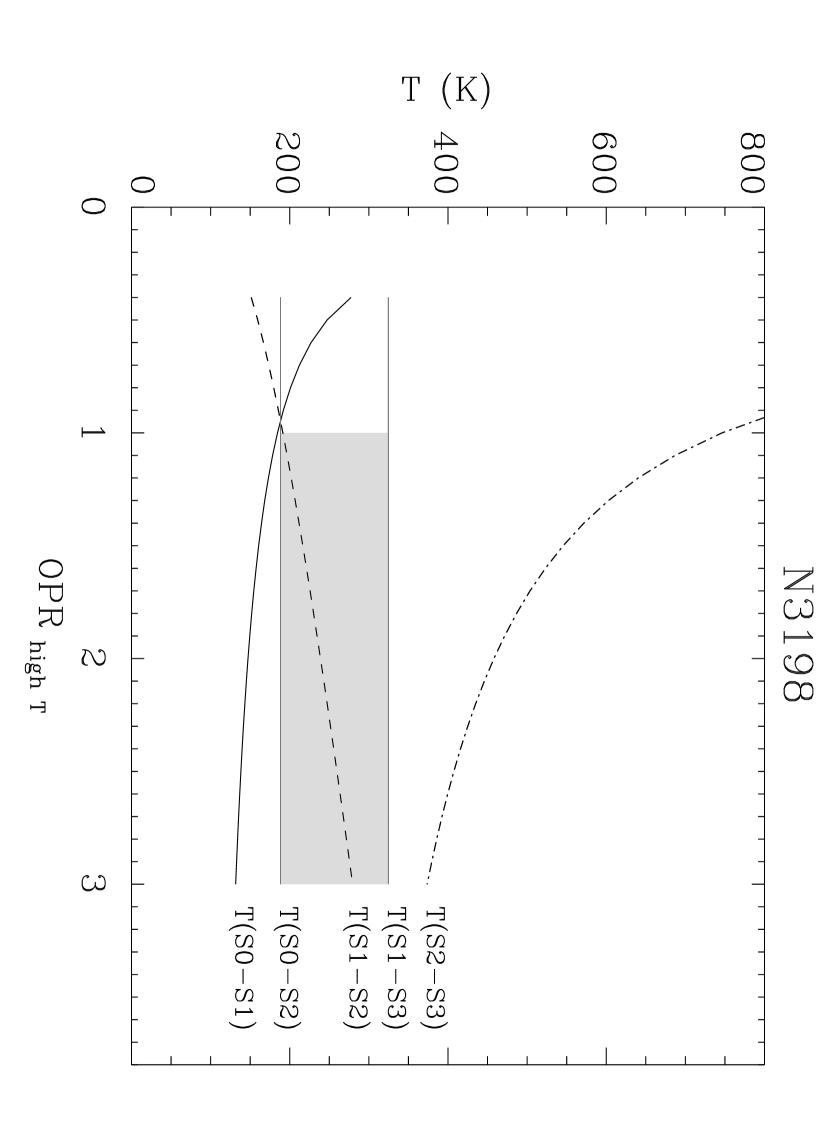
To derive temperatures and column densities, we first determine whether the excitation diagram is compatible or not with LTE by inserting explicitly the factor in the equations for column densities of the ortho levels, and deriving temperatures from each pair of consecutive transitions as a function of , to verify whether these conditions are satisfied: , since in gas with a distribution of temperatures, ratios of transitions with low-energy upper levels always probe lower excitation temperatures than ratios of transitions with higher-energy upper levels. and are independent of and determined directly from the observed fluxes, but , and depend on . For each pair = (0,1), (2,1) and (2,3), we have:
| (3) |
with . Figure 4 shows the corresponding diagram for two galaxies. In case the above condition on the temperatures is satisfied for , as illustrated for NGC 3198, we fix ; in the opposite case, illustrated by NGC 4631, we fit as explained below. The excitation diagrams of all the galaxies, with fits overlaid, are shown in Fig. 5.
3.2 Temperatures and column densities
Since in all cases the excitation diagrams indicate that a single temperature does not fit all the line fluxes, we assume that the H2 emission is the sum of two discrete components of different temperatures, which is enough to reproduce accurately the observed fluxes. In the general case of , we perform a least-squares fit of the excitation diagram to determine the parameters of the two discrete components (the lower temperature , the upper temperature , and their mass fraction) and the normalization by the total column density. The results are listed in Table 4.
When the gas is at a range of temperatures, it is in practice impossible to lift the degeneracy between mass and temperature from the lowest-energy levels. Since the column density has a very steep dependence on , we adopt two different procedures to fit the excitation diagrams and ascertain the amplitude of the uncertainties caused by this degeneracy. In the first case, we constrain to exceed the value for which the column density is 20% higher than the nominal density derived from . In the second case, we leave unconstrained. In the following, both approaches will be retained when discussing results that depend on .
For the results not to be biased by systematic sensitivity differences at the wavelengths of the H2 transitions, we also replace the measured errors by a uniform weight. When is allowed to be fitted, we fix at in the constrained- fits, which was chosen from the median value of in galaxies with . In free- fits with , the distribution of is large, with a tail of high values; therefore, is first fixed at the median value, , and then at , to probe the full range of most likely values. Finally, when one flux is an upper limit, we fix both at (which increases the total column density by a maximum of % with respect to that obtained with but allows a small contribution from hotter gas to the S(0) and S(1) lines), and as above.
For the three galaxies from which more transitions, up to S(7), could be measured, the procedure is the same except that a third component has to be added. The additional parameters are and the mass fraction of the second component, and is fixed at 400 K.
Several galaxies barely satisfy the criterion on temperatures to have , with and . When is constrained, the quality of their fits can be improved by allowing to vary. For these objects, we provide results with . Allowing to be smaller than the equilibrium value has the indirect consequence that the derived column densities are smaller. The amplitude of this effect is indicated in Table 4. Similarly, for NGC 1705 and NGC 4552, we provide results with and indicate the change in column density with respect to , because although the S(2) transition being an upper limit prevents any reliable determination of , the temperatures derived with are the two lowest of the whole sample, raising the suspicion that they might be artifacts of the constraint on . We also consider more likely for these galaxies in view of the dependence of on H2 brightness, discussed later in Section 6.
The median temperature is 154 K when the fits are constrained (ranging between 97 and 300 K); when no constraint is applied, the median is 118 K with , and 161 K with . The total column densities that we obtained, averaged over kiloparsec-scale regions in galactic centers, range between and cm-2 (for constrained- fits), or cm-2 (for free- fits), and their medians are respectively cm-2 and 5– cm-2 (Fig. 6). This can be compared with typical column densities of resolved photodissociation regions in the Milky Way. In the Orion Bar, column densities of H2 warmer than 400 K, derived from rotational lines, lie between and cm-2 (Parmar et al., 1991; Allers et al., 2005). Note that because the Orion Bar is observed nearly edge-on, an equivalent PDR seen face-on would have lower column densities. In NGC 7023, Fuente et al. (1999) derived a total column density of cm-2 for H2 warmer than 300 K. Thus, if the H2 emission in our targets comes from similar photodissociation regions, they must occupy in general a very large fraction of the observing beam, assuming that they do not overlap on the line of sight.
Figure 6 also shows a clear dependence of the local (nuclear) column density of warm H2 on the total stellar mass of the host galaxy. The stellar mass and the infrared luminosity being correlated for star-forming galaxies, there is a similar dependence on far-infrared luminosities. To first order, the column density of warm H2 shows the same behavior as tracers of molecular gas and star formation rate densities, which suggests that the primary source of H2 heating is the star formation activity in non-AGN galaxies, and the nuclear regions respond to the global mass and luminosity. LINER and Sy nuclei do not follow the correlation shown by star-forming regions, and tend to have smaller column densities of warm H2. The differences in terms of energy output and excitation mechanisms will be studied in more detail in Sections 5, 6 and 7. Since the few extranuclear regions and dwarf galaxies included in the sample do not distinguish themselves from the other star-forming targets in any obvious way, here and in the following, they are not discussed as separate categories.
3.3 Optical depth toward H2
Consistent with the negligible optical depths inferred from the silicate absorption bands at 10 m and 18 m in most SINGS galaxies (Smith et al., 2007b), that support the modest values of nebular extinction derived from the Balmer decrement (Dale et al., 2006), we assume zero extinction both in the lines and in the dust continuum for all the targets. In eight galactic centers among the SINGS sample (included here), Smith et al. (2007b) obtained a better fit in their decomposition of the low spectral resolution spectra by including a finite optical depth in the silicate bands. We expect the warm H2 component to suffer less extinction, on average, than the warm dust continuum, because the two emission sources will not be cospatial in general, and the regions of high optical depth will be confined to compact regions, probably more concentrated than the regions participating in H2 emission (see the striking example of NGC 1377; Roussel et al., 2006). In particular, Higdon et al. (2006) did not see any evidence for significant extinction in the rotational H2 lines of ultraluminous galaxies, although these objects are expected to have much higher optical depths than the present sample. In the absence of any quantitative constraint on the differential extinction between the dust and H2, we do not attempt to correct H2 fluxes for extinction.
Using the extinction law of Moneti et al. (2001), valid for the Galactic center, we have , and . Even assuming the same optical depth toward the warm molecular hydrogen as toward the hot dust, the extinction correction would not change significantly the derived column densities. The extinction is modest at 10 m, and therefore negligible at 28 m, the wavelength of the S(0) line which dominates the total column density determination. Extinction effects would however depress the S(1) and S(3) line fluxes with respect to S(0) and S(2), and could thus artificially lower the derived . In the following, we put lower limits to values, when less than 3, derived for the eight galaxies with non-zero optical depth at 10 m.
NGC 3198 is the sample galaxy with the highest optical depth in the silicate feature according to Smith et al. (2007b), but its excitation diagram shows no sign of attenuation of the S(1) and S(3) lines relative to the others, and is consistent with (Fig. 4). The second most obscured galaxy of the present sample is NGC 1266 (it also has the highest nebular extinction according to Dale et al. (2006), mag), for which we derive . If this were due to optical depth effects, then the S(3) line at 9.7 m should be more attenuated than the S(1) line at 17.0 m. Since this would be consistent with the excitation diagram, we cannot exclude that the apparently low value be an extinction artifact in at least this galaxy. The dissimilar behavior of the two galaxies in terms of differential extinction between H2 and the dust could then arise from different excitation mechanisms and geometries: whereas in the nuclear regions of NGC 3198, classified as purely HII, the H2 emission is presumably distributed over a large volume, the H2 emission in the LINER nucleus of NGC 1266 may be much more compact, and not produced by star formation processes (see Section 5). For 13 galaxies with negligible silicate extinction in the spectral decomposition performed by Smith et al. (2007b), the excitation diagrams do imply , whether a constraint on the lower temperature is applied or not. In addition, of the 6 galaxies found to have non-zero silicate extinction and , three would require in order to obtain after extinction correction (by % for NGC 1266, by a factor for NGC 4631 and by a factor for NGC 5866). The three others (NGC 1482, 4536 and 6946) would require either , or very low temperatures ( K). Since it is unlikely that the optical depth toward H2 be higher than toward the dust continuum, we conclude that our finding, discussed in Section 6, is robust against extinction effects.
4 Mass fraction in the warm phase
In order to estimate the fraction of molecular hydrogen that is heated to temperatures above K, we searched the literature for observed intensities of the 2.6 mm CO(1-0) line within a beam comparable to the solid angle of our observations. Table 5 summarizes the adopted data. The column density of cold H2 as given here is derived from CO velocity-integrated intensities on the main-beam temperature scale, assuming a uniform conversion factor of CO(1-0) intensities to H2 column densities of cm-2/(K km s-1) (Strong et al., 1988). We derived aperture corrections to the CO intensities by projecting on a map both the IRS beam and the CO beam. We did not use any deconvolution technique. Whenever possible, a map from the BIMA SONG interferometric survey, including the zero-spacing total intensity (Helfer et al., 2003), was used. Otherwise, we used instead the 7.9 m map and assumed the spatial distributions of aromatic bands in emission and CO(1-0) line emission to be similar at the large spatial scales corresponding to our apertures. This can be justified qualitatively by the association of dust with molecular gas and the Schmidt law (for a recent study of the spatially-resolved Schmidt law, see Kennicutt et al. 2007, in preparation). The applied correction factors are listed in Table 5. In some cases, there are several available measurements all giving consistent estimates to within 30% ; the corresponding unused references are given within parentheses.
There are two major sources of uncertainty in this comparison. The first one is inherent to the difficulty of matching the physical area covered by the IRS integral-field measurements, from single-dish or aperture-synthesis measurements within a different beam. The second dominant source of uncertainty comes from the conversion factor of CO intensities to H2 masses, assumed uniform here. The result of Strong et al. (1988) is derived from a comparison of Galactic -ray emission with CO and HI emission. Dame et al. (2001) obtained a consistent conversion factor by extrapolating the gas-to-dust mass ratio measured from HI and far-infrared emission, in areas devoid of CO emission, to molecular clouds. Both methods provide an estimate of the total H2 column density, including the warm gas as well as the cold gas, for molecular clouds under similar average physical conditions as Galactic clouds. Note however that conversion factors both significantly lower and significantly higher have been derived for normal galaxies. For instance, the recent study of Draine et al. (2007) favors an average value of cm-2/(K km s-1), based on global gas-to-dust mass ratios in the SINGS sample. In addition, the ratio of H2 column density to CO intensity can vary by at least a factor two, depending on the physical conditions of the regions emitting in CO (Maloney & Black, 1988), even though our observing aperture is large enough to cover a large number of molecular clouds and dilute some of the dispersion in their physical properties. In particular, the conversion factor is expected to be lower for compact and actively star-forming regions than for more diffuse and more quiescent regions. We discount here variations due to metal abundance, since we could find CO measurements for only two low-metallicity targets (NGC 2915 and NGC 6822_A).
Figure 7 shows the mass fraction of molecular hydrogen in the warm phase ( K) as a function of the minimum temperature of the warm component, as determined by the lowest-energy rotational H2 lines. The nuclei classified as star-forming have a relatively narrow range of lower temperatures ( K for 31 nuclei, with or without CO data, from the constrained fits). However, for nuclear regions classified as LINERs or Seyferts, the spread in temperatures is higher ( K for 25 nuclei). No statistically-significant difference exists between the 18 LINER and 7 Sy nuclei.
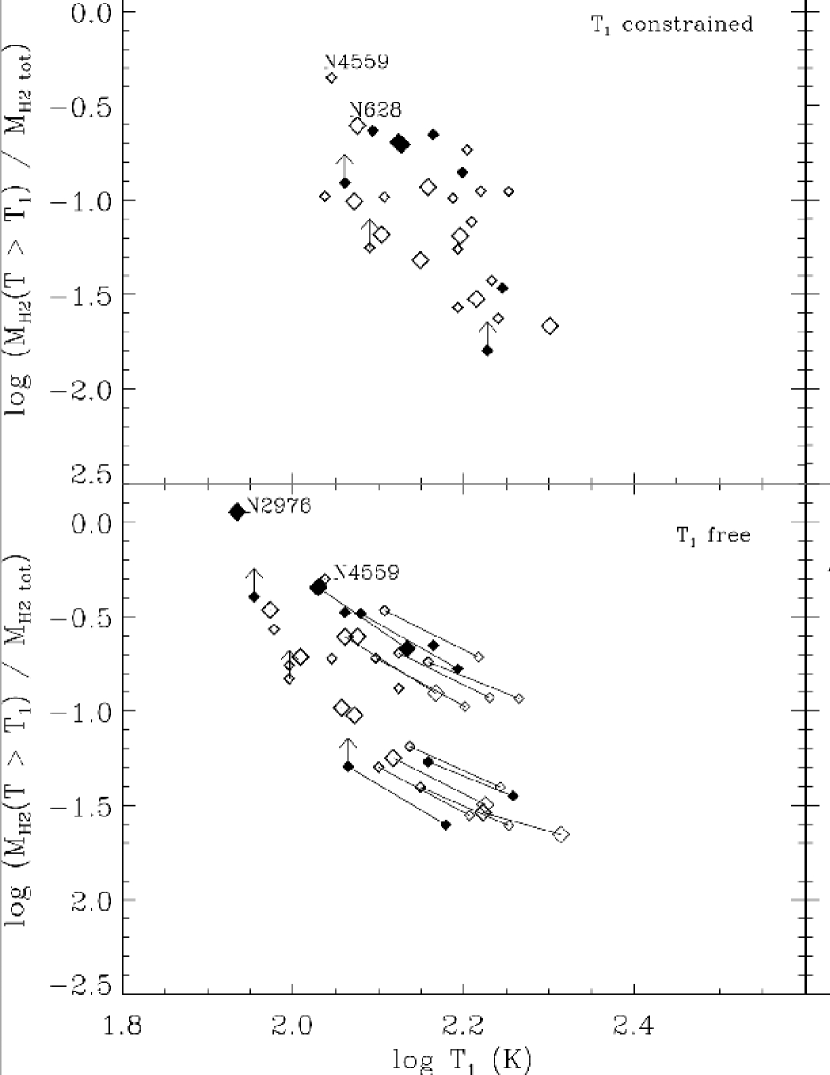
A clear anticorrelation exists between the two quantities plotted (partly the result of the degeneracy between temperatures and column densities), which remains intact when restricting the sample to those galaxies for which we could find well-matched CO data (i.e. with correction factors close to unity and with several consistent measurements). The dynamic range in the warm gas mass fraction is much higher than accounted for by the uncertainty on the total H2 mass. The uncertainty on the warm H2 mass for individual objects is however extremely large, owing to the degeneracy between , often ill-constrained by the data, and the column density. The example of NGC 4579 is the most striking (see Table 4). Since its rotational levels up to J=5 are close to thermal equilibrium (at a single temperature of the order of 300-400 K), such a component at 70 K as found in the free- fit is unlikely to be real. Because the fits where is unconstrained allow mass fractions in the warm phase that are sometimes unphysical (for example for NGC 2976 and NGC 4826), we favor the constrained fits as more plausible, but emphasize that the mass distribution at low temperatures is in general unconstrained.
In the case of constrained- fits, it appears that for a small set of nuclear regions classified as LINERs or Seyferts, the warm H2 phase consists only of a very small fraction of the total mass, but heated to higher temperatures than in regions classified as purely star-forming. This behavior arises naturally if normal photodissociation region excitation is missing, and if the hotter gas is located in a thin layer of molecular clouds, or has a small filling factor. In the case of free- fits, only NGC 1316 (Fornax A) remains robustly in the part of the diagram with high and mass fraction below 3%. The average temperature is however still higher for LINERs and Seyferts than for HII nuclei, and the average mass fraction in the warm phase likewise lower. The reason for this difference will be further discussed in Section 7, addressing the excitation mechanisms.
5 Comparison of the powers emitted by warm H2, [SiII] and dust in star-forming regions
In order to empirically quantify the importance of the H2 rotational lines in cooling the interstellar medium of normal galaxies, and to put constraints on the possible excitation mechanisms of H2, discussed in more detail in Section 6, we examine power ratios of H2 to other tracers of the warm interstellar medium extracted from the same observations. The results presented here are independent of any fits to the excitation diagrams. Only the HII nuclei and complexes are considered, LINER and Sy nuclei being separately discussed in Section 7. Since the bulk of warm H2, at the lowest rotational temperatures, emits mostly in the S(0) to S(2) lines, whereas the S(3) line emission has a noticeably higher contribution from hotter H2, probably indicating more mixed excitation sources (anticipating the discussion of excitation mechanisms, see Section 6.1), we choose, as the most useful quantification of H2 rotational emission in star-forming targets, the sum of the S(0) to S(2) lines.
5.1 Total infrared emission
In photodissociation regions, almost all the far-ultraviolet power from massive stars that does not escape is absorbed by dust and converted to infrared continuum radiation, or is absorbed by H2. Only a very small fraction of the power absorbed by dust, of the order of 1%, is converted to photoelectrons that heat the gas, and emerges as infrared lines (Tielens & Hollenbach, 1985). The dominant gas coolants are the [OI] and [CII] lines at 63 m and 158 m, but mid-infrared lines, in particular [SiII] at 34.8 m and the H2 rotational lines, are also energetically significant. Although the transition rate coefficients of H2 are low and the excitation energies relatively high, H2 molecules are dominant in number.
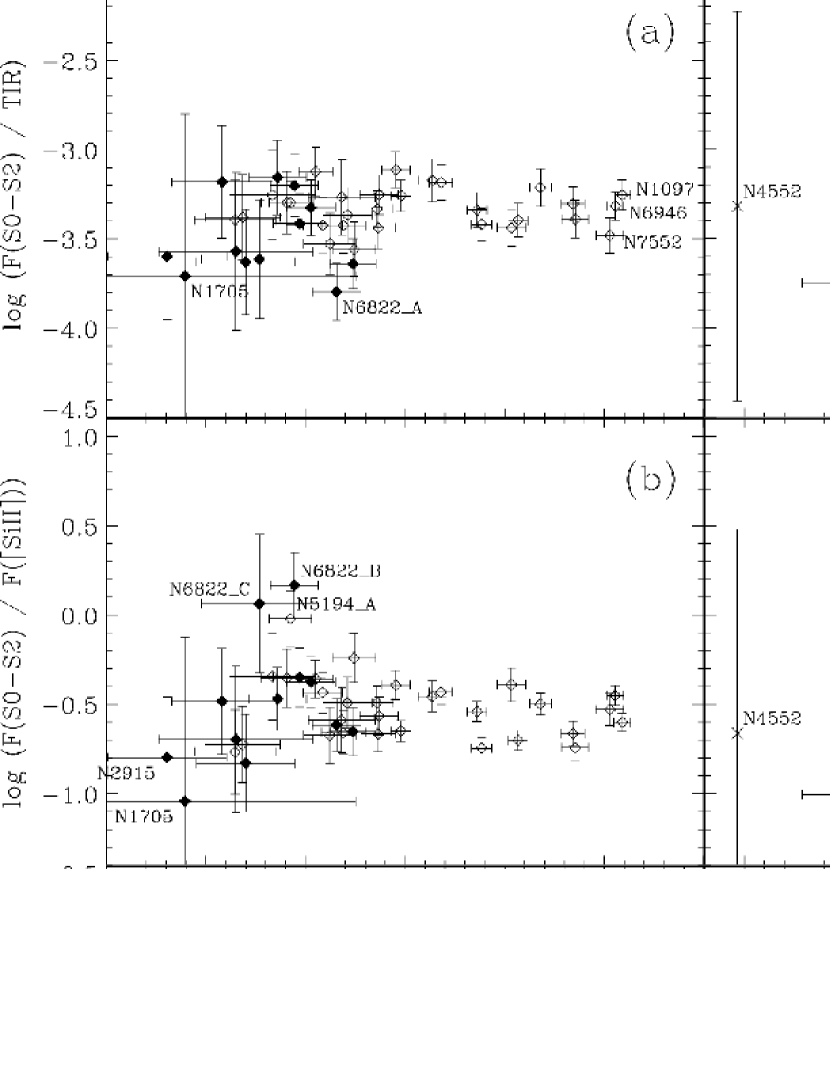
The observed ratios of the power emitted in the sum of the S(0) to S(2) lines to the total dust power emitted in the infrared (TIR; see Section 2.4) range between and for nuclear regions that are not classified as LINERs or Seyferts (Fig. 8a). These ratios are in agreement with predictions of the photodissociation models of Kaufman et al. (2006) for a wide variety of radiation field intensities and hydrogen densities , but a relatively narrow range of ratios, approximately between 0.1 and 1 with in units of erg s-1 cm-2 and in units of cm-3. Note that models predict the ratio of the H2 line power to the far-ultraviolet (FUV) power (for photon energies between 6 and 13.6 eV), rather than the total infrared power. Since the intrinsic FUV flux heating the photodissociation regions is unknown, the comparison between observations and models is here made by assuming an exact conversion of FUV photons to infrared photons. The fraction of dust heating provided by non-FUV photons can however be significant. Allowing for this effect would reduce the derived ratios. The H2 rotational line fluxes predicted by Kaufman et al. (2006) are nearly an order of magnitude higher than those from the older models of Burton et al. (1992), because of the inclusion of photoelectric heating by PAHs, a better H2 model, and a finer numerical grid near the region of H2 emission.
The inferred ratios are lower than the results of Malhotra et al. (2001), who derived the physical conditions of an ensemble of bright star-forming galaxies from the [CII] and [OI] lines. They found ratios between about 0.5 and 6, i.e. on average 5 times higher than those indicated here by the rotational H2 lines. A possible explanation is that H2 emission comes from cooler and denser regions than [CII] and [OI], because H2 exists at higher optical depths inside the clouds than C+ and O (Hollenbach & Tielens, 1997). The difference in physical conditions could thus merely reflect a different spatial origin. Besides the different locations within PDRs, the two studies also deal with different regions within galaxies: the targets of Malhotra et al. (2001) were selected to have most of their line emission encompassed by the ISO-LWS beam of 70″, whereas our apertures usually cover small fractions of the line and dust emitting areas. Alternatively, the observations of Malhotra et al. (2001) could reflect intrinsically different physical conditions because their sample contains galaxies on average brighter and more active than the sample used here. Their far-infrared luminosities (in the definition of Helou et al., 1988) range from to L☉, with a median of L☉, whereas the far-infrared luminosities of the present sample range from to L☉, with a median of L☉. The median ratio is also higher in the sample of Malhotra et al. (2001) (0.57) than in our sample (0.41), indicating higher radiation field intensities on average. The ratios derived by Malhotra et al. (2001) however do not display any clear correlation with either infrared luminosity or color. Only NGC 1482 and NGC 5713, included in both samples, allow a direct comparison of model results (we discard the LINER NGC 1266 because most of its H2 emission is not produced by PDRs, as shown in Sect. 7). For both sources, the H2 line fluxes indicate consistently and –. For NGC 1482, is in agreement with one of the two models of Malhotra et al. (2001), but is at least four times higher. For NGC 5713, is two times higher that that of Malhotra et al. (2001), and is at least six times higher. In conclusion, we favor differences in spatial origin (both within PDRs and within galaxies) as a likely cause for the different model results.
5.2 [SiII] line emission
Figure 8b shows the ratio of powers emitted in the H2 rotational lines and in the [SiII] line. The dispersion in the ratio is very similar to that seen in Fig. 8a, and the [SiII] line alone emits more power than the sum of the S(0) to S(3) transitions in HII nuclei. The [SiII] line has indeed been found to be the brightest mid-infrared cooling line and to scale tightly with the total infrared power both in nuclear and extranuclear regions within the SINGS sample galaxies (Helou et al., in preparation), with only a very slight dependence on the radiation field intensity. We have on average (ranging between 0.15 and 0.5 for nuclei), and . Using the [SiII] line as a substitute for the total dust emission is advantageous because it is observed at about the same angular resolution as the H2 lines, whereas estimating the total infrared power within these apertures requires a large extrapolation (because of the large width of the point spread function at 70 and 160 m), making the uncertainty on H2/TIR relatively high. The [SiII] power predicted by the photodissociation region model of Kaufman et al. (2006), with the same physical conditions as above, is however smaller than observed by a factor greater than 3, which implies either that the majority of [SiII] emission comes from HII regions in high-metallicity nuclear regions, or that the fraction of silicon incorporated in dust grains is smaller than 90%.
Only the regions B and C in NGC 6822 have significantly less [SiII] emission, with respect to H2 emission, than the nuclear regions of spiral galaxies. Their H2 emission is also slightly overluminous with respect to the aromatic bands (Fig. 8c). This may not be entirely attributable to a metallicity effect, decreasing the abundances of PAHs and silicon, since region A (Hubble V) has normal flux ratios, and oxygen abundances are quite uniform in NGC 6822 (Pagel et al., 1980). An alternative explanation is that additional excitation of H2 may be provided in regions B and C, with respect to region A, by shocks in supernova remnants (see the more general discussion in Sect. 7.2). To our knowledge, no independant evidence exists to test the existence of shocks in these regions. Chandar et al. (2000) obtained a normal HII optical line spectrum at the center of NGC 6822_C, but since their beam of 2.5 arcsec2 is only about 1% of ours, we cannot rule out shock excitation. Finally, given the small distance of NGC 6822, the regions covered by the IRS aperture are less than 100 pc in size. Greater fluctuations around the average properties are thus not unexpected. At present, we are unable to decide which scenario is the most likely.
5.3 Aromatic bands
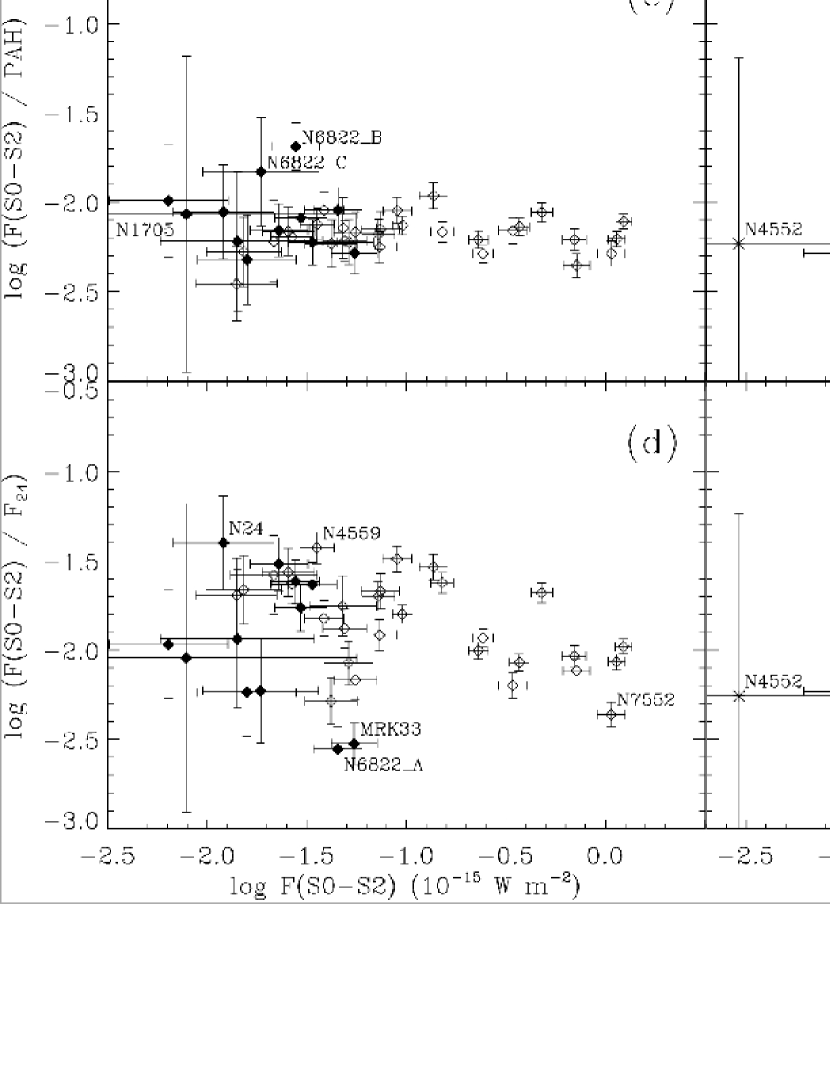
Figure 8c shows a remarkable constancy of the power ratio of the H2 rotational lines to the aromatic bands. Among the measured dust and gas observables, PAH emission provides the tightest correlation with H2. Observations of photodissociation regions have shown that the emission from aromatic band carriers and from fluorescently-excited H2 just outside photoionized regions are nearly cospatial, with H2 sometimes seen to extend slightly deeper into molecular clouds (Sellgren et al., 1990; Graham et al., 1993; Tielens et al., 1993; Brooks et al., 2000; Habart et al., 2003). Cospatiality might be expected since both species can be excited by FUV photons. Aromatic band carriers can also be excited by lower-energy photons in the ultraviolet and optical, but with smaller absorption cross-sections (see Li & Draine, 2001), so that FUV photons will dominate the excitation whenever massive stars are present. H2 is however dissociated by FUV photons between 11.3 and 13.6 eV where it is not self-shielded, whereas PAHs survive the absorption of these photons. Therefore, in the case of relatively dense PDRs (associated with molecular clouds), where collisional heating is expected to be the major origin of the H2 rotational lines, H2 emission should peak at slightly higher optical depth than aromatic bands, in the transition layer between atomic and molecular hydrogen, with . In addition, PAHs probably cannot be excited as deep into molecular clouds as H2, because at sufficiently high densities they will be coagulated onto grain mantles on short timescales (Boulanger et al., 1990). If photodissociation regions dominate the excitation of H2, as consistent with the above results, a tight relation between aromatic band emission and rotational H2 emission can arise only if the physical conditions in PDRs, especially the ratio, are relatively uniform, because H2 fluxes and PAH fluxes depend in very different ways on these two parameters. The condition of relatively constant ratios seems verified in the present sample at least for the average emission within kiloparsec-scale regions (see above). Based on the modelling of [CII] and [OI] emission, Malhotra et al. (2001) proposed that a regulation of might be achieved at the scale of individual PDRs by expanding HII regions in pressure equilibrium with their surrounding PDRs.
A correlation was previously claimed by Mouri et al. (1990) between the 3.3 m band and the v=1-0 S(1) line at 2.12 m for a small sample of starburst and Seyfert galaxies. The dominant source that they propose for H2 excitation, following Moorwood & Oliva (1988), is however not photodissociation regions, but shocks in supernova remnants. Using the shock models of Kaufman & Neufeld (1996) to estimate the sum of the S(0) to S(2) transitions (up to 6% of the mechanical power, assuming that its totality is dissipated in molecular clouds), and the population synthesis model of Leitherer et al. (1999) to estimate both the total mechanical power and the FUV luminosity from continuous star formation with a Salpeter initial mass function, shocks alone are in principle able to produce a significant fraction of the observed H2 emission, but only if the efficiency of conversion of mechanical power into H2 emission is unrealistically high. The rotational line ratios are also inconsistent with shock models, which predict higher temperatures ( K) except for very low shock velocities (in which case the power fraction radiated away by rotational H2 lines is lower). If the collective rotational line emission from shocks in supernova remnants is similar to that observed in individual objects such as 3C 391 and IC 443 (Reach et al., 2002), then this mechanism can provide only a modest fraction of the total H2 emission. In addition, if H2 emission came predominantly from supernova remnants whereas aromatic bands arise mostly in photodissociation regions, the partial deconnection between the two, both temporal and spatial, would manifest itself by a large scatter in the observed relation between H2 and PAH fluxes for galaxies with diverse star formation histories, which is not observed.
More recently, Rigopoulou et al. (2002) proposed a relation similar to that presented by Mouri et al. (1990), between the 7.7 m aromatic band and the rotational S(1) line in starburst galaxies. Figure 8c not only confirms this result for lower-luminosity galaxies, but also shows that the dispersion for the whole sample of star-forming nuclei is very small, and much smaller with the aromatic bands than with the 24 m emission (Fig. 8d), which is dominated by the continuum from transiently-heated very small grains, as well as from big grains in intense radiation fields. The quantification of the average H2 to dust power ratios and their dispersions is given in the caption of Fig. 8. The energy coupling between aromatic band carriers and H2 strongly suggests that both are excited predominantly in photodissociation regions, although they may not come from the exact same layers (at the same optical depths within the clouds). We present further analysis in the next section.
A similar correlation, with a similarly small dispersion, was observed between the [CII] line and aromatic band emission (Helou et al., 2001). This relation suggests that aromatic band carriers are the source of a major part of gas heating in photodissociation regions, via the photoelectric effect, at least at modest radiation field intensities, since [CII] emission is the dominant cooling channel in this case. In the narrow range of physical conditions that seem to apply if the emission from HII nuclei is interpreted in the framework of photodissociation region models (a dynamic range in of only a factor 10), then the same link between aromatic band carriers and H2 would follow if H2 were heated in relatively dense photodissociation regions by the PAHs. Our results, however, suggest that in nearly half the star-forming targets, the dominant excitation mechanism of the rotational levels may be fluorescence in low-density regions, so that ortho-para thermalization is not achieved by collisions (see Sect. 6). If the lines are fluorescently excited, the cause underlying the tight relation between H2 and aromatic band emission may be that both are proportional to the incident far-ultraviolet flux which excited them.
5.4 Cirrus clouds versus PDRs with high radiation field intensities
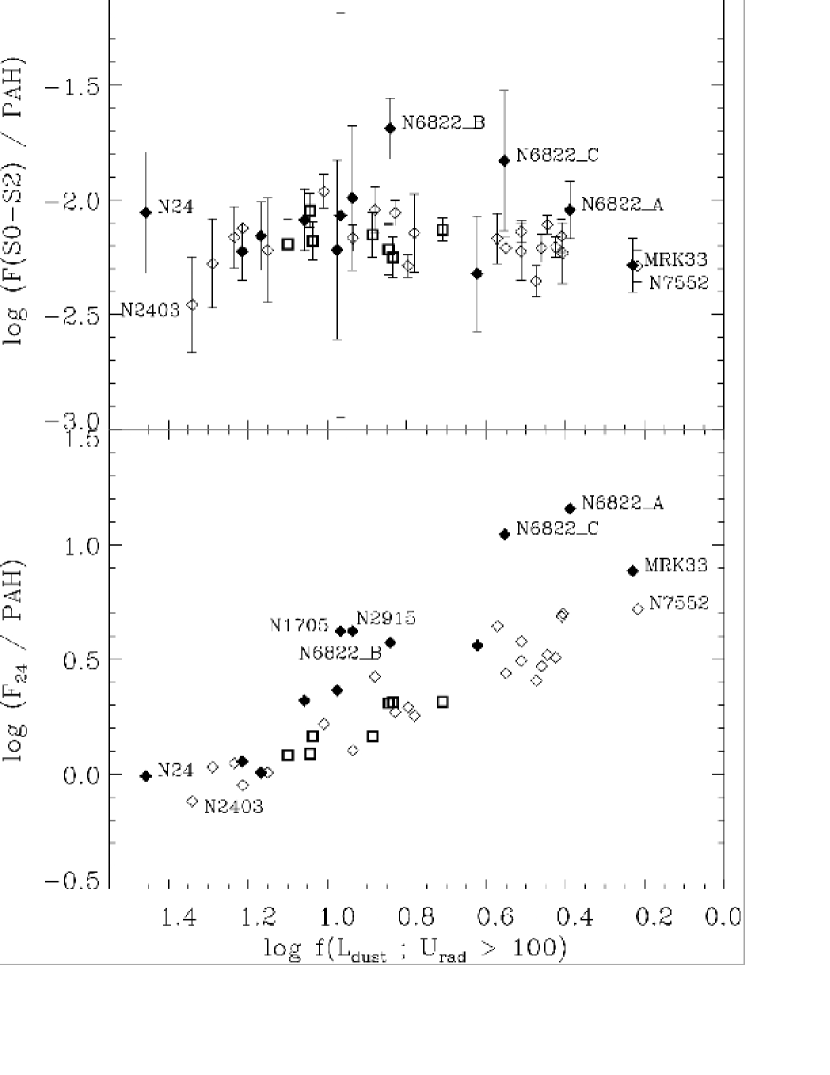
The tight association between H2 emission and aromatic bands (Fig. 8c) may be surprising if one assumes that a significant fraction of aromatic band emission arises from diffuse, mostly atomic regions with low radiation field intensities. The infrared emission of such clouds is often termed cirrus (Low et al., 1984; Terebey & Fich, 1986). If this were the case, then the scaling of PAH flux with H2 flux could be explained only if a constant fraction of the total FUV flux escaped PDRs and were absorbed in the more diffuse interstellar medium. We stress that we adopt here the definition of photodissociation regions stated by Hollenbach & Tielens (1997): these are not restricted to the interfaces between bright HII regions and dense molecular clouds, but apply more generally to all the neutral interstellar medium illuminated by FUV photons (with energies between 6 and 13.6 eV). Figure 9 demonstrates the great difficulty of making the idea of an important contribution from the cirrus medium consistent with the data. It shows the flux ratios of H2 to PAH emission on the one hand, and 24 m to PAH emission on the other hand, as a function of , estimated within the spectroscopic apertures. The quantity is closely related to , derived from the modelling of the global spectral energy distributions by Draine et al. (2007), which is the fraction of the total dust luminosity emitted by regions with radiation field intensities higher than 100 times the local average value. The dust luminosity fraction of cirrus clouds, , can be evaluated as , if one assumes that and are in constant proportion to each other. Fig. 9 shows that while the /PAH ratio rises by about one order of magnitude, the H2/PAH ratio is invariant as a function of or . The results obtained by replacing with , which has the same physical significance as , a more traditional indicator of the relative importance of HII regions and cirrus clouds (Helou, 1986), are identical.
We conclude that aromatic bands are mostly associated with photodissociation regions (illuminated by FUV photons able to provide H2 excitation). In addition, since PAHs are excited not only by FUV photons but also by low-energy photons, the observed constancy of the H2 to PAH ratio imposes some restrictions on possible variations of the radiation field hardness. Assuming that cirrus clouds, i.e. PDRs with low radiation field intensities, receive appreciably softer radiation than PDRs with high radiation field intensities, it would be difficult to understand how both types of regions could produce similar H2/PAH ratios. As a corollary, the hypothesis that cirrus clouds could make a large contribution to H2 and PAH emission in our targets, although not definitely ruled out, is not favored. Note that the situation may be different in more quiescent parts of galaxies, not probed by the present sample, and deserves further investigation. Measurement of H2 line fluxes in quiescent regions is however challenging, because they depend steeply on the and parameters.
The above does not preclude a large portion of the H2 and PAH emission to originate in relatively diffuse molecular gas. Estimates of the optical depth of the 12CO(1-0) line, over large areas of the Galaxy, indicate that the total molecular medium comprises a substantial diffuse component (Polk et al., 1988). We will see in the next section that our data, for a portion of the targets, do support an important contribution from low-density PDRs to the total warm H2 emission.
6 Excitation mechanisms in star-forming regions
In sources with purely stellar activity, H2 emission is expected to arise in varying proportions from two main energy sources: the far-ultraviolet radiation of OB stars illuminating PDRs; and shocks in supernova remnants or other sources, providing collisional heating. In the first case, the excitation can be thermal, by collisions with gas heated by photoelectrons, or by inelastic collisions with H2 molecules pumped by FUV photons. The excitation mechanism can also be fluorescence, followed by radiative cascade to the ground vibrational state. Heating by supernova remnants is unlikely to be dominant for two reasons, as we have seen in Sect. 5.3. First, at the low observed temperatures dominating the warm H2 mass, heating would have to be provided by slow shocks, which are not efficient enough to compete with PDR excitation. Second, variations in star formation histories within the sample, which are shown by Moustakas et al. (2007, in prep.) to be very large (from population synthesis fitting to optical spectra), would produce more scatter than observed in the H2/PAH ratio. We conclude that H2 is heated predominantly by PDRs, and this interpretation is supported both by energetics arguments and by the close association with aromatic band emission (Sect. 5). In this section, we focus on additional constraints on the physical conditions and excitation mechanisms in PDRs (thermal or fluorescent) from the line ratios and excitation diagrams.
6.1 Constraints from the temperature distribution
We have seen that the H2 to far-infrared ratios are consistent with values of , the ratio of the average radiation field intensity to the hydrogen density in PDRs, between about 0.1 and 1. In principle, separate constraints on and on can be obtained from the temperature distribution reflected in the H2 line ratios (Kaufman et al., 2006). Given the complexity of the surveyed regions, however, the interpretation of the line ratios by comparison with models of a single PDR is severely limited. First, the emission from many distinct PDRs, presumably showing a large range of physical conditions, is averaged within the beam. Second, even though the total emission in the sum of the S(0) to S(3) lines is probably dominated by PDRs, shocks also related to the star formation activity must be present, driven in particular by supernova remnants, protostellar outflows, or turbulence dissipation (Falgarone et al., 2005). Since these shocks are characterized by higher rotational temperatures than PDRs, they would contribute mostly to the S(3) line (Kaufman & Neufeld, 1996), and in view of the observed line ratios, negligibly to the lower-lying transitions.
In both cases, the superposition of PDRs of different conditions or of shocks induces a spread in temperatures, and as a consequence these are not reproduced by single PDR models. We compared the line ratios of the star-forming targets with to the predictions of Kaufman et al. (2006). Although the ranges in and derived from S(2)/S(0) have a broad overlap with those derived from S(1)/S(0), the S(3)/S(1) ratios are inconsistent, indicating more intense radiation fields and higher densities. The least biased tracer of physical conditions in the bulk of the PDRs is thus the S(1)/S(0) ratio (for galaxies with ). It suggests that the average varies between about 100 and 5000 (in units of erg s-1 cm-2) and the average between about 500 and cm-3.
6.2 Fluorescent excitation
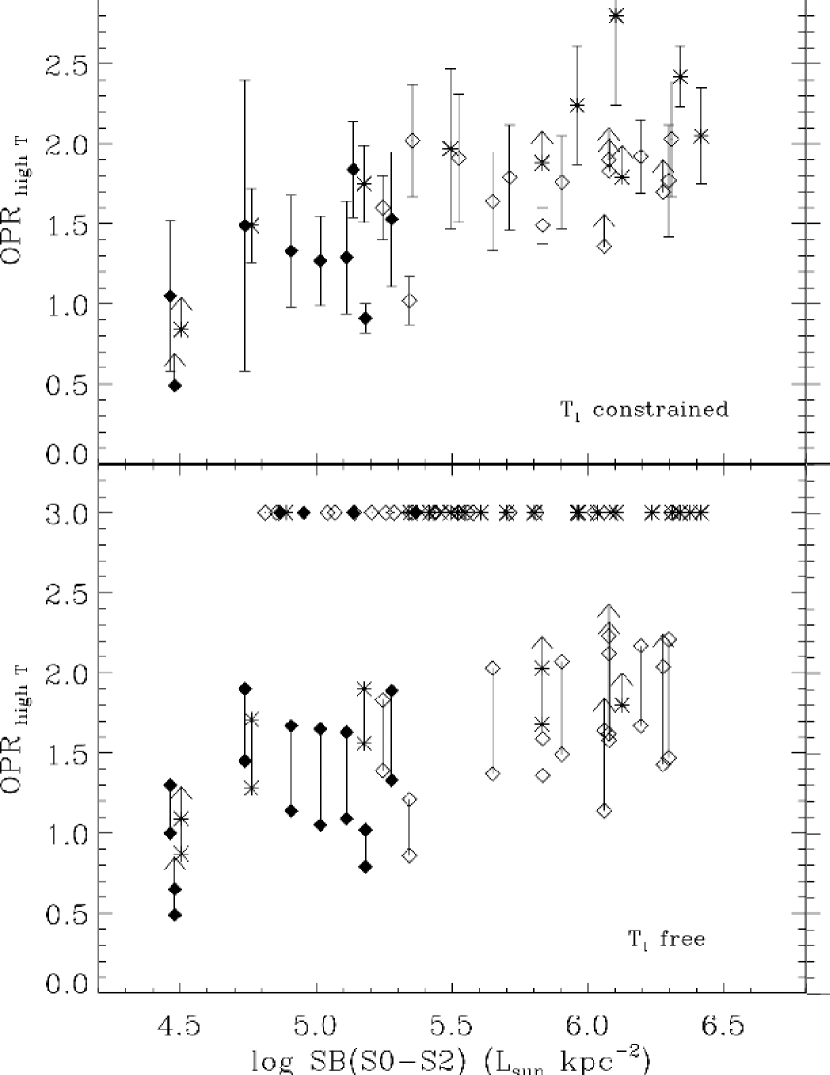
It is surprising that in several objects, the S(0) to S(3) transitions are not thermalized, as indicated by deviations from an apparent of 3. values that are different from the equilibrium value at the temperature of the H2 gas arise naturally from fluorescent excitation, if the gas density is lower than the critical density for ortho-para equilibration by collisions with H and H+ (Sternberg & Neufeld, 1999). This is because the ultraviolet absorption lines have a greater optical depth in the ortho states than in the para states, so that the ortho states at a given depth are pumped less. The apparent values only apply to the states excited by FUV pumping, and do not imply that the true value (for the J=1 and J=0 states, where most of the gas resides) be different from 3. For a total of 3, the of the excited levels is predicted to be close to . A thorough review of the phenomenon of selective excitation and its implications for the interpretation of excitation diagrams was provided by Sternberg & Neufeld (1999). Note that radiative decay in the electronic ground state and most collisional (de)excitations always occur at fixed spin number and thus preserve the ortho or para state. Conversion from one state to the other can be accomplished by H2 dissociation followed by reformation on dust grains, or by reactions with protons and hydrogen atoms in the gas phase.
Deviations from thermalization had previously remained unseen for rotational lines of extragalactic sources (Rigopoulou et al., 2002; Higdon et al., 2006). In the frame of PDR excitation, values may be interpreted as arising in FUV-pumped gas with sufficiently low densities to prevent ortho-para equilibration by collisions. However, because this process depends on unknown timescales for gas heating, cooling, dissociation and reformation, we are unable to quantify in a simple way the implied density conditions. Alternatively, it is conceivable that the emission comes from initially cold gas, that has been heated by slow shocks and has not had time to reach the equilibrium value of (Timmermann, 1998; Wilgenbus et al., 2000). For HII nuclei, however, we have seen that photodissociation region excitation is more likely than shock heating (Sect. 5).
Another possibility is that in a fraction of the PDRs within the beam, the photodissociation front is advancing into cold gas (in LTE at time with and ), and the recently-heated gas has not yet had enough time to reach LTE at time (with and according to Equ. 2). This is the interpretation favored by Fuente et al. (1999) and Habart et al. (2003) to explain the non-LTE ortho to para ratios observed in the PDRs of NGC 7023 and Ophiuchi, respectively. In this scenario, the observed portion of the interstellar medium would have to contain a much larger fraction of non-equilibrium PDRs in targets with low than in targets with , and the underlying reason would be unclear. It is also unknown whether the timescales involved in ortho-para equilibration in our sources are long enough for this scenario to be viable.
Figure 10 shows the derived values (fixed to 3 whenever the temperatures derived from each pair of adjacent transitions were compatible with this assumption) as a function of the total brightness of the S(0) to S(2) lines. We have here included LINERs and Seyferts because they do not display a different behavior in this diagram. Under the hypothesis of photodissociation region excitation, and assuming first that sites of star formation occupy a constant fraction of the observing beam, sources with low H2 brightnesses should consist of regions with both low densities and low radiation field intensities, while sources with the highest H2 brightnesses should include a greater fraction of high-density, high-radiation regions. In this simplified view, low values of , indicating that H2 is not thermalized by collisions, could be obtained only in the low-brightness sources, as seen generally in Fig. 10. Variations in the beam filling factor by sites of star formation would then induce a horizontal scatter, which is indeed very large. Fig. 10 also shows as a function of the average surface brightness in the 24 m band. The latter quantity incorporates a significant contribution from HII regions, and should be dominated by variations in radiation field intensity, rather than variations in gas density. The fact that the horizontal spread is larger in this diagram than in the diagram involving the H2 brightness supports our tentative interpretation in terms of density effects. In addition, does not show any variation as a function of , and only a weak tendency to increase with the quantity discussed in the previous section. Both these quantities are indicators of the average radiation field intensity; they are observed to be generally correlated with the gas density, but only weakly. Although the data do not allow us to truly estimate average densities in photodissociation regions, they suggest that in a substantial number of the observed nuclear regions, the emission can be dominated by low density gas, relative to well-studied Galactic PDRs and starburst galaxies. New modelling is required to quantify the conditions under which rotational lines indicate in PDRs.
The H2 line ratios, compared with the PDR model of Kaufman et al. (2006), do not indicate lower gas densities, on average, in galaxies with than in galaxies with . However, the densities estimated in this way are averages within the whole beam, and the densest and warmest regions have a greater weight, because they are more luminous in H2; if a large spread in densities exists, with both dense clumps and diffuse PDRs, an increase in the diffuse fraction may not be easily detectable in the average density, while still leaving an imprint on . We note that the proton density should also play an important role, since ortho-para conversion is effected by collisions with H and H+. Whether galaxies with have lower proton densities in molecular clouds, due to reduced ionization by cosmic rays, is in principle testable with radio continuum observations of synchrotron radiation from cosmic ray electrons. The number of sample galaxies with adequate data, at sufficiently high angular resolution, is however too small to apply this test.
We have seen in Section 3.3 that extinction effects are unlikely to modify our results in a statistical sense. The fitted values are correlated with the brightness of the dust emission, in the aromatic bands, the 24 m continuum and total infrared emission (not shown here but similar to Fig. 10), which is a further indirect argument against extinction effects being responsible for low values. If extinction played a significant role, then low values would be seen preferentially in bright and compact regions, which is not the case.
The galaxies for which we derive the lowest values (and among the lowest H2 surface brightnesses, regardless of the constraint on the temperature) are NGC 337, NGC 1705 ( is a lower limit), NGC 2915, NGC 4552 ( is a lower limit) and NGC 7793. The first three are dwarf galaxies, NGC 7793 a very late-type spiral and NGC 4552 is a small elliptical galaxy classified as LINER, with the smallest infrared brightness of the whole sample. Since smaller gas densities are expected in general in dwarf galaxies than in the central regions of massive galaxies, except in blue compact dwarfs such as Mrk 33, this finding is consistent with our interpretation of small values in terms of low density. We may also remark that in NGC 1705, which is a starburst, no ultracompact HII region was detected in the radio (Johnson et al., 2003); thus no conflict exists with the hypothesis that the photodissociation regions in NGC 1705 have low densities.
7 Excitation mechanisms in LINER and Seyfert nuclei
A large number of the galaxies classified as LINERs or Seyferts deviate significantly from the relations discussed in Section 5, in having a strong excess of H2 emission with respect to all the other tracers used here, not only aromatic bands but also [SiII], the 24 m flux and the total infrared emission (Fig. 8), arguing for an alternative excitation mechanism in these galaxies. The average and dispersion of each power ratio are given separately for HII nuclei and for LINER and Sy nuclei in the figure caption. Given these results, the quantities by which the two categories are most clearly separated are the H2 to aromatic band ratio and the H2 to [SiII] ratio. In particular, nuclear regions with are likely to be of the LINER or Sy type at the 99% confidence level.
We thus define an excess of H2 emission, with respect to HII nuclei, based on the observed relation with aromatic bands. We choose as the maximal H2 power associated purely with star formation the quantity . Aromatic band carriers are thought to be destroyed in intense radiation field environments, such as HII region cores (Giard et al., 1994) and ionized regions around Seyfert nuclei (Désert & Dennefeld, 1988; Voit, 1992). They would however survive where H2 is not dissociated, so that an enhancement of the H2/PAH ratio is more likely caused by a genuine excess of H2 emission, in conditions where PAHs are not excited, rather than normal H2 emission occurring where PAHs would have been destroyed. Furthermore, H2 emission is seen in excess not only with respect to aromatic bands, but also with respect to [SiII] and other dust tracers (24 m and total infrared emission). [SiII] emission may be depressed because the ionization state of silicon becomes higher, but the dust continuum cannot be suppressed like aromatic bands. Our empirical quantification of the H2 excess is intended to extract the part of H2 emission that cannot originate in photodissociation regions. The excitation mechanism that is required to account for this excess, while not exciting PAHs, is either X-ray irradiation or shock heating.
We discuss LINER and Sy nuclei as a single category, because no detectable difference exists in their H2 properties. This may be expected for several reasons: small-number statistics; the fact that the classification of low-luminosity AGNs can be ambiguous as it depends on the aperture size in particular; and the fact that the source of H2 excitation might not be directly linked to the nuclear activity, as the results discussed below suggest.
7.1 Heating by X-rays from an active galactic nucleus
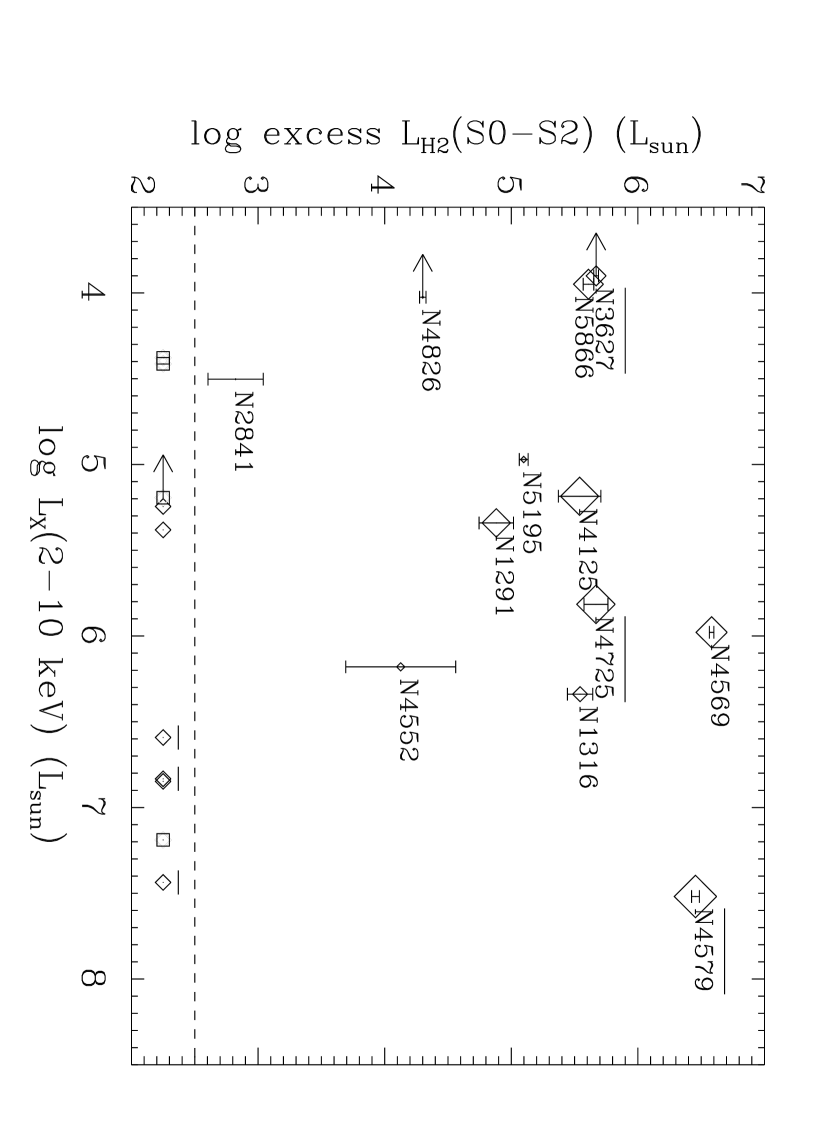
The idea that a nuclear X-ray source may modify the chemistry and excitation of the surrounding molecular clouds through sufficiently large column densities as to offer a convenient way to identify active nuclei hidden by dust has recently received much attention. Models predict, in particular, unusual ratios of tracers of dense molecular gas (Lepp & Dalgarno, 1996; Meijerink & Spaans, 2005), consistent with observations of NGC 1068 (Usero et al., 2004). X-ray excitation would also manifest itself in the properties of H2, the most abundant molecule. To test the hypothesis that the additional excitation in galaxies showing a significant excess of H2 emission with respect to aromatic bands (Figure 8c) is predominantly produced by nuclear X-rays, we have compiled estimated X-ray fluxes in the 2-10 keV band obtained from Chandra observations. The data and references are summarized in Table 6. The H2 excess is shown as a function of the X-ray luminosity of the nucleus in Fig. 11. Here, galaxies with no H2 excess according to our definition are shown below the dashed line.
The spread in Figure 11 is very large. Since the available X-ray measurements do not isolate the hard X-ray component, but include soft emission, a substantial part can be thermal emission from supernova remnants, as opposed to power-law emission from the activity related to a central supermassive black hole. Many HII nuclei with no H2 excess indeed have X-ray luminosities that are comparable to those of LINER and Seyfert nuclei. On the other hand, some galaxies, in particular NGC 3627, NGC 4569 and NGC 5866, are very luminous in H2 but have only modest X-ray to H2 luminosity ratios compared with other H2-excess galaxies. We shall assume a power-law spectrum with a standard photon index of , as adopted by Ho et al. (2001), to extrapolate the total X-ray luminosity to lower photon energies. Under this assumption, the luminosity between 0.2 and 10 keV is only two times the luminosity between 2 and 10 keV compiled here. Up to 10% of the intrinsic 1-10 keV luminosity may emerge in the sum of all H2 transitions (Lepp & McCray, 1983), whereas in our comparison we have summed only the three rotational lines S(0) to S(2). Therefore, pure X-ray excitation of the excess H2 emission should not be energetically possible even in objects such as NGC 4579 and NGC 5195, which have relatively low H2 to X-ray luminosity ratios in Fig. 11. Even if the intrinsic emission in soft X-rays were underestimated by a large factor, X-ray excitation would still be unlikely to dominate in most cases. The apparent trend of increasing excess H2 luminosities with increasing X-ray luminosities in Fig. 11 does not imply a direct excitation of H2 by X-rays, since it could also be understood in the frame of multi-phase shocks, produced by supernova remnants or by starburst winds (see below). From near-infrared line ratios, Davies et al. (2005) also reached the conclusion that X-rays do not contribute significantly to the excitation of H2 in a small sample of active galactic nuclei, within regions smaller than those sampled here (about 100 pc).
Supernova remnants are another important source of X-rays. More than half their mechanical energy can be converted to X-rays, mostly with energies below eV (Draine & Woods, 1991), but the X-ray power is converted to H2 emission in the S(0) to S(2) lines with low efficiencies, less than (Draine & Woods, 1990). Therefore, in view of the estimates presented in Fig. 12 (see the next Section for details), heating of H2 by X-rays from supernova remnants is completely negligible.
7.2 Heating by shocks
For galaxies such as NGC 3627 and NGC 4569, with very high H2 to X-ray luminosity ratios, an efficient mechanism has to be invoked to account for the H2 brightness. It has been shown recently that galactic shocks can convert a very large fraction of the kinetic energy into rotational H2 emission without producing a lot of X-rays (Appleton et al., 2006). We thus propose that large-scale shocks play a major role. NGC 3627 is an interacting galaxy in the Leo Triplet, characterized by severe morphological and kinematical distortions and, in the center, a massive molecular gas concentration in the form of an asymmetric bar-like structure (Zhang et al., 1993), with a peak in the stellar velocity dispersion that is shifted by about 3″ from the nucleus, and probably strong gas inflow into the nucleus (Afanasiev & Sil’chenko, 2005). NGC 4569 is a starburst LINER (Maoz et al., 1998) having recently produced a large number of supernova explosions, triggering the expansion of X-ray, H (Tschöke et al., 2001) and synchrotron emission lobes (Chyzy et al., 2006), and also has a circumnuclear ring of molecular gas with strong non-circular motions (Nakanishi et al., 2005). The situation could be similar to NGC 4945, where H2 emission is seen to follow the innermost part of a starburst outflow, with an extent of pc (Moorwood et al., 1996). These two examples thus support the idea of a dominant excitation by shocks, triggered by dynamical perturbations and by a starburst wind, respectively.
In order to test the possibility that the excess H2 emission be caused by supernova remnant shocks, we estimated the required heating efficiencies in the following way. We first computed the star formation rate required to account for the excess H2 emission, assuming constant star formation, if all the mechanical power is converted to the power emitted by the sum of the S(0) to S(2) lines (using the Starburst99 population synthesis model of Leitherer et al., 1999). We then compared this with the star formation rate estimated from the 24 m luminosity, using the calibration of Wu et al. (2005) for the same initial mass function. The ratio of the two rates gives an order-of-magnitude estimate of the H2 heating efficiency that is needed if supernova shocks are invoked as the dominant heating mechanism, and is shown in Fig. 12 as a function of the excess H2 luminosity. In this simplified computation, the H2 excess in the star-forming regions B and C of NGC 6822 can easily be attributed to supernova remnant shocks, as they would imply efficiencies of at most 3%. Besides these regions, supernova remnants are also a sufficient heating source of the excess H2 for at least six of the LINER and Sy nuclei. In NGC 5195, in particular, the necessary heating efficiency (including the fraction of the total mechanical power injected and absorbed in molecular clouds) is very small. Galaxies such as NGC 4450 and NGC 4579, on the other hand, unambiguously require much more power than available in supernova remnants. The excitation source could be shocks triggered by cloud collisions induced by gravitational perturbations, maybe in combination with X-rays.
NGC 1316 (Fornax A) stands out in Fig. 7 as having the highest temperature ( K) and the lowest mass fraction in warm phase (%), and the lowest levels up to J=4 are characterized by a single temperature. In this particular case, H2 may be heated by fast shocks caused by the powerful jet that has produced large-scale radio lobes, and that is observed in the form of knots in the inner kiloparsec, which may be a signature of interaction with the interstellar medium, i.e. shocks (Geldzahler & Fomalont, 1984). Excitation by far-ultraviolet radiation and X-rays or by slow shocks would produce a large quantity of H2 at temperatures between 100 and 300 K (Burton et al., 1992; Maloney et al., 1996), which is ruled out by the data. NGC 1316 is the only galaxy of the sample for which the excess H2 may be heated by an AGN jet.
Of the 16 H2-excess galaxies, all have excitation diagrams consistent with (at least in the free- fits), except NGC 1266, NGC 5866 and NGC 4125. NGC 1266 may be unusual simply by virtue of its significant optical depth, as discussed in Section 3.3. This predominance of , combined with more elevated temperatures than in HII nuclei on average (Fig. 7) would be consistent with the excess H2 emission originating in shocks where ortho-para equilibration is fast. It remains however difficult to test this idea, and to identify the source of these shocks.
8 Summary and conclusions
We present the measurements and results of a survey of the four lowest-energy rotational transitions of H2, S(0) to S(3), in a local sample of 57 galaxies, from the SINGS program. For three galaxies in this sample, higher-energy transitions, up to S(7), could be measured. Characterizing the amount and physical conditions of the warm molecular hydrogen phase traced by these lines is of prime interest, because molecular hydrogen represents a major mass fraction of the interstellar medium of normal galaxies, and the warm phase itself (gas heated to temperatures of to 1000 K) can constitute a substantial fraction of the total H2.
The emission is measured over areas of median size 0.9 kpc, thus including a large number of distinct star formation sites and molecular clouds. The sample comprises mostly nuclear regions (in 47 massive galaxies and 9 dwarf galaxies), of which 45% are optically classified as LINER or Seyfert, as well as 10 extranuclear star-formation complexes within a dwarf galaxy and a spiral. With respect to earlier studies of molecular hydrogen emission in galaxies, and particularly rotational lines, which had focussed on very bright systems (nearby starbursts and AGNs, as well as ultraluminous galaxies), this paper provides results on the average properties of warm H2 of relatively faint systems, more representative of the general population of galaxies.
Perhaps the most significant observational results (detailed below) are: (1) the tight correlation of the powers emitted by the sum of the S(0) to S(2) lines and by aromatic bands, and the fact that the (S0-S2)/PAH ratio is insensitive to the marked variations in average radiation field intensities existing in our sample; (2) the existence of non-equilibrium ortho to para ratios in the rotational levels, that are weakly correlated with the surface brightness of the H2 lines. These results call for further modelling in order to be better understood.
Masses and column densities: The total masses of warm H2 within our apertures range between M☉ and close to M☉ in galaxy nuclear regions. In star formation complexes of nearby dwarf galaxies (NGC 2915 and NGC 6822), we probe warm H2 masses down to a few M☉ within equivalent diameters of 60 to 250 pc. The mass densities range between 0.2 and 30 M☉ pc-2. The column densities that we derive are on average of the same order of magnitude as the column densities observed in individual Galactic photodissociation regions. For systems in which H2 is predominantly excited by PDRs, assuming they have similar characteristics to the Orion Bar, this implies that they fill most of the observing beam.
H2 mass fraction in the warm phase ( K): Under a conservative assumption about the distribution of temperatures, we find that the warm H2 gas makes up between 1% and more than 30% of the total H2. For star-forming galaxies, the median mass fraction in the warm phase is 10%. The column density nevertheless has a steep inverse dependence on the temperature, and we cannot rule out that the unconstrained cool H2 component ( K) might in some cases dominate the S(0) and S(1) emission and account for most of the H2 mass.
PDR excitation in star-forming regions: In HII nuclei, we observe a remarkably narrow range of H2 to aromatic band flux ratio. This result argues for photodissociation regions providing most of the power used for H2 excitation, since aromatic bands are known to arise predominantly from these regions, as defined by Hollenbach & Tielens (1997), that include all the neutral interstellar medium illuminated by FUV photons. Two main excitation mechanisms can be at work simultaneously in PDRs: pumping by FUV photons, followed by fluorescent decay to the ground electronic state, and collisions with hydrogen atoms and molecules heated by photoelectrons or FUV pumping. Comparison with the predictions of PDR models for the ratio of H2 to FUV luminosity indicates a narrow range of average physical conditions, between 0.1 and 1 with the radiation field intensity in units of erg s-1 cm-2 and the hydrogen nucleus density in units of cm-3. The sum of the S(0) to S(2) transitions represents between and of the total infrared power, and on average 30% of the [SiII] line power. The observed temperatures suggest that the average varies between about 100 and 5000, and the average between about 500 and cm-3. This seems to imply that H2 rotational line emission comes mostly from molecular clouds illuminated by OB associations. We have seen however that the estimator of these parameters is biased (see Section 6.1), and a non-negligible contribution from less dense regions with less intense radiation fields is not excluded.
Evidence for fluorescence in star-forming regions: Previous surveys of rotational lines in galaxies had not revealed any departure from thermalization of H2, which is a consequence of the relatively low critical densities of the lower rotational transitions. By contrast, we find that nearly half the targets in our sample deviate significantly from local thermodynamic equilibrium in having apparent ortho to para ratios lower than the equilibrium value of three. We have seen that this result cannot be an artifact caused by extinction effects. Low values of may thus be interpreted as evidence of fluorescent excitation, which naturally leads to low ortho to para ratios in the excited states, occurring in regions of sufficiently low density that ortho-para equilibration by collisions is incomplete. The fraction of relatively diffuse molecular gas in normal galaxies could thus be far from negligible. In order to test this idea, it would be desirable to obtain independent estimates of the average gas density in PDRs. In the absence of any robust estimate of this quantity, we used the surface brightness of the sum of the S(0) to S(2) transitions as a tracer of the coupled variations of and to show that the data are compatible with an interpretation of low apparent values in terms of low density PDRs. In particular, the lowest values occur preferentially in very late type galaxies, that may have a more diffuse interstellar medium than earlier-type galaxies. In the present sample, close to half the star-forming targets have low values. We infer that fluorescence can be the predominant excitation mechanism of rotational H2 lines in normal star-forming galaxies. In more active galaxies, however, collisional excitation in photodissociation regions is likely to overtake fluorescence, even though the latter still contributes to gas heating. Alternatively, low values may be caused by non-equilibrium PDRs, in which initially cold gas, recently reached by the photodissociation front and heated, has not had enough time to adjust its ortho to para ratio. A disadvantage of this scenario is that it does not explain why PDRs would have systematically different properties in targets with and in those with . We thus emphasize that the cause of non-equilibrium ortho to para ratios in the rotational levels is not well understood at present.
Differences between HII and LINER/Sy nuclei: Despite our large observing beam implying that the emission from the immediate vicinity of the nucleus is diluted in the emission from extended areas decoupled from nuclear activity, a large fraction of nuclei classified as LINER or Seyfert distinguish themselves from purely star-forming nuclei in several ways. In a statistical sense, the temperatures of the warm H2 phase are slightly higher, and as a corollary the mass fractions of warm to total H2 are lower (with a median of 4% instead of 10% for HII nuclei). The correlation between H2 and aromatic band emission observed in HII nuclei also breaks down in LINER and Sy nuclei. A large number of them have excess emission in the H2 lines, with respect to aromatic bands and to [SiII], which in general is the brightest cooling line in the mid-infrared range (with possible contributions from both PDRs and HII regions as well as X-ray irradiated gas), and, to a lesser degree, with respect to the total infrared emission. The fact that less contrast between the different nuclear categories is seen in the H2/TIR ratio may partly be due to the fact that estimating the 70 m and 160 m fluxes within our small apertures requires a large extrapolation.
Threshold for nonstellar excitation: We propose that nuclear ratios , with observables defined as in our study, are indicative of the LINER and Sy categories. It should however be kept in mind that some sources belonging to these classes are indistinguishable from HII nuclei. This could be thought of as mainly a distance and beam dilution effect; but the H2/PAH ratio behaves contrary to this expectation, since in the present sample it shows a correlation with distance, rather than an anti-correlation. None of the quantities derived in this paper shows any dependence on distance, with this exception of the H2 excess in LINER and Sy nuclei. The fact that it tends to increase with distance could be a selection bias, but it also suggests that the H2 excess is in general spatially extended. We may also remark that for galaxies like NGC 1377, whose dust emission is interpreted as dominated by an extremely young and opaque starburst (Roussel et al., 2006), the above criterion to select LINER and Sy nuclei will not be applicable.
Shock excitation in LINER/Sy nuclei: We interpret the differences in H2/PAH ratios as a genuine excess of H2 emission (and not a deficit of the other tracers while preserving H2), i.e. as requiring at least one additional mechanism to excite H2 molecules with respect to PDR heating. Excitation by nuclear X-rays seems implausible, as models predict much lower heating efficiencies than what would be necessary to account for the estimated H2 excess, compared with X-ray luminosities derived from Chandra observations. We thus favor excess heating by large-scale shocks, caused either by the collective effect of supernovæ in an aging starburst, or by dynamical perturbations. An order-of-magnitude estimate suggests that supernova remnant shocks can easily account for the H2 excess of a fraction of the LINER and Sy nuclei (for example NGC 5195), but do not provide enough mechanical power for the galaxies with the highest H2/PAH ratios. For the latter, shocks triggered by dynamical perturbations are the best candidate to supply the excess H2 heating. In one case, it is conceivable that the excess H2 emission may be produced by the interaction of a nuclear jet with the interstellar medium, namely in NGC 1316 (Fornax A). This target has the warmest H2 of the whole sample, with no evidence for a cool ( K) component, the lowest mass fraction in the warm phase, and is remarkable for its large-scale radio lobes.
Ortho-para thermalization in LINER/Sy nuclei: Consistent with the hypothesis that the additional H2 may be caused by shocks in which ortho-para equilibration is fast, the excitation diagrams of most galaxies with excess H2 emission are consistent with ortho-para thermalization (), with three exceptions: NGC 1266, where we have seen that the apparent may be a result of high optical depth toward H2, NGC 5866 and NGC 4125. Note that the latter two galaxies are observed edge-on, so that could also be an extinction artefact; this would however imply that the optical depth derived from the silicate bands be underestimated by large factors (see Sect. 3.3). If excess H2 emission originated from shocks with in the latter two galaxies, it would imply that the gas was initially cold and had not had time to reach equilibrium.
The rotational H2 lines are most often fainter than the forbidden lines in the same wavelength range, in particular [SiII], [NeII], [NeIII] and [SIII] (with no example of an H2-dominated line spectrum in the present sample), but are among the dominant coolants of molecular gas and provide important constraints on the excitation of the warm molecular interstellar medium, where a large mass fraction of the gas resides in normal galaxies. The results presented here are assumed to be representative of moderate-luminosity galaxies of all types, and can serve as a comparison point for future studies of distant galaxies.
References
- Aalto et al. (1995) Aalto, S., Booth, R.S., Black, J.H., & Johansson, L.E. 1995, A&A, 300, 369 (A95)
- Afanasiev & Sil’chenko (2005) Afanasiev, V.L., & Sil’chenko, O.K. 2005, A&A, 429, 825
- Albrecht et al. (2004) Albrecht, M., Chini, R., Krügel, E., Müller, S.A., & Lemke, R. 2004, A&A, 414, 141 (A04)
- Allers et al. (2005) Allers, K.N., Jaffe, D.T., Lacy, J.H., Draine, B.T., & Richter, M.J. 2005, ApJ, 630, 368
- Appleton et al. (2006) Appleton, P.N., Xu, K.C., Reach, W., et al. 2006, ApJ, 639, L51
- Bajaja et al. (1991) Bajaja, E., Krause, M., Wielebinski, R., & Dettmar, R.J. 1991, A&A, 241, 411 (B91)
- Bally & Lane (1982) Bally, J., & Lane, A.P. 1982, ApJ, 257, 612
- Beck et al. (1979) Beck, S.C., Lacy, J.H., & Geballe, T.R. 1979, ApJ, 234, L213
- Beckwith et al. (1978) Beckwith, S., Gatley, I., & Persson, S.E. 1978, ApJ, 219, L33
- Black & Dalgarno (1976) Black, J.H., & Dalgarno, A. 1976, ApJ, 203, 132
- Böker et al. (2003) Böker, T., Lisenfeld, U., & Schinnerer, E. 2003, A&A, 406, 87 (B03)
- Boulanger et al. (1990) Boulanger, F., Falgarone, E., Puget, J.L., & Helou, G. 1990, ApJ, 364, 136
- Braine et al. (1993) Braine, J., Combes, F., Casoli, F., et al. 1993, A&AS, 97, 887 (B93)
- Brooks et al. (2000) Brooks, K.J., Burton, M.G., Rathborne, J.M., Ashley, M.C., & Storey, J.W. 2000, MNRAS, 319, 95
- Burton et al. (1992) Burton, M.G., Hollenbach, D.J., & Tielens, A.G. 1992, ApJ, 399, 563
- Burton et al. (1989) Burton, M.G., Brand, P.W., Geballe, T.R., & Webster, A.S. 1989, MNRAS, 236, 409
- Chandar et al. (2000) Chandar, R., Bianchi, L., & Ford, H.C. 2000, AJ, 120, 3088
- Chyzy et al. (2006) Chyzy, K.T., Soida, M., Bomans, D.J., et al. 2006, A&A, 447, 465
- Claussen & Sahai (1992) Claussen, M.J, & Sahai, R. 1992, AJ, 103, 1134 (C92)
- Contini et al. (1997) Contini, T., Wozniak, H., Considere, S., & Davoust, E. 1997, A&A, 324, 41 (C97)
- Curran et al. (2001) Curran, S.J., Polatidis, A.G., Aalto, S., & Booth, R.S. 2001, A&A, 368, 824 (C01)
- Dale et al. (2007) Dale, D.A., Gil de Paz, A., Gordon, K.D., et al. 2007, ApJ, 655, 863
- Dale et al. (2006) Dale, D.A., Smith, J.D., Armus, L., et al. 2006, ApJ, 646, 161
- Dale & Helou (2002) Dale, D.A., & Helou, G. 2002, ApJ, 576, 159
- Dame et al. (2001) Dame, T.M., Hartmann, D., & Thaddeus, P. 2001, ApJ, 547, 792
- Davies et al. (2005) Davies, R.I., Sternberg, A., Lehnert, M.D., & Tacconi-Garman, L.E. 2005, ApJ, 633, 105
- Davies et al. (2003) Davies, R.I., Sternberg, A., Lehnert, M., & Tacconi-Garman, L.E. 2003, ApJ, 597, 907
- Désert & Dennefeld (1988) Désert, F.X., & Dennefeld, M. 1988, A&A, 206, 227
- Draine & Li (2007) Draine, B.T., & Li, A. 2007, ApJ, 657, 810
- Draine et al. (2007) Draine, B.T., Dale, D.A., Bendo, G., et al. 2007, ApJ, in press (astro-ph/0703213)
- Draine & Woods (1991) Draine, B.T., & Woods, D.T. 1991, ApJ, 383, 621
- Draine & Woods (1990) Draine, B.T., & Woods, D.T. 1990, ApJ, 363, 464
- Draine et al. (1983) Draine, B.T., Roberge, W.G., & Dalgarno, A. 1983, ApJ, 264, 485
- Elfhag et al. (1996) Elfhag, T., Booth, R.S., Hoeglund, B., Johansson, L.E., & Sandqvist, A. 1996, A&AS, 115, 439 (E96)
- Falgarone et al. (2005) Falgarone, E., Verstraete, L., Pineau des Forêts, G., & Hily-Blant, P. 2005, A&A, 433, 997
- Fazio et al. (2004) Fazio, G., Hora, J.L., Allen, L.E., et al. 2004, ApJS, 154, 10
- Fuente et al. (1999) Fuente, A., Martin-Pintado, J., Rodriguez-Fernandez, N.J., Rodriguez-Franco, A., de Vicente, P., & Kunze, D. 1999, ApJ, 518, L45
- Gatley et al. (1987) Gatley, I., Hasegawa, T., Suzuki, H., et al. 1987, ApJ, 318, L73
- Gatley et al. (1984) Gatley, I., Beattie, D.H., Lee, T.J., Jones, T.J., & Hyland, A.R. 1984, MNRAS, 210, 565
- Gautier et al. (1976) Gautier, T.N., Fink, U., Treffers, R.R., & Larson, H.P. 1976, ApJ, 207, L129
- Geldzahler & Fomalont (1984) Geldzahler, B.J., & Fomalont, E.B. 1984, AJ, 89, 1650
- Giard et al. (1994) Giard, M., Bernard, J.P., Lacombe, F., Normand, P., & Rouan, D. 1994, A&A, 291, 239
- Gordon (1991) Gordon, M.A. 1991, ApJ, 371, 563 (G91)
- Graham et al. (1993) Graham, J.R., Serabyn, E., Herbst, T.M., et al. 1993, AJ, 105, 250
- Habart et al. (2003) Habart, E., Boulanger, F., Verstraete, L., Pineau des Forêts, G., Falgarone, E., & Abergel, A. 2003, A&A, 397, 623
- Helfer et al. (2003) Helfer, T.T., Thornley, M.D., Regan, M.W., et al. 2003, ApJS, 145, 259
- Helfer & Blitz (1993) Helfer, T.T., & Blitz, L. 1993, ApJ, 419, 86 (H93)
- Helou et al. (2004) Helou, G., Roussel, H., Appleton P., et al. 2004, ApJS, 154, 253
- Helou et al. (2001) Helou, G., Malhotra, S., Hollenbach, D.J., Dale, D.A., & Contursi, A. 2001, ApJ, 548, L73
- Helou et al. (1988) Helou, G., Khan, I.R., Malek, L., & Boehmer, L. 1988, ApJS, 68, 151
- Helou (1986) Helou, G. 1986, ApJ, 311, L33
- Herbst et al. (1996) Herbst, T.M., Beckwith, S.V., Glindemann, A., Tacconi-Garman, L.E., Kroker, H., & Krabbe, A. 1996, AJ, 111, 2403
- Herbst et al. (1990) Herbst, T.M., Graham., J.R., Tsutsui, K., Beckwith, S., Matthews, K., & Soifer, B.T. 1990, AJ, 99, 1773
- Higdon et al. (2006) Higdon, S.J., Armus, L., Higdon, J.L., Soifer, B.T., & Spoon, H.W. 2006, ApJ, 648, 323
- Ho et al. (2001) Ho, L.C., Feigelson, E.D., Townsley, L.K., Sambruna, R.M., Garmire, G.P., Brandt, W.N., et al. 2001, ApJ, 549, L51 (HF01)
- Ho et al. (1997) Ho, L.C., Filippenko, A.V., & Sargent, W.L. 1997, ApJS, 112, 315
- Hollenbach & Tielens (1997) Hollenbach, D.J., & Tielens, A.G. 1997, ARA&A, 35, 179
- Horellou et al. (2001) Horellou, C., Black, J.H., van Gorkom, J.H., Combes, F., van der Hulst, J.M., & Charmandaris, V. 2001, A&A, 376, 837 (H01)
- Houck et al. (2004) Houck, J.R., Roellig, T.L., van Cleve, J., et al. 2004, ApJS, 154, 18
- Hubble (1925) Hubble, E. 1925, ApJ, 62, 409
- Huber & Herzberg (1979) Huber, K.P., & Herzberg, G. 1979, Constants of diatomic molecules, ed. van Nostrand
- Israel (2005) Israel, F.P. 2005, A&A, 438, 855 (I05)
- Israel et al. (2003) Israel, F.P., Baas, F., Rudy, R.J., Skillman, E.D., & Woodward, C.E. 2003, A&A, 397, 87
- Israel & Baas (1999) Israel, F.P., & Baas, F. 1999, A&A, 351, 10 (I99)
- Israel et al. (1995) Israel, F.P., Tacconi, L.J., & Baas, F. 1995, A&A, 295, 599 (I95)
- Johnson et al. (2003) Johnson, K.E., Indebetouw, R., & Pisano, D.J. 2003, AJ, 126, 101
- Kaufman et al. (2006) Kaufman, M.J., Wolfire, M.G., & Hollenbach, D.J. 2006, ApJ, 644, 283
- Kaufman & Neufeld (1996) Kaufman, M.J., & Neufeld, D.A. 1996, ApJ, 456, 611
- Kenney & Young (1988) Kenney, J.D., & Young, J.S. 1988, ApJS, 66, 261 (K88)
- Kennicutt et al. (2003) Kennicutt, R.C., et al. 2003, PASP 115, 928
- Kilgard et al. (2005) Kilgard, R.E., Cowan, J.J., Garcia, M.R., Kaaret, P., Krauss, M.I., McDowell, J.C., et al. 2005, ApJS, 159, 214 (K05)
- Kim & Fabbiano (2003) Kim, D.W., & Fabbiano, G. 2003, ApJ, 586, 826 (KF03)
- Kinman et al. (1979) Kinman, T.D., Green, J.R., & Mahaffey, C.T. 1979, PASP, 91, 749
- Knapen et al. (1996) Knapen, J.H., Beckman, J.E., Cepa, J., & Nakai, N. 1996, A&A, 308, 27 (K96)
- Knop et al. (2001) Knop, R.A., Armus, L., Matthews, K., Murphy, T.W., & Soifer, B.T. 2001, ApJ, 122, 764
- Kohno et al. (2003) Kohno, K., Ishizuki, S., Matsushita, S., Vila-Vilaró, B., & Kawabe, R. 2003, PASJ, 55, L1 (K03)
- Kohno et al. (2002) Kohno, K., Tosaki, T., Matsushita, S., Vila-Vilaó, B., Shibatsuka, T., & Kawabe, R. 2002, PASJ, 54, 541 (K02)
- Larkin et al. (1998) Larkin, J.E., Armus, L., Knop, R.A., Soifer, B.T., & Matthews, K. 1998, ApJS, 114, 59
- Lee et al. (2006) Lee, H., Skillman, E.D., Cannon, J.M., et al. 2006, ApJ, 647, 970
- Leitherer et al. (1999) Leitherer, C., Schaerer, D., Goldader, J.D., et al. 1999, ApJS, 123, 3
- Leon et al. (1998) Leon, S., Combes, F., & Menon, T.K. 1998, A&A, 330, 37 (L98)
- Lepp & Dalgarno (1996) Lepp, S., & Dalgarno, A. 1996, A&A, 306, L21
- Lepp & McCray (1983) Lepp, S., & McCray, R. 1983, ApJ, 269, 560
- Leroy et al. (2005) Leroy, A., Bolatto, A.D., Simon, J.D., & Blitz, L. 2005, ApJ, 625, 763 (L05)
- Li & Draine (2001) Li, A., & Draine, B.T. 2001, ApJ, 554, 778
- Low et al. (1984) Low, F.J., Young, E., Beintema, D.A., et al. 1984, ApJ, 278, L19
- Lutz et al. (2000) Lutz, D., Sturm, E., Genzel, R., et al. 2000, ApJ, 536, 697
- Malhotra et al. (2001) Malhotra, S., Kaufman, M.J., Hollenbach, D., et al. 2001, ApJ, 561, 766
- Maloney et al. (1996) Maloney, P.R., Hollenbach, D.J., & Tielens, A.G. 1996, ApJ, 466, 561
- Maloney & Black (1988) Maloney, P., & Black, J.H. 1988, ApJ, 325, 389
- Mandy & Martin (1993) Mandy, M.E., & Martin, P.G. 1993, ApJS, 86, 199
- Maoz et al. (1998) Maoz, D., Koratkar, A., Shields, J.C., Ho, L.C., Filippenko, A.V., & Sternberg, A. 1998, AJ, 116, 55
- Mauersberger et al. (1999) Mauersberger, R., Henkel, C., Walsh, W., & Schulz, A. 1999, A&A, 341, 256 (M99)
- Meijerink & Spaans (2005) Meijerink, R., & Spaans, M. 2005, A&A, 436, 397
- Moneti et al. (2001) Moneti, A., Stolovy, S., Blommaert, J.A., Figer, D.F., & Najarro, F. 2001, A&A, 366, 106
- Moorwood et al. (1996) Moorwood, A.F., van der Werf, P.P., Kotilainen, J.K., Marconi, A., & Oliva, E. 1996, A&A, 308, L1
- Moorwood & Oliva (1988) Moorwood, A.F., & Oliva, E. 1988, A&A, 203, 278
- Mouri et al. (1990) Mouri, H., Kawara, K., Taniguchi, Y., & Nishida, M. 1990, ApJ, 356, L39
- Nakanishi et al. (2005) Nakanishi, H., Sofue, Y., & Koda, J. 2005, PASJ, 57, 905
- Nemmen et al. (2006) Nemmen, R.S., Storchi-Bergmann, T., Yuan, F., Eracleous, M., Terashima, Y., & Wilson, A.S. 2006, ApJ, 643, 652 (N06)
- Neufeld & Kaufman (1993) Neufeld, D.A., & Kaufman, M.J. 1993, ApJ, 418, 263
- Nishiyama & Nakai (2001) Nishiyama, K., & Nakai, N. 2001, PASJ, 53, 713 (N01)
- Pagel et al. (1980) Pagel, B.E., Edmunds, M.G., & Smith, G. 1980, MNRAS, 193, 219
- Parmar et al. (1991) Parmar, P.S., Lacy, J.H., & Achtermann, J.M. 1991, ApJ, 372, L25
- Planesas et al. (1997) Planesas, P., Colina, L., & Perez-Olea, D. 1997, A&A, 325, 81 (P97)
- Polk et al. (1988) Polk, K.S., Knapp, G.R., Stark, A.A., & Wilson, R.W. 1988, ApJ, 332, 432
- Puxley et al. (1988) Puxley, P.J., Hawarden, T.G., & Mountain, C.M. 1988, MNRAS, 234, 29
- Quillen et al. (1999) Quillen, A.C., Alonso-Herrero, A., Rieke, M.J., Rieke, G.H., Ruiz, M., & Kulkarni, V. 1999, ApJ, 527, 696
- Reach et al. (2002) Reach, W.T., Rho, J., Jarrett, T.H., & Lagage, P.O. 2002, ApJ, 564, 302
- Rieke et al. (2004) Rieke, G., Young, E.T., Engelbracht, C.W., et al. 2004, ApJS, 154, 25
- Rigopoulou et al. (2002) Rigopoulou, D., Kunze, D., Lutz, D., Genzel, R., & Moorwood, A.F. 2002, A&A, 389, 374
- Rotaciuc et al. (1991) Rotaciuc, V., Krabbe, A., Cameron, M., et al. 1991, ApJ, 370, L23
- Roussel et al. (2006) Roussel, H., Helou, G., Smith, J.D., et al. 2006, ApJ, 646, 841
- Sage (1993) Sage, L.J. 1993, A&A, 272, 123 (S93)
- Sage et al. (1992) Sage, L.J., Salzer, J.J., Loose, H.H., & Henkel, C. 1992, A&A, 265, 19 (S92)
- Sage (1989) Sage, L.J. 1989, ApJ, 344, 200 (S89)
- Sakamoto et al. (1999) Sakamoto, K., Okumura, S.K., Ishizuki, S., & Scoville, N.Z. 1999, ApJS, 124, 403 (S99)
- Satyapal et al. (2005) Satyapal, S., Dudik, R.P., O’Halloran, B., & Gliozzi, M. 2005, ApJ, 633, 86 (SD05)
- Satyapal et al. (2004) Satyapal, S., Sambruna, R.M., & Dudik, R.P. 2004, A&A, 414, 825 (S04)
- Sellgren et al. (1990) Sellgren, K., Tokunaga, A.T., & Nakada, Y. 1990, ApJ, 349, 120
- Sheth et al. (2005) Sheth, K., Vogel, S.N., Regan, M.W., Thornley, M.D., & Teuben, P.J. 2005, ApJ, 632, 217 (S05)
- Shioya et al. (1998) Shioya, Y., Tosaki, T., Ohyama, Y., et al. 1998, PASJ, 50, 317 (S98)
- Shull & Beckwith (1982) Shull, J.M., & Beckwith, S. 1982, ARA&A, 20, 163
- Shull & Hollenbach (1978) Shull, J.M., & Hollenbach, D.J. 1978, ApJ, 220, 525
- Smith et al. (2007a) Smith, J.D., Armus, L., Dale, D.A., Roussel, H., Sheth, K., Buckalew, B.A., Helou, G., & Kennicutt, R.C. 2007a, submitted to PASP
- Smith et al. (2007b) Smith, J.D., Draine, B.T., Dale, D.A., et al. 2007b, ApJ, 656, 770
- Smith et al. (2004) Smith, J.D., Dale, D.A., Armus, L., et al. 2004, ApJS, 154, 199
- Sofue et al. (2003) Sofue, Y., Koda, J., Nakanishi, H., et al. 2003, PASJ, 55, 17 (S03)
- Sternberg & Neufeld (1999) Sternberg, A., & Neufeld, D.A. 1999, ApJ, 516, 371
- Sternberg & Dalgarno (1989) Sternberg, A., & Dalgarno, A. 1989, ApJ, 338, 197
- Strong et al. (1988) Strong, A.W., Bloemen, J.B., Dame, T.M., et al. 1988, A&A, 207, 1
- Sugai et al. (1997) Sugai, H., Malkan, M.A., Ward, M.J., Davies, R.I., & McLean, I.S. 1997, ApJ, 481, 186
- Tacconi et al. (1991) Tacconi, L.J., Tacconi-Garman, L.E., Thornley, M., & van Woerden, H. 1991, A&A, 252, 541 (T91)
- Tanaka et al. (1989) Tanaka, M., Hasegawa, T., Hayashi, S.S., Brand, P.W., & Gatley, I. 1989, ApJ, 336, 207
- Taniguchi et al. (1994) Taniguchi, Y., Murayama, T., Nakai, N., Suzuki, M., & Kameya, O. 1994, AJ, 108, 468 (T94)
- Terebey & Fich (1986) Terebey, S., & Fich, M. 1986, ApJ, 309, L73
- Thompson et al. (1978) Thompson, R.I., Lebofsky, M.J., & Rieke, G.H. 1978, ApJ, 222, L49
- Tielens et al. (1993) Tielens, A.G., Meixner, M.M., van der Werf, P.P., et al. 1993, Science, 262, 86
- Tielens & Hollenbach (1985) Tielens, A.G., & Hollenbach, D. 1985, ApJ, 291, 722
- Timmermann (1998) Timmermann, R. 1998, ApJ, 498, 246
- Treffers (1979) Treffers, R.R. 1979, ApJ, 233, L17
- Treffers et al. (1976) Treffers, R.R., Fink, U., Larson, H.P., & Gautier, T.N. 1976, ApJ, 209, 793
- Tschöke et al. (2001) Tschöke, D., Bomans, D.J., Hensler, G. & Junkes, N. 2001, A&A, 380, 40
- Usero et al. (2004) Usero, A., García-Burillo, S., Fuente, A., Martín-Pintado, J., & Rodríguez-Fernández, N.J. 2004, A&A, 419, 897
- Valentijn et al. (1996) Valentijn E.A., van der Werf, P.P., de Graauw, T., & de Jong, T. 1996, A&A, 315, L145
- Vila-Vilaró et al. (1998) Vila-Vilaró, B., Taniguchi, Y., & Nakai, N. 1998, AJ, 116, 1553 (VV98)
- Voit (1992) Voit, G.M. 1992, MNRAS, 258, 841
- Welch & Sage (2003) Welch, G.A., & Sage, L.J. 2003, ApJ, 584, 260 (W03)
- Wiklind et al. (1995) Wiklind, T., Combes, F., & Henkel, C. 1995, A&A, 297, 643 (W95)
- Wilgenbus et al. (2000) Wilgenbus, D., Cabrit, S., Pineau des Forêts, G., & Flower, D.R. 2000, A&A, 356, 1010
- Wu et al. (2005) Wu, H., Cao, C., Hao, C.N., et al. 2005, ApJ, 632, L79
- Yao et al. (2003) Yao, L., Seaquist, E.R., Kuno, N., & Dunne, L. 2003, ApJ, 588, 771 (Y03)
- Young et al. (1995) Young, J.S., Xie, S., Tacconi, L., et al. 1995, ApJS, 98, 219 (Y95)
- Zhang et al. (1993) Zhang, X., Wright, M., & Alexander, P. 1993, ApJ, 418, 100
| transition | short | rest | spectral | Eu/k | A |
|---|---|---|---|---|---|
| v=0 | notation | (m) | order | (K) | (10-11 s-1) |
| J=2-0 | S(0) | 28.219 | LH 14 | 510 | 2.95 |
| J=3-1 | S(1) | 17.035 | SH 12 | 1015 | 47.6 |
| J=4-2 | S(2) | 12.279 | SH 17 | 1681 | 275. |
| J=5-3 | S(3) | 9.665 | SL 1 | 2503 | 980. |
| J=6-4 | S(4) | 8.025 | SL 1 | 3473 | 2640. |
| J=7-5 | S(5) | 6.910 | SL 2 | 4585 | 5880. |
| J=8-6 | S(6) | 6.109 | SL 2 | 5828 | 11400. |
| J=9-7 | S(7) | 5.511 | SL 2 | 7196 | 20000. |
| galaxy | D | class | center (J2000) | solid angle |
|---|---|---|---|---|
| (Mpc) | RA DEC | (arcsec2) | ||
| N24 | 8.2 | dwarf | 00 09 56.31 24 57 52.0 | 294. |
| N337 | 24.7 | nuc | 00 59 49.99 07 34 42.5 | 289. |
| N628 | 11.4 | nuc | 01 36 41.72 +15 46 59.4 | 300. |
| N855 | 9.6 | dwarf | 02 14 03.64 +27 52 40.6 | 288. |
| N925 | 10.1 | nuc | 02 27 17.06 +33 34 43.8 | 287. |
| N1097 | 16.9 | nuc | 02 46 18.77 30 16 30.0 | 809. |
| N1266 | 31.3 | liner | 03 16 00.68 02 25 38.8 | 287. |
| N1291 | 9.7 | liner | 03 17 18.50 41 06 27.7 | 287. |
| N1316 | 26.3 | liner | 03 22 41.61 37 12 28.7 | 287. |
| N1482 | 22.0 | nuc | 03 54 38.68 20 30 08.5 | 798. |
| N1512 | 10.4 | nuc | 04 03 53.96 43 20 55.6 | 831. |
| N1566 | 18.0 | sy | 04 20 00.53 54 56 17.4 | 306. |
| N1705 | 5.8 | dwarf | 04 54 13.26 53 21 39.2 | 802. |
| N2403 | 3.5 | nuc | 07 36 50.25 +65 36 04.6 | 287. |
| N2798 | 24.7 | nuc | 09 17 22.99 +42 00 00.8 | 293. |
| N2841 | 9.8 | liner | 09 22 02.75 +50 58 35.5 | 291. |
| N2915 | 2.7 | dwarf | 09 26 11.59 76 37 34.2 | 291. |
| N2976 | 3.5 | dwarf | 09 47 15.63 +67 55 00.3 | 289. |
| N3031 | 3.5 | sy | 09 55 33.50 +69 03 55.8 | 296. |
| N3049 | 19.6 | nuc | 09 54 49.66 +09 16 19.2 | 320. |
| N3184 | 8.6 | nuc | 10 18 17.03 +41 25 28.3 | 287. |
| N3190 | 17.4 | liner | 10 18 05.71 +21 49 56.8 | 304. |
| N3198 | 9.8 | nuc | 10 19 55.10 +45 32 59.6 | 287. |
| N3265 | 20.0 | nuc | 10 31 06.85 +28 47 49.1 | 301. |
| Mrk33 | 21.7 | dwarf | 10 32 32.02 +54 24 05.4 | 315. |
| N3351 | 9.3 | nuc | 10 43 57.83 +11 42 10.9 | 761. |
| N3521 | 9.0 | liner | 11 05 48.51 00 02 10.1 | 285. |
| N3621 | 6.2 | liner | 11 18 16.62 32 48 49.9 | 291. |
| N3627 | 8.9 | sy | 11 20 15.04 +12 59 31.0 | 301. |
| N3773 | 12.9 | dwarf | 11 38 12.91 +12 06 43.0 | 285. |
| N3938 | 12.2 | nuc | 11 52 49.45 +44 07 15.0 | 292. |
| N4125 | 21.4 | liner | 12 08 05.73 +65 10 27.9 | 294. |
| N4254 | 20.0 | nuc | 12 18 49.71 +14 25 01.4 | 299. |
| N4321 | 20.0 | nuc | 12 22 55.08 +15 49 18.2 | 795. |
| N4450 | 20.0 | liner | 12 28 29.51 +17 05 04.9 | 285. |
| N4536 | 25.0 | nuc | 12 34 27.22 +02 11 14.3 | 777. |
| N4552 | 20.0 | liner | 12 35 39.71 +12 33 21.9 | 285. |
| N4559 | 11.6 | nuc | 12 35 57.79 +27 57 36.7 | 295. |
| N4569 | 20.0 | liner | 12 36 49.91 +13 09 46.8 | 287. |
| N4579 | 20.0 | sy | 12 37 43.70 +11 49 07.1 | 295. |
| N4594 | 13.7 | liner | 12 39 59.58 11 37 22.3 | 289. |
| N4625 | 9.5 | dwarf | 12 41 52.65 +41 16 26.5 | 294. |
| N4631 | 9.0 | nuc | 12 42 07.84 +32 32 34.8 | 282. |
| N4725 | 17.1 | sy | 12 50 26.71 +25 30 03.2 | 294. |
| N4736 | 5.3 | liner | 12 50 53.23 +41 07 13.6 | 298. |
| N4826 | 5.6 | liner | 12 56 43.79 +21 41 00.7 | 292. |
| N5033 | 13.3 | sy | 13 13 27.67 +36 35 38.2 | 311. |
| N5055 | 8.2 | liner | 13 15 49.50 +42 01 46.6 | 313. |
| N5194 | 8.2 | sy | 13 29 52.94 +47 11 44.2 | 330. |
| N5194_AbbA total of 11 extranuclear regions were observed in high-resolution spectroscopy in NGC 5194, from which we included 7 in our sample. | 8.2 | hii | 13 29 49.54 +47 13 28.6 | 256. |
| N5194_BbbA total of 11 extranuclear regions were observed in high-resolution spectroscopy in NGC 5194, from which we included 7 in our sample. | 8.2 | hii | 13 30 01.69 +47 12 50.9 | 271. |
| N5194_CbbA total of 11 extranuclear regions were observed in high-resolution spectroscopy in NGC 5194, from which we included 7 in our sample. | 8.2 | hii | 13 30 00.02 +47 11 11.9 | 352. |
| N5194_DbbA total of 11 extranuclear regions were observed in high-resolution spectroscopy in NGC 5194, from which we included 7 in our sample. | 8.2 | hii | 13 30 02.76 +47 09 53.0 | 338. |
| N5194_EbbA total of 11 extranuclear regions were observed in high-resolution spectroscopy in NGC 5194, from which we included 7 in our sample. | 8.2 | hii | 13 29 56.84 +47 10 45.9 | 234. |
| N5194_FbbA total of 11 extranuclear regions were observed in high-resolution spectroscopy in NGC 5194, from which we included 7 in our sample. | 8.2 | hii | 13 29 52.93 +47 12 38.7 | 297. |
| N5194_GbbA total of 11 extranuclear regions were observed in high-resolution spectroscopy in NGC 5194, from which we included 7 in our sample. | 8.2 | hii | 13 29 43.99 +47 10 20.7 | 285. |
| N5195 | 8.2 | liner | 13 29 59.80 +47 16 00.1 | 323. |
| N5713 | 26.6 | nuc | 14 40 11.57 00 17 19.1 | 292. |
| N5866 | 12.5 | liner | 15 06 29.58 +55 45 46.7 | 286. |
| N6822_AccSeveral locations were observed in high-resolution spectroscopy in this galaxy. We present here results for three among the brightest regions at 7.9 and 24 m. N6822_A corresponds to the HII region Hubble V (Hubble, 1925), and N6822_C to the HII region K (Kinman et al., 1979). | 0.6 | dwarf | 19 44 52.84 14 43 09.8 | 308. |
| N6822_BccSeveral locations were observed in high-resolution spectroscopy in this galaxy. We present here results for three among the brightest regions at 7.9 and 24 m. N6822_A corresponds to the HII region Hubble V (Hubble, 1925), and N6822_C to the HII region K (Kinman et al., 1979). | 0.6 | dwarf | 19 44 50.57 14 52 49.0 | 288. |
| N6822_CccSeveral locations were observed in high-resolution spectroscopy in this galaxy. We present here results for three among the brightest regions at 7.9 and 24 m. N6822_A corresponds to the HII region Hubble V (Hubble, 1925), and N6822_C to the HII region K (Kinman et al., 1979). | 0.6 | dwarf | 19 44 48.67 14 52 26.5 | 304. |
| N6946 | 5.5 | nuc | 20 34 51.79 +60 09 12.6 | 803. |
| N7331 | 15.7 | liner | 22 37 04.11 +34 24 57.5 | 263. |
| N7552 | 22.3 | nuc | 23 16 10.56 42 35 04.0 | 722. |
| N7793 | 3.2 | dwarf | 23 57 49.79 32 35 28.4 | 296. |
| galaxy | S(0) | S(1) | S(2) | S(3) | [SiII] | F | F24 | TIR |
|---|---|---|---|---|---|---|---|---|
| (10-18 W m-2) | (Jy) | (Jy) | (10-15 W m-2) | |||||
| N24 | 0.010 | 0.010 | ||||||
| N337 | 0.048 | 0.087 | ||||||
| N628 | 0.026 | 0.026 | ||||||
| N855 | 0.017 | 0.039 | ||||||
| N925 | 0.021 | 0.022 | ||||||
| N1097 | 1.139 | 3.763 | ||||||
| N1266bbThe S(4) to S(7) line fluxes are respectively: , , and W m-2. The S(6) transition was not accurately measurable because it was observed at low spectral resolution on the blue shoulder of a bright 6.2 m aromatic band. | 0.048 | 0.579 | ||||||
| N1291 | 0.013 | 0.049 | ||||||
| N1316 | 0.025 | 0.094 | ||||||
| N1482 | 1.163 | 2.974 | ||||||
| N1512 | 0.091 | 0.150 | ||||||
| N1566 | 0.098 | 0.237 | ||||||
| N1705 | 0.007 | 0.028 | ||||||
| N2403 | 0.029 | 0.022 | ||||||
| N2798 | 0.354 | 1.723 | ||||||
| N2841 | 0.010 | 0.027 | ||||||
| N2915 | 0.005 | 0.019 | ||||||
| N2976 | 0.026 | 0.055 | ||||||
| N3031 | 0.081 | 0.337 | ||||||
| N3049 | 0.051 | 0.258 | ||||||
| N3184 | 0.031 | 0.082 | ||||||
| N3190 | 0.051 | 0.068 | ||||||
| N3198 | 0.059 | 0.260 | ||||||
| N3265 | 0.062 | 0.193 | ||||||
| Mrk33 | 0.076 | 0.583 | ||||||
| N3351 | 0.366 | 1.385 | ||||||
| N3521 | 0.101 | 0.106 | ||||||
| N3621 | 0.075 | 0.065 | ||||||
| N3627 | 0.190 | 0.406 | ||||||
| N3773 | 0.024 | 0.087 | ||||||
| N3938 | 0.027 | 0.030 | ||||||
| N4125 | 0.005 | 0.015 | ||||||
| N4254 | 0.160 | 0.203 | ||||||
| N4321 | 0.392 | 0.730 | ||||||
| N4450 | 0.011 | 0.028 | ||||||
| N4536 | 0.813 | 2.401 | ||||||
| N4552 | 0.004 | 0.017 | ||||||
| N4559 | 0.034 | 0.030 | ||||||
| N4569ccThe S(4) to S(7) line fluxes are respectively: , , and W m-2. The S(5) and S(6) transitions are upper limits because S(5) is contaminated by the [ArII] line at 6.985 m and S(6) is diluted in the blue shoulder of the 6.2 m aromatic band. | 0.128 | 0.475 | ||||||
| N4579ddThe S(4) to S(7) line fluxes are respectively: , , and W m-2. The same remark as for NGC 4569 applies. | 0.032 | 0.135 | ||||||
| N4594 | 0.017 | 0.068 | ||||||
| N4625 | 0.024 | 0.024 | ||||||
| N4631 | 0.338 | 0.661 | ||||||
| N4725 | 0.011 | 0.035 | ||||||
| N4736 | 0.293 | 0.636 | ||||||
| N4826 | 0.343 | 0.612 | ||||||
| N5033 | 0.177 | 0.239 | ||||||
| N5055 | 0.148 | 0.166 | ||||||
| N5194 | 0.168 | 0.291 | ||||||
| N5194_A | 0.030 | 0.036 | ||||||
| N5194_B | 0.094 | 0.193 | ||||||
| N5194_C | 0.079 | 0.115 | ||||||
| N5194_D | 0.058 | 0.118 | ||||||
| N5194_E | 0.072 | 0.089 | ||||||
| N5194_F | 0.075 | 0.110 | ||||||
| N5194_G | 0.093 | 0.192 | ||||||
| N5195 | 0.271 | 0.835 | ||||||
| N5713 | 0.268 | 0.738 | ||||||
| N5866 | 0.038 | 0.052 | ||||||
| N6822_A | 0.036 | 0.517 | ||||||
| N6822_B | 0.010 | 0.037 | ||||||
| N6822_C | 0.009 | 0.100 | ||||||
| N6946 | 1.314 | 4.234 | ||||||
| N7331 | 0.074 | 0.091 | ||||||
| N7552 | 1.495 | 7.840 | ||||||
| N7793 | 0.041 | 0.046 | ||||||
| galaxy | |||||||
|---|---|---|---|---|---|---|---|
| (K) | (K) | ( mol. cm-2) | |||||
| N24 | 97. | 0.99941 | 769. | 0.00059 | 4.232 | 1.75 | |
| 78. | 0.99980 | 675. | 0.00020 | 15.210 | 1.46 | ||
| 90. | 0.99971 | 888. | 0.00029 | 7.314 | 1.73 | ||
| N337 | 160. | 0.97793 | 402. | 0.02207 | 1.745 | 2.13 | |
| 128. | 0.97803 | 352. | 0.02197 | 3.218 | 0.97 | ||
| 165. | 0.98711 | 464. | 0.01289 | 1.824 | 2.19 | ||
| N628 | 119. | 0.99678 | 393. | 0.00322 | 3 | 2.598 | |
| N855 | 146. | 0.98750 | 578. | 0.01250 | 3 | 0.508 | |
| N925 | 123. | 0.99473 | 494. | 0.00527 | 3 | 1.050 | |
| 99. | 0.99648 | 421. | 0.00352 | 3 | 2.780 | ||
| N1097 | 157. | 0.98027 | 422. | 0.01973 | 11.837 | 1.29 | |
| 94. | 0.99033 | 335. | 0.00967 | 3 | 62.925 | ||
| N1266bbThe third component is characterized by K and (constrained- fit) or K and (free- fit). | 247. | 0.83691 | 400. | 0.15619 | 1.231 | 1.19 | |
| 204. | 0.82588 | 400. | 0.16935 | 1.594 | 0.84 | ||
| N1291 | 184. | 0.95420 | 484. | 0.04580 | 3 | 0.415 | |
| 141. | 0.95010 | 414. | 0.04990 | 3 | 0.762 | ||
| N1316 | 300. | 0.96436 | 1456. | 0.03564 | 3 | 0.114 | |
| 3 | 0.121 | ||||||
| N1482 | 171. | 0.96943 | 407. | 0.03057 | 5.098 | 1.38 | |
| 137. | 0.96699 | 357. | 0.03301 | 8.848 | 1.49 | ||
| 175. | 0.98252 | 469. | 0.01748 | 5.378 | 1.40 | ||
| N1512 | 138. | 0.98887 | 415. | 0.01113 | 3 | 1.883 | |
| 118. | 0.98955 | 375. | 0.01045 | 3 | 3.338 | ||
| N1566 | 177. | 0.96436 | 441. | 0.03564 | 2.749 | 1.19 | |
| 115. | 0.97305 | 359. | 0.02695 | 3 | 8.517 | ||
| N1705 | 127. | 0.99453 | 811. | 0.00547 | 0.494 | 3.78 | |
| 92. | 0.99844 | 711. | 0.00156 | 2.050 | 0.95 | ||
| 114. | 0.99727 | 936. | 0.00273 | 0.876 | 2.33 | ||
| N2403 | 109. | 0.99844 | 449. | 0.00156 | 3 | 2.486 | |
| 99. | 0.99873 | 419. | 0.00127 | 3 | 4.138 | ||
| N2798 | 179. | 0.96182 | 409. | 0.03818 | 5.169 | 1.32 | |
| 144. | 0.95518 | 359. | 0.04482 | 8.460 | 1.16 | ||
| 184. | 0.97812 | 472. | 0.02188 | 5.419 | 1.27 | ||
| N2841 | 137. | 0.99678 | 1030. | 0.00322 | 3 | 0.709 | |
| 132. | 0.99707 | 970. | 0.00293 | 3 | 0.844 | ||
| N2915 | 169. | 0.97090 | 763. | 0.02910 | 0.096 | 1.74 | |
| 116. | 0.98838 | 669. | 0.01162 | 0.305 | 0.55 | ||
| 151. | 0.98350 | 880. | 0.01650 | 0.150 | 1.13 | ||
| N2976 | 134. | 0.99199 | 376. | 0.00801 | 2.095 | 1.43 | |
| 86. | 0.99619 | 300. | 0.00381 | 3 | 12.046 | ||
| N3031 | 178. | 0.95908 | 523. | 0.04092 | 3 | 0.700 | |
| 126. | 0.96387 | 433. | 0.03613 | 3 | 1.699 | ||
| N3049 | 174. | 0.96611 | 403. | 0.03389 | 0.740 | 1.50 | |
| 141. | 0.96113 | 353. | 0.03887 | 1.238 | 1.17 | ||
| 179. | 0.98076 | 465. | 0.01924 | 0.773 | 1.55 | ||
| N3184 | 127. | 0.99502 | 440. | 0.00498 | 3 | 2.631 | |
| 118. | 0.99648 | 449. | 0.00352 | 3 | 3.805 | ||
| N3190 | 148. | 0.99355 | 574. | 0.00645 | 3 | 3.286 | |
| 142. | 0.99385 | 554. | 0.00615 | 3 | 3.883 | ||
| N3198 | 128. | 0.99316 | 415. | 0.00684 | 3 | 3.438 | |
| 111. | 0.99385 | 375. | 0.00615 | 3 | 6.283 | ||
| N3265 | 156. | 0.98105 | 408. | 0.01895 | 1.421 | 1.30 | |
| 95. | 0.98975 | 325. | 0.01025 | 3 | 7.006 | ||
| Mrk33 | 124. | 0.99736 | 624. | 0.00264 | 3 | 3.844 | |
| 115. | 0.99775 | 584. | 0.00225 | 3 | 5.478 | ||
| N3351 | 141. | 0.98633 | 437. | 0.01367 | 3 | 4.575 | |
| 114. | 0.98867 | 387. | 0.01133 | 3 | 9.893 | ||
| N3521 | 118. | 0.99531 | 414. | 0.00469 | 3 | 5.715 | |
| 91. | 0.99687 | 354. | 0.00313 | 3 | 18.837 | ||
| N3621 | 126. | 0.99541 | 532. | 0.00459 | 3 | 4.490 | |
| 110. | 0.99609 | 472. | 0.00391 | 3 | 8.195 | ||
| N3627 | 220. | 0.91836 | 433. | 0.08164 | 2.672 | 1.12 | |
| 124. | 0.90469 | 344. | 0.09531 | 3 | 7.324 | ||
| N3773 | 115. | 0.99678 | 480. | 0.00322 | 3 | 1.671 | |
| 90. | 0.99805 | 410. | 0.00195 | 3 | 5.446 | ||
| N3938 | 118. | 0.99629 | 425. | 0.00371 | 3 | 2.603 | |
| 102. | 0.99697 | 377. | 0.00303 | 3 | 5.116 | ||
| N4125 | 211. | 0.92803 | 481. | 0.07197 | 0.238 | 1.35 | |
| 163. | 0.91826 | 422. | 0.08174 | 0.377 | 1.15 | ||
| 212. | 0.95625 | 555. | 0.04375 | 0.262 | 1.35 | ||
| N4254 | 200. | 0.94111 | 384. | 0.05889 | 1.763 | 1.53 | |
| 167. | 0.90293 | 337. | 0.09707 | 2.368 | 1.14 | ||
| 206. | 0.96982 | 444. | 0.03018 | 1.812 | 1.45 | ||
| N4321 | 164. | 0.97480 | 427. | 0.02520 | 4.001 | 1.41 | |
| 131. | 0.97627 | 374. | 0.02373 | 7.511 | 1.27 | ||
| 168. | 0.98477 | 493. | 0.01523 | 4.258 | 1.46 | ||
| N4450 | 190. | 0.96992 | 536. | 0.03008 | 3 | 1.178 | |
| 172. | 0.96152 | 476. | 0.03848 | 3 | 1.467 | ||
| N4536 | 166. | 0.97344 | 413. | 0.02656 | 5.602 | 1.35 | |
| 133. | 0.97334 | 362. | 0.02666 | 10.170 | 1.35 | ||
| 170. | 0.98437 | 476. | 0.01563 | 5.908 | 1.40 | ||
| N4552 | 126. | 0.99463 | 986. | 0.00537 | 0.449 | 2.61 | |
| 89. | 0.99873 | 865. | 0.00127 | 2.156 | 0.54 | ||
| 108. | 0.99766 | 1138. | 0.00234 | 0.959 | 1.30 | ||
| N4559 | 111. | 0.99951 | 775. | 0.00049 | 3 | 6.202 | |
| 109. | 0.99961 | 825. | 0.00039 | 3 | 6.967 | ||
| N4569cc K and (constrained- fit), or K and (free- fit). | 184. | 0.91348 | 400. | 0.08564 | 3 | 4.062 | |
| 138. | 0.95226 | 400. | 0.04755 | 3 | 9.055 | ||
| N4579dd K and (constrained- fit), or K and (free- fit). | 286. | 0.55439 | 400. | 0.43999 | 0.534 | 1.00 | |
| 68. | 0.98551 | 400. | 0.01439 | 3 | 21.592 | ||
| N4594 | 175. | 0.96621 | 441. | 0.03379 | 0.232 | 1.57 | |
| 138. | 0.96709 | 387. | 0.03291 | 0.421 | 1.06 | ||
| 178. | 0.97969 | 509. | 0.02031 | 0.251 | 1.64 | ||
| N4625 | 133. | 0.99268 | 411. | 0.00732 | 1.856 | 1.85 | |
| 107. | 0.99453 | 361. | 0.00547 | 4.144 | 1.20 | ||
| 136. | 0.99551 | 475. | 0.00449 | 1.964 | 2.38 | ||
| N4631 | 154. | 0.98174 | 386. | 0.01826 | 9.852 | 1.75 | |
| 125. | 0.98174 | 338. | 0.01826 | 18.343 | 0.96 | ||
| 159. | 0.98955 | 445. | 0.01045 | 10.160 | 2.01 | ||
| N4725 | 155. | 0.98223 | 481. | 0.01777 | 1.814 | 1.31 | |
| 88. | 0.99482 | 381. | 0.00518 | 3 | 13.562 | ||
| N4736 | 180. | 0.96455 | 478. | 0.03545 | 3 | 3.822 | |
| 151. | 0.95732 | 418. | 0.04268 | 3 | 5.791 | ||
| N4826 | 176. | 0.96523 | 426. | 0.03477 | 8.766 | 1.27 | |
| 72. | 0.99570 | 328. | 0.00430 | 3 | 223.50 | ||
| N5033 | 157. | 0.97900 | 438. | 0.02100 | 3 | 5.255 | |
| 134. | 0.97920 | 398. | 0.02080 | 3 | 8.435 | ||
| N5055 | 142. | 0.98242 | 386. | 0.01758 | 3 | 7.586 | |
| 114. | 0.98506 | 346. | 0.01494 | 3 | 16.336 | ||
| N5194 | 180. | 0.95732 | 521. | 0.04268 | 3 | 1.753 | |
| 127. | 0.96123 | 431. | 0.03877 | 3 | 4.171 | ||
| N5194_A | 133. | 0.98672 | 349. | 0.01328 | 3 | 1.469 | |
| 111. | 0.98848 | 319. | 0.01152 | 3 | 2.951 | ||
| N5194_B | 128. | 0.99150 | 373. | 0.00850 | 3 | 4.933 | |
| 109. | 0.99287 | 343. | 0.00713 | 3 | 9.421 | ||
| N5194_C | 120. | 0.99873 | 458. | 0.00127 | 3 | 6.824 | |
| 118. | 0.99873 | 448. | 0.00127 | 3 | 7.448 | ||
| N5194_D | 123. | 0.99824 | 429. | 0.00176 | 3 | 4.144 | |
| 121. | 0.99824 | 419. | 0.00176 | 3 | 4.572 | ||
| N5194_E | 142. | 0.98896 | 406. | 0.01104 | 5.653 | 1.44 | |
| 63. | 0.99922 | 313. | 0.00078 | 3 | 235.5 | ||
| N5194_F | 137. | 0.99102 | 417. | 0.00898 | 4.127 | 1.37 | |
| 85. | 0.99648 | 331. | 0.00352 | 3 | 26.208 | ||
| N5194_G | 148. | 0.98594 | 418. | 0.01406 | 4.041 | 1.53 | |
| 118. | 0.98857 | 367. | 0.01143 | 8.457 | 1.21 | ||
| 151. | 0.99160 | 483. | 0.00840 | 4.337 | 1.74 | ||
| N5195 | 164. | 0.97441 | 468. | 0.02559 | 3 | 6.769 | |
| 134. | 0.97305 | 408. | 0.02695 | 3 | 11.899 | ||
| N5713 | 162. | 0.97266 | 413. | 0.02734 | 3 | 3.901 | |
| 133. | 0.96875 | 363. | 0.03125 | 3 | 6.684 | ||
| N5866 | 194. | 0.94678 | 393. | 0.05322 | 1.676 | 1.33 | |
| 160. | 0.92070 | 344. | 0.07930 | 2.379 | 1.10 | ||
| 200. | 0.97158 | 453. | 0.02842 | 1.731 | 1.25 | ||
| N6822_A | 158. | 0.98027 | 504. | 0.01973 | 1.094 | 1.56 | |
| 120. | 0.98721 | 442. | 0.01279 | 2.561 | 1.31 | ||
| 156. | 0.98799 | 581. | 0.01201 | 1.306 | 1.76 | ||
| N6822_B | 140. | 0.99043 | 476. | 0.00957 | 1.609 | 1.82 | |
| 109. | 0.99404 | 417. | 0.00596 | 3.946 | 1.30 | ||
| 139. | 0.99414 | 549. | 0.00586 | 1.867 | 2.00 | ||
| N6822_C | 148. | 0.98604 | 478. | 0.01396 | 0.716 | 1.77 | |
| 115. | 0.99092 | 419. | 0.00908 | 1.690 | 1.04 | ||
| 148. | 0.99150 | 552. | 0.00850 | 0.830 | 2.19 | ||
| N6946 | 156. | 0.98066 | 399. | 0.01934 | 13.119 | 1.46 | |
| 126. | 0.98105 | 350. | 0.01895 | 24.494 | 1.09 | ||
| 161. | 0.98857 | 461. | 0.01143 | 13.603 | 1.62 | ||
| N7331 | 136. | 0.99043 | 401. | 0.00957 | 3 | 3.976 | |
| 118. | 0.99023 | 361. | 0.00977 | 3 | 6.658 | ||
| N7552 | 144. | 0.98818 | 418. | 0.01182 | 20.019 | 1.43 | |
| 115. | 0.99053 | 367. | 0.00947 | 42.249 | 1.12 | ||
| 147. | 0.99277 | 483. | 0.00723 | 21.235 | 1.67 | ||
| N7793 | 176. | 0.96455 | 381. | 0.03545 | 0.869 | 2.29 | |
| 144. | 0.95400 | 334. | 0.04600 | 1.368 | 1.50 | ||
| 181. | 0.98096 | 440. | 0.01904 | 0.900 | 2.62 |
| galaxy | (cold H2) | CO beam | corr. | map | ref CO | ||
|---|---|---|---|---|---|---|---|
| ( M☉) | ( mol. cm-2) | (arcsec2) | |||||
| N24 | 3.13 | ||||||
| N337 | 11.61 | 9.4 | 0.18 | 1521. | 1.52 | IRAC | E96 |
| N628 | 3.79 | 10.5 | 0.25 | 627. | 1.04 | BIMA | S05 (B93, Y95) |
| N855 | 0.50 | 2.3 | 0.22 | 415. | 1.24 | IRAC | W95 |
| N925 | 1.15 | 386. | S05 | ||||
| N1097 | 103.01 | 183. | 0.06 | 1590. | 1.74 | IRAC | Y95 (VV98, H93, K03) |
| N1266 | 12.97 | ||||||
| N1291 | 0.42 | 11.7 | 0.04 | 1452. | 2.33 | IRAC | T91 |
| N1316 | 0.85 | 19.9 | 0.006 | 1452. | 2.55 | IRAC | H01 |
| N1482 | 73.91 | 136. | 0.04 | 1521. | 1.76 | IRAC | E96 |
| N1512 | 6.34 | ||||||
| N1566 | 10.22 | ||||||
| N1705 | 0.50 | ||||||
| N2403 | 0.33 | 23.8 | 0.10 | 855. | 0.96 | BIMA | E96 |
| N2798 | 34.54 | 46.5 | 0.11 | 855. | 2.50 | IRAC | E96 |
| N2841 | 0.74 | 370. | S05 | ||||
| N2915 | 0.0077 | 1452. | 2.04 | IRAC | A04 | ||
| N2976 | 0.28 | 10.6 | 0.20 | 452. | 1.12 | BIMA | A04 (I05, Y95) |
| N3031 | 0.10 | 3068. | S05 | ||||
| N3049 | 3.39 | 31.3 | 0.02 | 573. | 1.48 | IRAC | C97 |
| N3184 | 2.09 | 40.1 | 0.07 | 441. | 1.23 | BIMA | S05 (Y95, S93) |
| N3190 | 11.33 | 37.8 | 0.09 | 380. | 1.14 | IRAC | L98 |
| N3198 | 3.54 | 33.1 | 0.10 | 415. | 1.31 | IRAC | B93 |
| N3265 | 6.45 | 25.8 | 0.06 | 227. | 0.76 | IRAC | G91 |
| Mrk33bbMrk 33: The H2 mass fraction in the warm phase may be severely overestimated in this blue compact galaxy, because of the use of an inappropriate factor to convert CO flux to total H2 mass. Israel (2005) derive a factor about four times higher than the standard factor used here, which would make the total H2 mass also four times higher. NGC 6822_A: In their detailed study of this region, Israel et al. (2003) derive a CO flux to total H2 mass conversion factor twenty times higher than the standard factor, so that the same remark as for Mrk 33 applies. | 21.35 | 16.5 | 0.23 | 380. | 1.15 | IRAC | S92 (A04) |
| N3351 | 11.30 | 95.1 | 0.05 | 606. | 0.85 | BIMA | P97 (S05) |
| N3521 | 4.95 | 26.1 | 0.22 | 201. | 0.68 | BIMA | N01 (Y95) |
| N3621 | 1.88 | ||||||
| N3627 | 2.39 | 196. | 0.01 | 271. | 0.95 | BIMA | S05 (Y95) |
| N3773 | 2.98 | 2376. | 5.83 | IRAC | L05 | ||
| N3938 | 4.23 | 26.4 | 0.10 | 262. | 0.96 | BIMA | S05 (Y95) |
| N4125 | 1.20 | 6.5 | 0.04 | 415. | 1.13 | IRAC | W95 |
| N4254 | 7.86 | 81.8 | 0.02 | 201. | 0.75 | S99 | N01 (K88) |
| N4321 | 47.83 | 133. | 0.03 | 415. | 0.74 | BIMA | B93 (S05, K96, H93) |
| N4450 | 5.04 | 16.4 | 0.07 | 131. | 0.90 | BIMA | S05 |
| N4536 | 102.41 | 50.2 | 0.11 | 855. | 1.08 | S03 | E96 |
| N4552 | 1.91 | ||||||
| N4559ccNGC 4559 has the highest mass fraction in the warm phase, even when constraining to be near-maximal. The warm phase is dominated by gas at K. NGC 4559 is a quiescent galaxy, as obvious from the low flux density ratio within the IRS aperture. The galaxy has little molecular gas, and it is possible that it is mostly diffuse, and thus more exposed to FUV radiation. The same remarks may apply, to a lesser degree, to other galaxies of the sample such as NGC 628. | 9.29 | 13.9 | 0.45 | 355. | 0.98 | BIMA | S05 |
| N4569 | 17.48 | 200. | 0.02 | 118. | 0.73 | BIMA | S05 (N01, K88, H93) |
| N4579 | 2.36 | 36.7 | 0.01 | 118. | 0.42 | BIMA | S05 (K88) |
| N4594 | 0.47 | 346. | B91 | ||||
| N4625 | 1.85 | 9.2 | 0.20 | 452. | 1.10 | IRAC | A04 (B03) |
| N4631 | 8.44 | 96.2 | 0.10 | 1590. | 1.76 | IRAC | Y95 |
| N4725 | 5.85 | 210. | S05 | ||||
| N4736 | 1.20 | 81.3 | 0.05 | 767. | 1.37 | BIMA | S05 (S98, Y95) |
| N4826 | 3.00 | 250. | 0.04 | 1337. | 1.81 | BIMA | S05 (N01, Y95) |
| N5033 | 10.86 | 96.0 | 0.05 | 855. | 1.39 | BIMA | C01 (S05, N01, E96, A95) |
| N5055 | 5.98 | 122. | 0.06 | 645. | 1.23 | BIMA | S05 (M99, E96, A95, Y95, S93) |
| N5194 | 1.46 | 40.0 | 0.04 | 474. | 0.98 | BIMA | S05 |
| N5194_A | 0.95 | ||||||
| N5194_B | 3.37 | ||||||
| N5194_C | 6.07 | ||||||
| N5194_D | 3.53 | ||||||
| N5194_E | 3.33 | ||||||
| N5194_F | 3.07 | ||||||
| N5194_G | 2.91 | ||||||
| N5195 | 5.51 | 110. | 0.06 | 177. | 0.58 | IRAC | K02 (S89) |
| N5713 | 30.27 | 50.8 | 0.08 | 1590. | 2.01 | IRAC | Y95 (Y03) |
| N5866 | 2.80 | 50.9 | 0.03 | 346. | 1.02 | IRAC | W03 (T94) |
| N6822_AbbMrk 33: The H2 mass fraction in the warm phase may be severely overestimated in this blue compact galaxy, because of the use of an inappropriate factor to convert CO flux to total H2 mass. Israel (2005) derive a factor about four times higher than the standard factor used here, which would make the total H2 mass also four times higher. NGC 6822_A: In their detailed study of this region, Israel et al. (2003) derive a CO flux to total H2 mass conversion factor twenty times higher than the standard factor, so that the same remark as for Mrk 33 applies. | 0.0047 | 7.8 | 0.14 | 415. | 1.26 | IRAC | I03 |
| N6822_B | 0.0062 | ||||||
| N6822_C | 0.0030 | ||||||
| N6946 | 11.95 | 486. | 0.03 | 816. | 0.95 | BIMA | S05 |
| N7331 | 9.69 | 56.0 | 0.07 | 346. | 0.94 | BIMA | I99 (N01) |
| N7552 | 269.01 | 171. | 0.12 | 1452. | 1.86 | IRAC | A95 (C92) |
| N7793 | 0.10 | 25.4 | 0.03 | 1452. | 1.87 | IRAC | I95 |
| galaxy | ref | noteaa1: Quantity given directly in the cited paper
(abbreviated notation as in the list of references).
2: Quantity computed as in Ho et al. (2001) (HF01) from counts in the 0.2-8 keV band. |
|
|---|---|---|---|
| (10-17 W m-2) | |||
| N628 | 0.59 | K05 | 2 |
| N1097 | 173. | N06 | 1 |
| N1291 | 7.45 | K05 | 2 |
| N1316 | 10.1 | KF03 | 2 |
| N2841 | 1.06 | HF01 | 1 |
| N3031 | 1020. | HF01 | 1 |
| N3184 | 1.12 | K05 | 2 |
| N3627 | HF01 | 1 | |
| N4125 | 1.07 | S04 | 1 |
| N4321 | HF01 | 1 | |
| N4552 | 12.1 | SD05 | 1 |
| N4569 | 7.61 | HF01 | 1 |
| N4579 | 264. | HF01 | 1 |
| N4594 | 120. | HF01 | 1 |
| N4725 | 7.15 | HF01 | 1 |
| N4736 | 27.4 | SD05 | 1 |
| N4826 | HF01 | 1 | |
| N5033 | 123. | HF01 | 1 |
| N5194 | 1300. | S04 | 1 |
| N5195 | 4.45 | K05 | 2 |
| N5866 | 0.18 | SD05 | 1 |
| N7331 | 2.28 | S04 | 1 |