119–126
Why are accreting T Tauri stars less luminous in X-rays than non-accretors?
Abstract
Accreting T Tauri stars are observed to be less luminous in X-rays than non-accretors, an effect that has been detected in various star forming regions. To explain this we have combined, for the first time, a radiative transfer code with an accretion model that considers magnetic fields extrapolated from surface magnetograms obtained from Zeeman-Doppler imaging. Such fields consist of compact magnetic regions close to the stellar surface, with extended field lines interacting with the disk. We study the propagation of coronal X-rays through the magnetosphere and demonstrate that they are strongly absorbed by the dense gas in accretion columns.
keywords:
radiative transfer, stars: coronae, stars: magnetic fields, stars: pre–main-sequence, stars: activity, stars: formation, X-rays: stars1 Introduction
Accreting T Tauri stars are observed to be less luminous in X-rays than non-accretors ([Stelzer & Neuhäuser (2001), Stelzer & Neuhäuser 2001]; [Flaccomio, Micela & Sciortino (2003a), Flaccomio, Micela & Sciortino 2003a]; [Flaccomio, Damiani, Micela, et al. (2003c), Flaccomio, Damiani, Micela, et al. 2003c]; [Stassun, Ardila, Barsony, et al. (2004), Stassun, Ardila, Barsony, et al. 2004]; [Preibisch, Kim, Favata, et al. (2005), Preibisch, Kim, Favata, et al. 2005]; [Flaccomio, Micela & Sciortino (2006), Flaccomio, Micela & Sciortino 2006]; [Telleschi, Güdel, Briggs, et al. (2007a), Telleschi, Güdel, Briggs, et al. 2007a]). Accreting stars appear to be a factor of less luminous, and show a larger variation in their X-ray activity compared to non-accreting stars ([Preibisch, Kim, Favata, et al. (2005), Preibisch et al. 2005]). However, it is only in recent years that this result has become clear, with previous studies showing conflicting results (e.g. [Feigelson, Gaffney, Garmire, et al. (2003)] and [Flaccomio, Damiani, Micela, et al. (2003b)]). The apparent discrepancy arose from whether stars were classified as accreting based on the detection of excess IR emission (a disk indicator) or the detection of accretion related emission lines. However, with careful re-analysis of archival data ([Flaccomio, Micela & Sciortino (2003a), Flaccomio et al. 2003a]) and recent large X-ray surveys like the Chandra Orion Ultradeep Project (COUP; [Getman, Flaccomio, Broos, et al. (2005), Getman, Flaccomio, Broos, et al. 2005]) and the XMM-Newton Extended Survey of the Taurus Molecular Cloud (XEST; [Güdel, Briggs, Arzner, et al. (2007a), Güdel, Briggs, Arzner, et al. 2007a]) the result is now clear, namely that accreting T Tauri stars are observed to be, on average, less luminous in X-rays than non-accreting stars. Although the difference is small it has been found consistently in various star forming regions: Taurus-Auriga ([Stelzer & Neuhäuser (2001), Stelzer & Neuhäuser 2001]; [Telleschi, Güdel, Briggs, et al. (2007a), Telleschi et al. 2007a]), the Orion Nebula Cluster ([Flaccomio, Damiani, Micela, et al. (2003c), Flaccomio et al. 2003c]; [Stassun, Ardila, Barsony, et al. (2004), Stassun et al. 2004]; [Preibisch, Kim, Favata, et al. (2005), Preibisch et al. 2005]), NGC 2264 ([Flaccomio, Micela & Sciortino (2003a), Flaccomio, Micela & Sciortino (2006), Flaccomio et al. 2003a, 2006]) and Chamaeleon I ([Flaccomio, Micela & Sciortino (2003a), Flaccomio et al. 2003a]).
It should be noted, however, that such observations from CCD detectors are not very sensitive to X-rays that are produced in accretion shocks. High resolution X-ray spectroscopic measurements have indicated emission from cool and high density plasma, most likely associated with accretion hot spots, in several (but not all) accreting stars (e.g. [Telleschi, Güdel, Briggs, et al. (2007b), Telleschi, Güdel, Briggs, et al. 2007b]; [Günther, Schmitt, Robrade, et al. (2007), Günther, Schmitt, Robrade, et al. 2007]). In this work we only consider coronal X-ray emission such as is detected by CCD measurements.
It is not yet understood why accreting stars are under luminous in X-rays, although a few ideas have been put forward. It may be related to higher extinction due to X-ray absorption by circumstellar disks, however the COUP results do not support this suggestion ([Preibisch, Kim, Favata, et al. (2005), Preibisch et al. 2005]). It may be related to magnetic braking, whereby the interaction between the magnetic field of an accreting star with its disk slows the stellar rotation rate leading to a weaker dynamo action and therefore less X-ray emission; although the lack of any rotation-activity relation for T Tauri stars has ruled out this idea ([Flaccomio, Damiani, Micela, et al. (2003c), Flaccomio et al. 2003c]; [Preibisch, Kim, Favata, et al. (2005), Preibisch et al. 2005]; [Briggs, Güdel, Telleschi, et al. (2007), Briggs, Güdel, Telleschi, et al. 2007]). A third suggestion is that accretion may alter the stellar structure affecting the magnetic field generation process and therefore X-ray emission ([Preibisch, Kim, Favata, et al. (2005), Preibisch et al. 2005]). However, the most plausible suggestion is the attenuation of coronal X-rays by the dense gas in accretion columns ([Flaccomio, Damiani, Micela, et al. (2003c), Flaccomio et al. 2003c]; [Stassun, Ardila, Barsony, et al. (2004), Stassun et al. 2004]; [Preibisch, Kim, Favata, et al. (2005), Preibisch et al. 2005]; [Güdel, Telleschi, Audard, et al. (2007b), Güdel, Telleschi, Audard, et al. 2007b]). X-rays from the underlying corona may not be able to heat the material within accretion columns to a high enough temperature to emit in X-rays. Field lines which have been mass-loaded with dense disk material may obscure the line-of-sight to the star at some rotation phases, reducing the observed X-ray emission. Here we demonstrate this in a quantitative way by developing an accretion flow model and simulating the propagation of coronal X-rays through the stellar magnetosphere.
2 Realistic Magnetic Fields
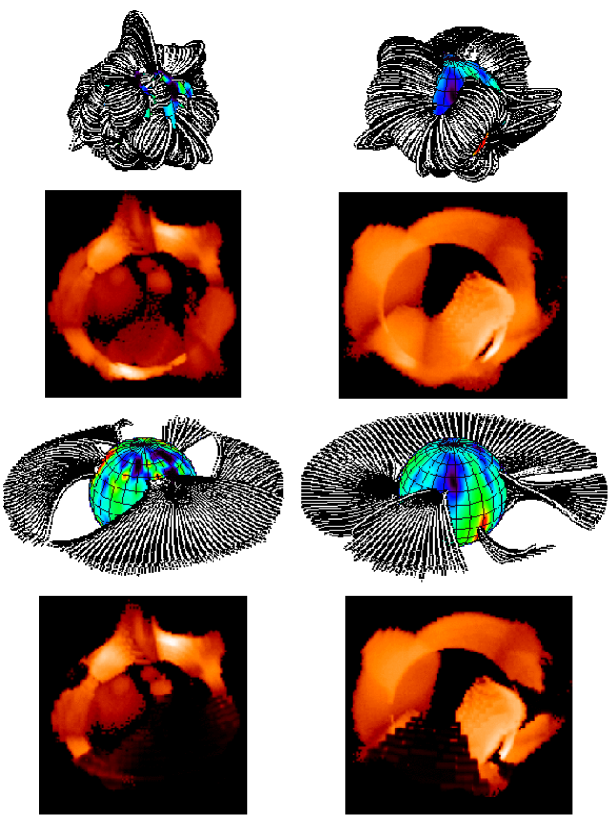
In order to model the coronae of T Tauri stars we need to assume something about the form of the magnetic field. Observations suggest it is compact and inhomogeneous and may vary not only with time on each star, but also from one star to the next. To capture this behaviour, we use as examples the field structures of two different main sequence stars, LQ Hya and AB Dor determined from Zeeman-Doppler imaging ([Donati, Cameron, Semel, et al. (2003), Donati, Cameron, Semel, et al. 2003]). Although we cannot be certain whether or not the magnetic field structures extrapolated from surface magnetograms of young main sequence stars do represent the magnetically confined coronae of T Tauri stars, they do satisfy the currently available observational constraints. In future it will be possible to use real T Tauri magnetograms derived from Zeeman-Doppler images obtained using the ESPaDOnS instrument at the Canada-France-Hawaii telescope ([Donati, Jardine, Gregory, et al. (2007), Donati, Jardine, Gregory, et al. 2007]). However, in the meantime, the example field geometries used in this work (see Fig. 1) capture the essential features of T Tauri coronae. They reproduce X-ray emission measures (EMs) and coronal densities which are typical of T Tauri stars ([Jardine, Cameron, Donati, et al. (2006), Jardine, Cameron, Donati, et al. 2006]). The surface field structures are complex, consistent with polarisation measurements ([Valenti & Johns-Krull (2004), Valenti & Johns-Krull 2004]) and X-ray emitting plasma is confined within unevenly distributed magnetic structures close to the stellar surface, giving rise to significant rotational modulation of X-ray emission ([Gregory, Jardine, Cameron, et al. (2006b), Gregory, Jardine, Cameron, et al. 2006b]).
2.1 The coronal field
For a given surface magnetogram we calculate the extent of the closed corona for a specified set of stellar parameters. We extrapolate from surface magnetograms by assuming that the magnetic field is potential such that . This process is described in detail by [Jardine, Cameron, Donati, et al. (2006), Jardine et al. (2006)], [Gregory, Jardine, Simpson, et al. (2006a), Gregory, Jardine, Simpson, et al. (2006a)] and [Gregory, Jardine, Cameron, et al. (2006b), Gregory et al. (2006b)]. We assume that the corona is isothermal and that plasma along field line loops is in hydrostatic equilibrium. The pressure is calculated along the path of field line loops and is set to zero for open field lines and for field lines where, at some point along the loop, the gas pressure exceeds the magnetic pressure. The pressure along a field line scales with the pressure at its foot point, and we assume that this scales with the magnetic pressure. This technique has been used successfully to calculate mean coronal densities and X-ray EMs for the Sun and other main sequence stars ([Jardine, Wood, Cameron, et al. (2002), Jardine, Wood, Cameron, et al. 2002]) as well as T Tauri stars ([Jardine, Cameron, Donati, et al. (2006), Jardine et al. 2006]). The AB Dor-like coronal field has an X-ray EM111The X-ray EM is given by where and are the coronal density and volume. The EM-weighted density is . of (without considering accretion) and a mean EM-weighted coronal density of , consistent with estimates from the modelling of individual flares ([Favata, Flaccomio, Reale, et al. (2005), Favata, Flaccomio, Reale, et al. 2005]). The LQ Hya-like field has a more extended corona and consequently a lower coronal density and EM, .
2.2 The accreting field
We assume that the structure of the magnetic field remains undistorted by the in-falling material and that the magnetosphere rotates as a solid body. The accreting field geometries shown in Fig. 1 are therefore only snap-shots in time, and in reality will evolve due to the interaction with the disk. The question of where the disk is truncated remains a major problem for accretion models. It is still unknown if the disk is truncated in the vicinity of the corotation radius, the assumption of traditional accretion models (e.g. [Königl (1991), Königl 1991]), or whether it extends closer to the stellar surface (e.g. [Matt & Pudritz (2005), Matt & Pudritz 2005]). In this work we assume that accretion occurs over a range of radii within the corotation radius. This is equivalent to the approach taken previously by e.g. [Muzerolle, Calvet & Hartmann (2001)] who have demonstrated that such an assumption reproduces observed spectral line profiles and variability. The accretion filling factors are of order , consistent with observationally inferred values (e.g. [Valenti & Johns-Krull (2004), Valenti & Johns-Krull 2004]).
We assume that material is supplied by the disk and accretes onto the star at a constant rate. For a dipolar magnetic field accretion flows impact the stellar surface in two rings in opposite hemispheres centred on the poles. In this case, half of the mass supplied by the disk accretes into each hemisphere. For complex magnetic fields accretion occurs into discrete hot spots distributed in latitude and longitude ([Gregory, Jardine, Simpson, et al. (2006a), Gregory et al. 2006a]). It is therefore not clear how much of the available mass from the disk accretes into each hot spot. We use a spherical grid and assume that each grid cell within the disk which is accreting supplies a mass accretion rate that is proportional to its surface area. If an accreting grid cell has a surface area that is of the total area of all accreting grid cells, then this grid cell is assumed to carry of the total mass that is supplied by the disk. Therefore, as an example, if grid cells which constitute half of the total area of all accreting cells in the disk carry material into a single hot spot, then half of the mass accretion rate is carried from the disk to this hot spot. In this way the accretion rate into each hot spot is different and depends on the structure of the magnetic field connecting the star to the disk.
2.3 Accretion flow model
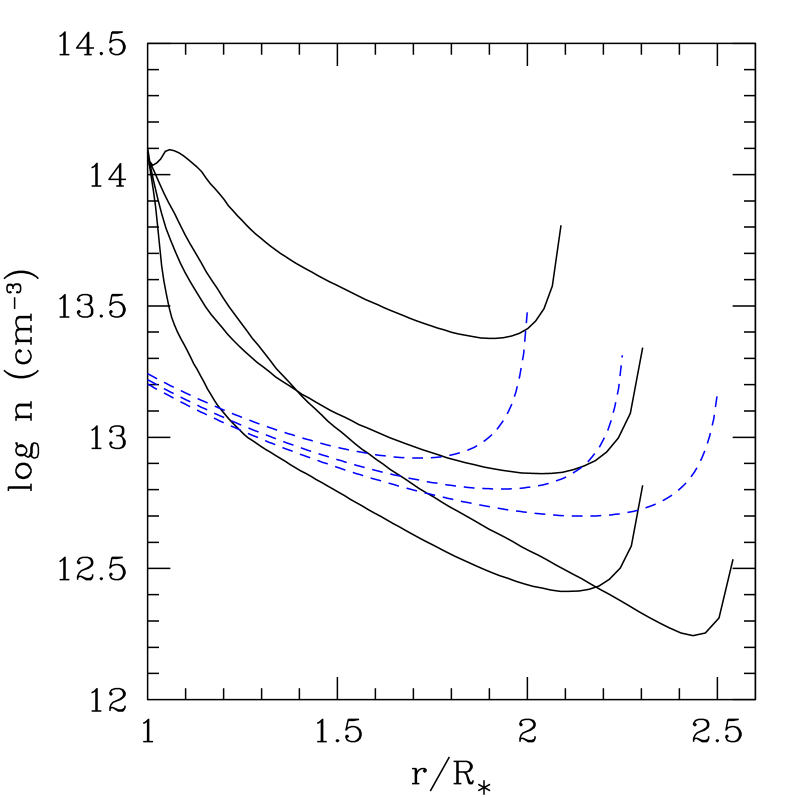
We consider a star of mass , radius , rotation period , a coronal temperature of and assume that the disk supplies a mass accretion rate of . In order to model the propagation of coronal X-rays through the magnetosphere we first need to determine the density of gas within accretion columns. [Gregory, Wood & Jardine (2007), Gregory, Wood & Jardine (2007)] develop a steady state accretion flow model where material accretes from a range of radii within corotation, free-falling along the field lines under gravity. The resulting density profiles do not depend on the absolute field strength, but instead on how the field strength varies with height above the star. The density profiles are typically steeper than those derived for accretion flows along dipolar field lines since the strength of a higher order field drops faster with height above the star. Fig. 2 shows the variation of the number density along the paths of a selection of accreting field lines, with those obtained for dipolar field lines shown for comparison ([Gregory, Wood & Jardine (2007), Gregory et al. 2007]). For our assumed accretion rate of the flow densities range from , whilst for a lower accretion rate of the range is .
3 Simulated X-Ray Variability
We model the propagation of coronal X-rays through the magnetosphere by considering absorption by the dense gas within accretion columns. For the radiation transfer we use Monte Carlo techniques and discretise the emissivity and density onto a spherical polar grid (e.g. [Jardine, Wood, Cameron, et al. (2002), Jardine et al. 2002]; [Whitney, Wood, Bjorkman, et al. (2003), Whitney, Wood, Bjorkman, et al. 2003]). The stellar inclination is set to and we assume the X-ray emission from the corona is optically thin, but that the X-rays may be subsequently absorbed in the cool and hence optically thick accretion columns. For the X-ray absorptive opacity we adopt a value of , typical of neutral gas at temperatures below at X-ray energies of a few keV (e.g. [Krolik & Kallman (1984), Krolik & Kallman 1984]). At these energies the opacity of hot gas (above ) is several orders of magnitude lower (e.g. [Krolik & Kallman (1984), Krolik & Kallman 1984], their Fig. 1) justifying our assumption that the coronal X-ray emission is optically thin.
In the Monte Carlo X-ray radiation transfer simulations we assume the scattering opacity is negligible, so our results in Fig. 1 show the effects of attenuation of the coronal emission by the accretion columns. The second row in Fig. 1 shows the X-ray images in the absence of attenuation (i.e. X-ray opacity in the accretion columns is set to zero) whilst the fourth row shows the same X-ray emission models, but with our adopted value for the soft X-ray opacity in the accretion columns. The observed X-ray EM is reduced by a factor of 1.4 (2.0) for the AB Dor-like (LQ Hya-like) field when accretion flows are considered, where the reduction factor is the average for an entire rotation cycle. For the AB Dor-like field there are large accretion curtains which cross the observers line-of-sight to the star as it rotates (see Fig. 1). For the LQ Hya-like field accretion is predominantly along field lines which carry material into low latitude hot spots, however, one of the brightest X-ray emitting regions is obscured by an accretion column which attenuates the coronal X-rays and produces a large reduction in the observed X-ray emission. This immediately suggests that the geometry of the accreting field is a contributory factor in causing the large scatter seen in the X-ray luminosities of accreting stars.
4 Summary
We have demonstrated that the suppression of X-ray emission in accreting stars apparent from CCD observations can, at least in part, be explained by the attenuation of coronal X-rays by the dense material in accretion columns. This suggests that both accreting and non-accreting stars have the same intrinsic X-ray luminosity, with accreting T Tauri stars being observed to be less luminous due to the effects of absorbing gas in accretion columns. The reduction in the observed X-ray emission depends on the structure of the accreting field. For stars where accretion columns rotate across the line-of-sight, X-rays from the underlying corona are strongly absorbed by the accreting gas which reduces the observed X-ray emission. A preliminary calculation indicates that the column densities from our simulations are large enough that the softer (cooler) coronal spectral components may be substantially, if not completely, absorbed by the accreting gas. The effect is greater the larger the accretion rate. Indeed [Güdel, Telleschi, Audard, et al. (2007b), Güdel et al. (2007b)] have recently found that stars in XEST which have the largest accretion rates (and are driving jets) show a highly absorbed coronal spectral component, which is attributed to attenuation by accreting gas. This however does not rule out the fact that other mechanisms may also be responsible for reducing the X-ray emission in accreting stars. [Jardine, Cameron, Donati, et al. (2006), Jardine et al. (2006)] have demonstrated that some stars (typically those of lower mass) have their outer coronae stripped away via the interaction with a disk. This also reduces the observed X-ray emission and this effect, combined with the radiative transfer calculations presented here, is likely to lead to a larger reduction in the observed X-ray emission. This would reduce the number of field lines which could be filled with coronal gas, such as is also suggested by [Preibisch, Kim, Favata, et al. (2005), Preibisch et al. (2005)] and [Telleschi, Güdel, Briggs, et al. (2007a), Telleschi et al. (2007a)], with the observed X-ray emission being further reduced due to obscuration by the accreting gas.
References
- [Briggs, Güdel, Telleschi, et al. (2007)] Briggs, K.R., Güdel, M., Telleschi, A., Preibisch, T., Stelzer, B., Bouvier, J., Rebull, L., Audard, M., Scelsi, L., Micela, G., Grosso, N., Palla, F. 2007, A&A 468, 413
- [Donati, Jardine, Gregory, et al. (2007)] Donati, J.-F., Jardine, M., Gregory, S.G., Petit, P., Bouvier, J., Dougados, C., Ménard, F., Cameron, A.C., Harries, T.J., Jeffers, S.V., Paletou, F. 2007, MNRAS submitted
- [Donati, Cameron, Semel, et al. (2003)] Donati, J.-F., Cameron, A.C., Semel, M., Hussain, G.A.J., Petit, P., Carter, B.D., Marsden, S.C., Mengel, M., López Ariste, A., Jeffers, S.V., Rees, D.E. 2003, MNRAS 345, 1145
- [Favata, Flaccomio, Reale, et al. (2005)] Favata, F., Flaccomio, E., Reale, F., Micela, G., Sciortino, S., Shang, H., Stassun, K.G., Feigelson, E.D. 2005, ApJS 160, 469
- [Feigelson, Gaffney, Garmire, et al. (2003)] Feigelson, E.D., Gaffney, J.A., III, Garmire, G., Hillenbrand, L.A., Townsley, L. 2003, ApJ 584, 911
- [Flaccomio, Damiani, Micela, et al. (2003b)] Flaccomio, E., Damiani, F., Micela, G., Sciortino, S., Harnden, F.R., Jr., Murray, S.S., Wolk, S.J. 2003b, ApJ 582, 382
- [Flaccomio, Damiani, Micela, et al. (2003c)] Flaccomio, E., Damiani, F., Micela, G., Sciortino, S., Harnden, F.R., Jr., Murray, S.S., Wolk, S.J. 2003c, ApJ 582, 398
- [Flaccomio, Micela & Sciortino (2003a)] Flaccomio, E., Micela, G. & Sciortino, S. 2003a, A&A 397, 611
- [Flaccomio, Micela & Sciortino (2006)] Flaccomio, E., Micela, G. & Sciortino, S. 2006, A&A 455, 903
- [Günther, Schmitt, Robrade, et al. (2007)] Günther, H.M., Schmitt, J.H.M.M., Robrade, J., Liefke, C. 2007, A&A 466, 1111
- [Getman, Flaccomio, Broos, et al. (2005)] Getman, K.V., Flaccomio, E., Broos, P.S., Grosso, N., Tsujimoto, M., Townsley, L., Garmire, G.P., Kastner, J., Li, J., Harnden, F.R., Jr., Wolk, S., Murray, S.S., Lada, C.J., Muench, A.A., McCaughrean, M.J., Meeus, G., Damiani, F., Micela, G., Sciortino, S., Bally, J., Hillenbrand, L.A., Herbst, W., Preibisch, T., Feigelson, E.D. 2005, ApJS 160, 319
- [Gregory, Jardine, Cameron, et al. (2006b)] Gregory, S.G., Jardine, M., Cameron, A.C., Donati, J.-F. 2006b, MNRAS 373, 827
- [Gregory, Jardine, Simpson, et al. (2006a)] Gregory, S.G., Jardine, M., Simpson, I., Donati, J.-F. 2006a, MNRAS 371, 999
- [Gregory, Wood & Jardine (2007)] Gregory, S.G., Wood, K. & Jardine, M. 2007, MNRAS in press (astro-ph/0704.2958)
- [Güdel, Briggs, Arzner, et al. (2007a)] Güdel, M., Briggs, K.R., Arzner, K., Audard, M., Bouvier, J., Feigelson, E.D., Franciosini, E., Glauser, A., Grosso, N., Micela, G., Monin, J.-L., Montmerle, T., Padgett, D.L., Palla, F., Pillitteri, I., Rebull, L., Scelsi, L., Silva, B., Skinner, S.L., Stelzer, B., Telleschi, A. 2007a, A&A 468, 353
- [Güdel, Telleschi, Audard, et al. (2007b)] Güdel, M., Telleschi, A., Audard, M., Skinner, S.L., Briggs, K.R., Palla, F., Dougados, C. 2007b, A&A 468, 515
- [Jardine, Cameron, Donati, et al. (2006)] Jardine, M., Cameron, A.C., Donati, J.-F., Gregory, S.G., Wood, K. 2006, MNRAS 367, 917
- [Jardine, Wood, Cameron, et al. (2002)] Jardine, M., Wood, K., Cameron, A.C., Donati, J.-F., Mackay, D.H. 2002, MNRAS 336, 1364
- [Königl (1991)] Königl, A. 1991, ApJ (Letters) 370, L39
- [Krolik & Kallman (1984)] Krolik, J. H. & Kallman, T.R. 1984, ApJ 286, 366
- [Matt & Pudritz (2005)] Matt, S. & Pudritz, R.E. 2005, MNRAS 356, 167
- [Muzerolle, Calvet & Hartmann (2001)] Muzerolle, J., Calvet, N. & Hartmann, L. 2001, ApJ 550, 944
- [Preibisch, Kim, Favata, et al. (2005)] Preibisch, T., Kim, Y.-C., Favata, F., Feigelson, E.D., Flaccomio, E., Getman, K., Micela, G., Sciortino, S., Stassun, K., Stelzer, B., Zinnecker, H. 2005, ApJS 160, 401
- [Stassun, Ardila, Barsony, et al. (2004)] Stassun, K.G., Ardila, D.R., Barsony, M., Basri, G., Mathieu, R.D. 2004, AJ 127, 3537
- [Stelzer & Neuhäuser (2001)] Stelzer, B. & Neuhäuser, R. 2001, A&A 377, 538
- [Telleschi, Güdel, Briggs, et al. (2007a)] Telleschi, A., Güdel, M., Briggs, K.R., Audard, M., Palla, F. 2007a, A&A 468, 425
- [Telleschi, Güdel, Briggs, et al. (2007b)] Telleschi, A., Güdel, M., Briggs, K.R., Audard, M., Scelsi, L. 2007b, A&A 468, 443
- [Valenti & Johns-Krull (2004)] Valenti, J.A. & Johns-Krull, C.M. 2004, Ap&SS 292, 619
- [Whitney, Wood, Bjorkman, et al. (2003)] Whitney, B.A., Wood, K., Bjorkman, J.E. & Wolff, M.J. 2003, ApJ 591, 1049
ArdilaIs absorption not corrected for when calculating X-ray luminosities?
GregoryThe attenuation of X-rays is by gas in accretion columns, not by dust. Thus the absorption is larger than would be calculated from say the optical extinction. Indeed there is already evidence that for some stars the gas-to-dust ratio is larger than what is normally assumed, leading to a heavily absorbed coronal spectral component (for example, some stars in the XEST project). Although with the caveat that such stars have some of the largest inferred accretion rates, and therefore we may expect more X-ray attenuation by denser accretion columns. We are currently working on this with Ettore Flaccomio.
ArdilaSo do you think the difference in the observed X-ray luminosities would disappear if X-ray attenuation is accounted for properly?
GregoryYes, I believe so.
KastnerI think the reason that you’re getting disbelieving comments is that I’m unsure why absorption should modify the X-ray luminosity since it should be accounted for already.
FlaccomioThe derived column densities in the simulations can be high, which suggests that in accreting stars there may be a cool component that is completely or substantially absorbed and so is not detected in the spectrum.
Johns-KrullWould accretion columns rotating across the line-of-sight produce detectable sharp drops in X-ray light curves?
GregoryModulation due to bright regions entering eclipse produces a much smoother variation with rotation phase than that due to accretion columns rotating across the line-of-sight. However, the problem with testing that is you require X-ray observations that span at least a couple of stellar rotation periods, which are difficult to get observing time for.
Johns-KrullBut can’t you use the COUP dataset for that?
GregoryYes, although in the COUP paper on rotational modulation of X-ray emission they looked to see if the modulation occurred preferentially in accreting or non-accreting stars. However, they could not say anything conclusive as most stars are too heavily absorbed to have been studied spectroscopically from which their accretion status could have been determined.
BouvierAA Tau may be an exception to your model. We find that the accretion hot spot, the accretion column and the disk warp exist at the same rotation phase, but if you look at the poster by Grosso, during an eclipse by the disk warp we saw an increase in X-ray emission.
GregoryPerhaps AA Tau is an exception, or perhaps the increase in X-ray emission is accretion related rather than coronal in origin. I need to think about AA Tau in more detail.
MattIf half of the X-ray luminosity goes into heating the accretion columns then you may expect a correlation between X-ray luminosity and the flux in lines which form in the accretion columns. Has anyone looked for this?
GregoryI’m not aware that anyone has looked for that.
StelzerThe reduction factor was the average for a complete rotation cycle, so it can be higher over a smaller rotation phase?
GregoryYes, it can be higher, or less, depending on the field geometry and the portion of the rotation cycle observed.