Effect of Co and Fe on the inverse magnetocaloric properties of Ni-Mn-Sn
Abstract
At certain compositions Ni-Mn- Heusler alloys (: group IIIA-VA elements) undergo martensitic transformations, and many of them exhibit inverse magnetocaloric effects. In alloys where is Sn, the isothermal entropy change is largest among the Heusler alloys, particularly in Ni50Mn37Sn13 where it reaches a value of 20 Jkg-1K-1 for a field of 5T. We substitute Ni with Fe and Co in this alloy, each in amounts of 1 at% and 3 at% to perturb the electronic concentration and examine the resulting changes in the magnetocaloric properties. Increasing both Fe and Co concentrations causes the martensitic transition temperature to decrease, whereby the substitution by Co at both compositions or substituting 1 at% Fe leads to a decrease in the magnetocaloric effect. On the other hand, the magnetocaloric effect in the alloy with 3 at% Fe leads to an increase in the value of the entropy change to about 30 Jkg-1K-1 at 5T.
pacs:
81.30.Kf, 75.50.En, 75.50.CcI Introduction
Since the observation of martensitic transformations in Ni-Mn based Heusler alloys Webster84 , and the later discovery of the magnetic shape memory effect (MSM) in Ni-Mn-Ga Ullakko96 , there has been growing interest in the magneto-mechanical properties of Ni-Mn- systems (: group IIIA-VA elements) Acet02 ; Sutou04 ; Krenke05long ; Krenke06long ; Oikawa06 ; Koyama06 . Martensitic transformations in these systems are found roughly in a valence electron concentration range of electrons per atom. Next to the MSM effect, large magnetocaloric effects (MCE) have been reported in the vicinity of the martensitic transformation in Ni-Mn-Ga Marcos0203 and other Ni-Mn-based Heusler alloys such as Ni-Mn-Sn and Ni-Mn-In Krenke05a ; Krenke06b ; Han06 . The MCE in these systems relies on the large and rapid temperature variation in the magnetic interaction around the martensitic transition. Furthermore, the MCE in Ni-Mn-based Heuslers is usually ”inverse,” i.e., the alloy cools on applying a magnetic field adiabatically instead of heating Krenke05a . The magnitude of the inverse MCE is about 20 J kg-1K-1 for 5T in Ni50Mn37Sn13 being comparable with those of giant MCE material Gschneidner00 ; Gschneidner05 ; Bruck05 . The use of normal and inverse MCE materials in the form of composites can affect the heat transfer efficiency favorably in heating or cooling units based on the MCE.
To understand the influence of introducing small amounts of transition elements on the size of the MCE in Ni50Mn37Sn13, we have investigated the entropy change around the martensitic transition of (Ni,Co)50Mn37Sn13 and (Ni,Fe)50Mn37Sn13, in which Ni was replaced by Fe and Co, each in amounts of 1 at% and 3 at%. Higher concentrations of Fe and Co lead nearly to the complete suppression of the martensitic state. The entropy change was determined from field dependent magnetization measurements.
II Experimental
Ingots of about 3 g were prepared by arc melting pure metals under argon atmosphere in a water cooled Cu crucible. The ingots were then encapsulated under argon atmosphere in quartz glass and annealed at 1273 K for 2 hours. Afterwards, they were quenched in ice-water. The compositions of the alloys were determined by energy dispersive x-ray photoluminescence analysis (EDX) and are given in at% in Table 1. The valence electron concentrations are also given in the table. This is calculated as the concentration weighted sum of the number of 3 and 4 electrons of Ni and Mn and the number of 4 and 4 electrons of Sn. An estimated error of % in determining the concentration leads to an error of in the value of .
| Sample | Ni | Co | Fe | Mn | Sn | |
|---|---|---|---|---|---|---|
| Reference | 49.9 | - | - | 37.1 | 13.0 | 8.107 |
| Co1 | 48.7 | 1.2 | - | 36.9 | 13.2 | 8.089 |
| Co3 | 47.0 | 3.1 | - | 36.6 | 13.3 | 8.073 |
| Fe1 | 49.1 | - | 0.9 | 36.7 | 13.3 | 8.083 |
| Fe3 | 46.9 | - | 3.0 | 36.8 | 13.3 | 8.038 |
Polycrystalline samples were cut from the ingots using a low speed diamond saw and used as samples for magnetization and calorimetric studies. For differential scanning calorimetry (DSC) measurements, one side of the samples were ground with 1200 grid SiC abrasive to insure proper thermal contact. Calorimetric measurements were carried out in the temperature range 100 K 350 K. Typical heating and cooling rates were 0.5 K min-1.
The temperature dependence of the magnetization was measured in magnetic fields of 5 mT and 5 T in the temperature range 5 K K using a superconducting quantum interference device magnetometer. Prior to the measurements, the samples were prepared in a zero-field-cooled state (ZFC) by cooling it from 380 K to 5 K in the absence of a magnetic field. Subsequently, an external field was applied, and the data were taken on increasing temperature up to 380 K. Then, without removing the external field, the data were taken on decreasing temperature, giving the field-cooled (FC) branch. As a last step, again without removing the external field, the magnetization was measured on increasing temperature. The last step is denoted as the field-heated (FH) sequence. Any hysteresis in the FC and FH sequences is expected to be associated with a structural transition, whereas any splitting of the ZFC and FH curves is expected to be associated with pinning due to antiferromagnetic (AF) or noncollinear magnetic structures existing within the ferromagnetic (FM) matrix. Such structures can reside within twin boundaries if the system is martensitic.
III Results an discussion
III.1 Calorimetric studies
The results of the calorimetric experiments are collected in Fig. 1. Next to the features associated with the martensite start , martensite finish , austenite start , and austenite finish temperatures, features associated with the Curie temperature of the austenitic state are also observed. For Co1, is observed only in the cooling curve. In the heating curve, such a feature is masked by the intense peak associated with the reverse transition. The positions of are in good agreement with those determined from the magnetization measurements (section III.2). The structural transition temperatures determined from the calorimetry data are indicate with a DSC subscript and are collected in Table 2. Values for the reference sample Ni50Mn37Sn13 from earlier data are also included in the table Krenke05a . The transition temperatures decrease with respect to those of the reference sample as Fe or Co is substituted for Ni due to the decrease in the valence electron concentration.
| Sample | |||||||||
|---|---|---|---|---|---|---|---|---|---|
| (K) | (K) | (K) | (K) | (K) | (K) | (K) | (K) | (K) | |
| Ref | 307 | 303 | 289 | 265 | 295 | 275 | 318 | 309 | 311 |
| Co1 | 306 | 305 | 257 | 259 | 277 | 267 | 325 | 316 | |
| Co3 | 300 | 294 | 217 | 205 | 229 | 214 | 303 | 323 | 335 |
| Fe1 | 259 | 261 | 209 | 208 | 228 | 221 | 279 | 280 | 316 |
| Fe3 | 187 | 195 | 156 | 141 | 177 | 150 | 216 | 196 | 315 |

III.2 Magnetization measurements
The temperature dependence of the FC, ZFC, and FH magnetization measured in 5 mT is shown in Fig. 2. All samples order ferromagnetically in the austenitic state below . With respect to =311 K of the reference alloy, increases with increasing Fe and Co concentrations, whereby the increase is more significant for the case of Co (Tab. 2). For , is at the demagnetization limit in 5 mT and remains essentially temperature insensitive in all samples until it begins to drop at . The values given in Table 2 are taken as the temperature where the maximum in the FC- data is observed. These values are in good agreement with , whereby only the Fe3 sample has a larger difference in the values of determined by the two methods. At lower temperatures, runs through a minimum for all samples. The temperatures related to the minima lie somewhat lower than determined from the DSC measurements. Similarly, and lie around the temperatures at which the FH- curves exhibit a minimum and a maximum respectively. Since any of these temperatures vary rapidly with composition, any major differences of the transition temperatures determined by the two methods can be related to small compositional differences in the samples used for the and for the DSC experiments. In the case of the Co3 sample, an additional feature within the transition region is observed, which is indicative of an intermartensitic transition. However, the data are not conclusive, and further evidence is required to explain this feature.
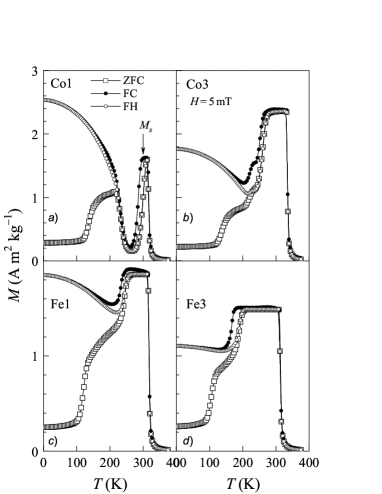
The ZFC data in Fig. 2 begin at a low magnetization value of about 0.2 Am2kg-1 due to the essentially random spatial configuration that the moments acquire while cooling through down to low temperatures. At low temperatures, the spin system is in a frozen state. On heating, remains constant up to about 100 K in all samples. At this temperature, the thermal energy begins to overcome the exchange anisotropy of the frozen state in the 5 mT measuring field, and the magnetization begins to increase. At a slightly higher temperature, the rate of increase slows down, and eventually, the ZFC and FH curves merge. This occurs at a temperature between and as the proportion of the austenitic phase increases, and along with it, ferromagnetic exchange gains strength.
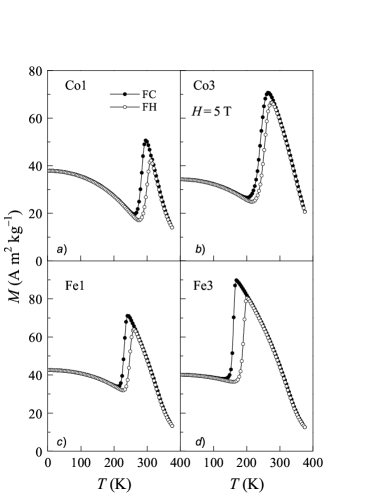
measured in 5 T is shown in Fig. 3. A difference in the ZFC and FH curves no longer exist in this field, and ZFC data are omitted. However, a hysteresis is still present in the FC and FH curves for all samples. The hysteresis narrows with increasing Co content, while it becomes broader with increasing Fe content. The temperature corresponding to the peak in the FC- curve shifts to lower values with respect to found from the data in Fig. 2. The shift is about 10 K for the Co1 sample and 20-30 K for the other samples. For all samples, the magnetization drops as the structure transforms from austenite to martensite. This drop can be related to the fact that in Mn-based Heusler systems, the exchange interaction strongly depends on the Mn-Mn distance, and any change in the distance caused by a change in the crystal structure can modify the interactions and introduce antiferromagnetic exchange. This has been shown to be the case for a Ni50Mn36Sn14 alloy, in which short range antiferromagnetic exchange was found to be present between Mn atoms located at the 4(b) positions of the austenite phase and that the exchange strengthens in the martensitic state Brown06 .
III.3 Magnetocaloric effects
To determine the size of the magnetocaloric effect (MCE) in the vicinity of the transition we use the Maxwell relation
| (1) |
from which the MCE can be estimated numerically from isotherms. The curves for the samples in the temperature range of their respective structural transition temperatures are given in Figs. 4 and 5. The curves are obtained on increasing field and decreasing temperature as indicated by the arrows. The sequence of measurements shown with open circles (red) shows an increase in with decreasing temperature down to for all samples. The behavior reverses below . For Fe1, Fe3, and Co1, increases steadily up to 5 T without any major feature. For Co3, there is a tendency for a metamagnetic-like transition for temperatures below as can be seen from the development of an upturn of the data with increasing field at an inflection point around 23 T. This feature is expected to be due to the onset of a field induced transition from the martensitic to the austenitic state, which is the state of higher magnetization. The observability of this effect only in the Co3 sample is because, the shift in to lower temperatures in the applied fields in these experiments exceeds the width of the hysteresis in (Fig. 2). For the other samples, the hysteresis is too broad to observe a field induced transition up to 5 T.
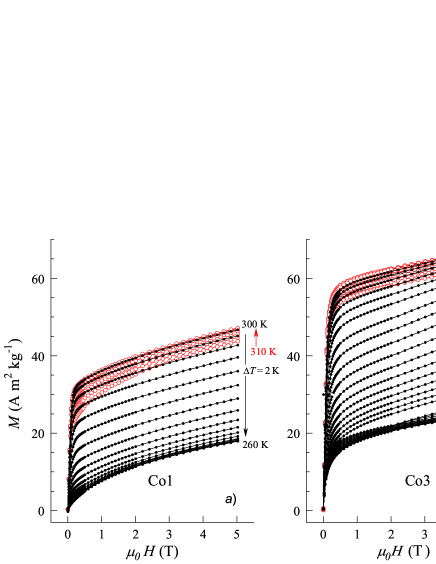
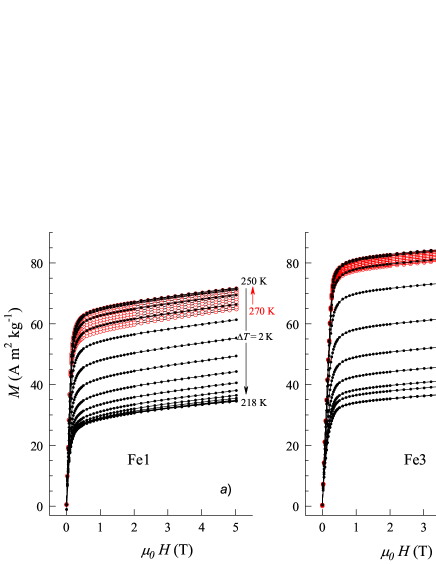
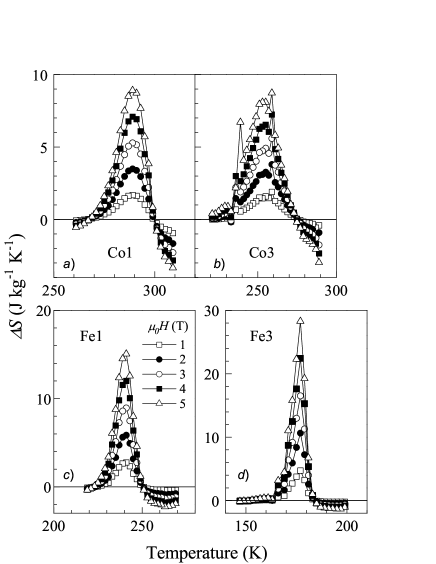
The temperature dependence of the entropy change for the presently investigated samples are collected in Fig. 6. The addition of either Fe or Co causes to decrease and, therefore, lowers the temperature corresponding to the peak position of . There is not much change in the value of when Co is alloyed. However, alloying 3 at% Fe leads to a marked increase up to 30 Jkg-1K-1 in for a field of 5T with respect to the value of 20 Jkg-1K-1 for the non-alloyed sample Krenke05a . This increase is evidently related to a comparatively large which would lead to a large through Eq. 1. For this particular concentration, a large can be found to lie in the large spacing of the magnetization isotherms in Fig. 5b. Two additional peaks in appear for the Co3 sample around 240 K and 260 K. These are expected to be related to the step-like features observed below in the data (Fig. 2b). Such features can be associated with intermartensitic transformations, whereby the modulation of the martensite structure changes.
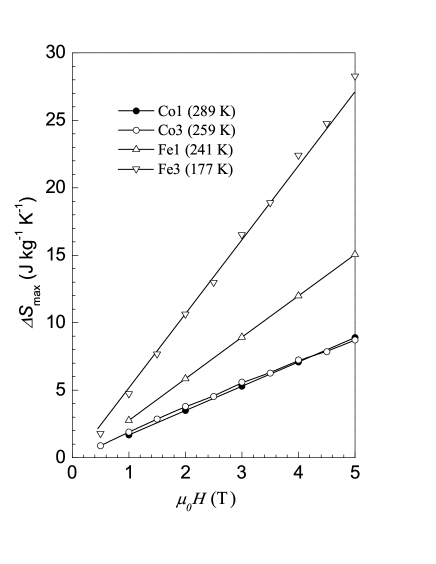
The maximum entropy change obtained from Fig. 6 is plotted against the magnetic field in Fig. 7. In all cases, the variation of with applied field is, to a good approximation, linear within the range of the experiments. The rate of increase of with field are 1.8 J kg-1 K-1 T-1 for Co1 and Co3; 3.0 J kg-1 K-1 T-1 for Fe1 and 5.5 J kg-1 K-1 T-1 for Fe3. There is no tendency to saturation for within the studied field range.
IV Conclusion
We have studied the effects of varying the electron concentration by introducing small amounts of Fe and Co in place of Ni on the magnetocaloric effect of Ni50Mn37Sn13. Introducing either of the elements leads to a decrease in , whereby Co reduces , and 3 at% Fe leads to an increase in . The increase is related to the increase in . The thermal hysteresis associated with the transition becomes narrower with Co substitution, whereas it broadens when Fe is added.
Acknowledgements.
We thank Peter Hinkel for technical support. This work was supported by Deutsche Forschungsgemeinschaft (GK277) and CICyT (Spain), project MAT2004-1291. XM acknowledges support from DGICyT (Spain).References
- (1) P. J. Webster, K. R. A. Ziebeck, S. L. Town, and M. S. Peak, Phil. Mag. B 49, 295 (1984).
- (2) K. Ullakko, J.K. Huang, C. Kantner, R.C. O’Handley, and V.V. Kokorin, Appl. Phys. Lett. 69, 1966 (1996).
- (3) M. Acet, E. Duman, E.F. Wassermann, L. Mañosa, A. Planes, J. Appl. Phys. 92, 3867 (2002).
- (4) Y. Sutou, Y. Imano, N. Koeda, T. Omori, R. Kainuma, K. Ishida, and K. Oikawa, Appl. Phys. Lett. 85,4358 (2004).
- (5) T. Krenke, M. Acet, E. F. Wassermann, X. Moya, L. Mañosa, A. Planes Phys. Rev. B 72,014412 (2005).
- (6) T. Krenke, M. Acet, E. F. Wassermann, X. Moya, L. Mañosa, A. Planes, Phys. Rev. B 73,174413 (2006).
- (7) K. Oikawa, W. Ito, Y. Imano, Y. Sutou, R. Kainuma, K. Ishida, S. Okamoto, O. Kitakami, T. Kanomata, Appl. Phys. Lett. 88,122507 (2006).
- (8) K. Koyama, K. Watanabe, T. Kanomata, R. Kainuma, K. Oikawa, K. Ishida, Appl. Phys. Lett. 88, 132505 (2006).
- (9) J. Marcos, L. Mañosa, A. Planes, F. Casanova, X. Batlle, A. Labarta, B. Martínez, Phys. Rev. B 66, 224413 (2002); J. Marcos, L. Mañosa, A. Planes, F. Casanova, X. Batlle, A. Labarta, Phys. Rev. B 68,094401 (2003).
- (10) T. Krenke, M. Acet, E. F. Wassermann, X. Moya, L. Mañosa, A. Planes, Nature Materials 4, 450 (2005).
- (11) Z.D. Han,D.H. Wang, C.L. Zhang, S.L. Tang, B.X. Gu, and Y.W. Du, Appl. Phys. Lett. 89,182507 (2006).
- (12) T. Krenke, M. Acet, E. Duman, E. F. Wassermann, X. Moya, L. Mañosa, A. Planes, E. Suard, and B. Ouladdiaf, Phys. Rev. B 75, 104414 (2007).
- (13) K.A. Gschneidner, Jr. and V.K. Pecharsky, J. Magn. Magn. Mat. 200 (1999), 44.
- (14) K.A. Gschneidner, Jr., V.K. Pecharsky, and A.O. Tsokol, Rep. Prog. Phys. 68, 1479 (2005).
- (15) E. Brück, J. Phys. D: Appl. Phys. 38, R381 (2005).
- (16) P. J. Brown, A. P. Gandy, K. Ishida, R. Kainuma, T. Kanomata, K. U. Neumann, K. Oikawa, B. Ouladdiaf, and K. R. A. Ziebeck, J. Phys.: Condens. Matter 18, 2249 (2006).