Spectroscopic Surveys: Present
Abstract
I summarize the current spectroscopic sky surveys and some of the scientific results, emphasizing the largest sky survey to-date, the Sloan Digital Sky Survey (SDSS). Techniques used commonly in spectral analyses are discussed, followed by the present needs and challenges for solving some of the unknown problems. I discuss how the Virtual Observatory (VO) can help astronomers in carrying out related research.
keywords:
Virtual Observatory1 Introduction
The homogeneity and completeness of large datasets in sky surveys favor them to be powerful platforms for scientific research and discovery. Depending on the types of objects, the observed spectra are imprinted with the most vital information on their distances from us, rotational velocities, chemical compositions and formation histories. Spectroscopic sky surveys have been invaluable to astronomers in all areas nowadays.
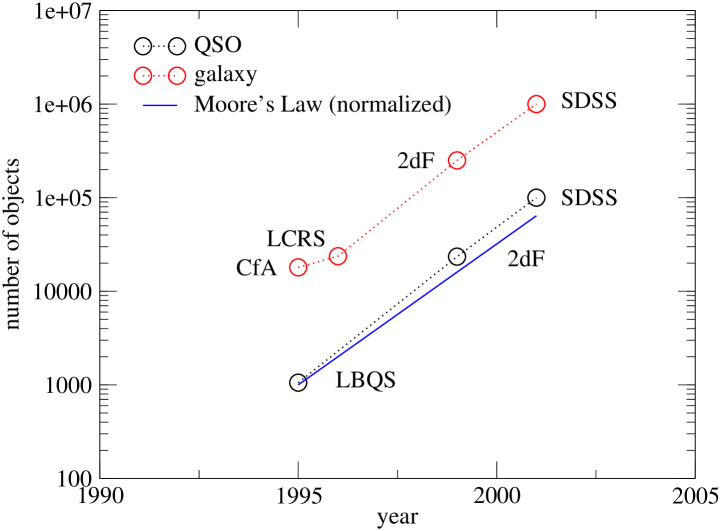
Starting from the 1990s, the rate of increase of the number of spectroscopic redshifts measured from sky surveys (Fig. 1) follows nearly the Moore’s Law (Moore, 1965). While this coincidence is probably by the designs of the surveys, the speed of increase of the data is high by the common standard in computer science. Not to be confined to the extra-galactic sky surveys, large samples of stellar spectra are now being taken in several sky surveys aiming at producing an unprecedented view of our Milky Way galaxy. The sheer amount of data (e.g., of data in the SDSS) promises new scientific discoveries across diverse areas in astronomy, it nonetheless presents great challenges to astronomers in handling the higher-dimensional data and extracting physical parameters.
The Virtual Observatory (VO, Szalay & Gray, 2001) answers a lot of these challenges by allowing astronomers to access data via the internet in an unified way, and providing to them web services for performing analyses on the data. Continuous discussions between astronomers and VO builders are important for ensuring the practicality of the tools.
This overview is concerned with some of the interesting results and discoveries from the recent spectroscopic sky surveys; and the common techniques used in spectral analyses. They in turn would be argued for the present needs and challenges, in the scopes of both spectral analyses and VO.
2 Current Spectroscopic Surveys
The recent spectroscopic surveys are summarized in Table 1. They are ground-based, with observed wavelengths mostly in the optical, and the number of spectra taken to be (approximately the number of spectra taken by the LBQS). Two characteristics are immediately evident: the most recent surveys tend to go deeper instead of getting more redshifts; and the use of magnitude selection instead of color selection. The trend of probing a deeper sky is likely a manifestation of the excellent data provided by the SDSS collaboration for the local universe. The magnitude selection, on the other hand, improves the completeness of the survey by reducing the cases in which galaxies at similar distances from us are being dropped out of the searches at optical wavelengths (see Le Fèvre et al., 2005, and references therein) by color selections.
3 Highlights of Scientific Results
Some of the science discoveries and results from spectroscopic surveys are discussed in the following. They are mostly obtained upon analyzing spectra, using line diagnostics, template111By templates we mean model-based or empirical spectra for modeling a target spectrum. fitting or data mining techniques. This overview, if not biased, inevitably omits tremendous number of interesting results (e.g., currently there are publications due to the SDSS spectroscopic data222By searching Smithsonian/NASA Astrophysics Data System (ADS) using a title “SDSS” or “Sloan”, and a keyword “spectra” or “spectroscopy”.) and even sky surveys (e.g., studies on large-scale structures by the redshifts obtained from the 2dF redshift survey). When appropriate, results obtained by using photometric or non-survey (i.e., defined as being not one of the surveys shown in Table 1) data are also listed.
3.1 Galaxies
Presently a main theme in studies of galaxy formation is rooted partly from the discovery of elliptical galaxies being more common than spirals in galaxy clusters (Dressler, 1980), and subsequently the KA galaxies (or post-starburst galaxies) (Dressler & Gunn, 1983) in clusters, showing that an observed galaxy spectrum and its stellar content depend highly on the environment. Up to , recent works (e.g., Martínez et al., 2002; Lewis et al., 2002; Gómez et al., 2003; Kauffmann et al., 2004) showed that a high density environment (from clusters to groups) suppresses star formation in its member galaxies, with proposed reasons include, but are not confined to, e.g, tidal stripping of gas away from a galaxy by its neighbors, and the depletion of gas in the galaxies before the formation of the high density environment. This “quenching” of star formation is extended to (Cooper et al., 2006).
Bimodality in color-color and color-magnitude diagrams of local galaxies is seen (e.g., Strateva et al., 2001; Hogg et al., 2004), as such early-type (red) galaxies populate a narrow sequence which is separated from the later-types. The bimodality and red sequence are seen up to (Bell et al., 2004). The formation of the galaxies in the red sequence may be due to the gas-rich mergers by blue galaxies, followed by the dry mergers by the resultant red galaxies (Faber et al., 2005).
The MPA/Garching valued-added catalog (Kauffmann et al., 2003; Brinchmann et al., 2004; Tremonti et al., 2004) provides high-end physical parameters of the SDSS DR4 galaxies. Among many applications, scaling-relationships such as the mass-(gas-phase) metallicity relationship are established, as well as the bimodalities in the 4000 Å break and stellar mass of local galaxies. The low yield in low-mass galaxies (as high as 1010 M⊙) is used to argue against closed-box model of chemical evolution, and is interpreted as a result of metal-enriched galactic wind.
Classification of star forming galaxies and Type-II active galactic nuclei (AGNs) using ratios of emission line-strengths (or the BPT diagram, Baldwin et al., 1981) has been modified to a large sample of local galaxies (Kewley et al., 2006), in which LINERs are also shown to populate distinct regions from the Type-II AGNs; and the extension to the low-metallicity (below solar) narrow-line region (NLR) (Groves et al., 2006). On the other hand, an automatic classification scheme of galaxies is that of Connolly et al. (1995) by the Karhunen-Loève (KL) transform (or the Principal Component Analysis (PCA), described in §4.3), which has shown to be applicable to classifying a large sample of local galaxies (Yip et al., 2004), as such the most important sample variations in the SDSS galaxy spectra are to manifest steepness of the continuum slopes and the post-starburst activities in galaxies.
Spectral signatures of Type-Ia supernovae can be extracted from PCA residuals of galaxy spectra (Madgwick et al., 2003; Krughoff et al., 2004). This is a promising way to quickly search for supernovae in a large sample of galaxy spectra.
A large population of high-redshift () galaxies is discovered (Le Fèvre et al., 2005). Due to the purely flux-selected method (-band), the sample is several times larger than previous samples of Lyman-break galaxy (Steidel et al., 2004), in which color selection is used. The lack of a large Ly flux in the composite spectrum of these galaxies suggests that they may be dusty.
3.2 Active Galactic Nuclei
The SDSS quasar (QSO) catalogs (the updated one being the fourth version, Schneider et al., 2007) are unprecedented in their sample sizes (77,429 objects for the updated catalog). The selection of majority of the QSOs from the multi-dimensional color-space (Richards et al., 2002) for follow-up spectroscopy results in a high completeness and efficiency.
The discoveries of high-redshift QSOs at far as (Fan et al., 2001) have made impacts in both galaxy formation and cosmology. Particularly, the detection of the Gunn-Peterson trough (the zero monochromatic flux shortward of Ly due to absorptions by intergalactic neutral hydrogen) in a QSO and a non-detection in a one (Becker et al., 2001) suggests that hydrogen in the universe has undergone a transition from a neutral to an ionized state at redshift of .
Type-II (i.e., narrow emission-line) QSOs are discovered (Zakamska et al., 2003), which are luminous AGNs as such their central regions are shielded by large amounts of gas and dust. Before, only broad emission-line luminous AGNs were known.
QSO spectra display a large diversity, which is shown to be related to the effects of redshift (more prominent iron emissions in low- QSOs to the high- ones) and luminosity (the Baldwin effect) (Yip et al., 2004). Further, some broad absorption line QSOs (BALQSOs) show unusual spectra (Hall et al., 2002), which require various explanations such as a particular geometry in the outflow materials to absorb the continuum radiation. On the other hand, Boroson (2002) proposed that the black hole mass and Eddington ratio drive the properties seen in both radio-loud and radio-quiet QSOs.
Spectral decomposition of AGN-host galaxy (Yip et al., 2004; Vanden Berk et al., 2006) by the KL-transform provides a new way to separate the host galaxy contributions from the otherwise host-contaminated Type-I AGN spectrum, thus serves as a tool to study the co-evolution between AGN and its host galaxy. Post-starburst activities are found to be more common among AGN host galaxies than inactive galaxies (Vanden Berk et al., 2006).
High-ionization broad-emission lines, such as C IV, are found to be blueshifted ( km s-1) with respect to the low-ionization broad-emission lines (e.g., Mg II) in some QSOs (Richards et al., 2002). The behavior led the authors to suggest that orientation, whether external or internal, may be the cause of the effect.
Black hole mass (estimated from broad-emission line kinematics, with the assumption of the virial radius from results on reverberation mapping) of the SDSS QSOs shows an upper limit of M⊙ (McLure & Dunlop, 2004), consistent with the mass of the largest black holes found in the local universe.
The extinction curves of QSOs were found to be similar to the Small Magellanic Cloud (SMC) extinction curve with a rising UV extinction below 2200 Å (York et al., 2006). This adds one more supporting case for the unique extinction properties of the Milky Way galaxy, in which the 2175 Å bump (a feature often associated with graphite grains) is present.
3.3 Stars
The recent discoveries of 10 new satellites of the Milky Way galaxy (see Belokurov et al., 2007, and references therein) certainly contribute to one of the biggest impacts by the SDSS. They are expected to attract many studies in near-field cosmology, as well as in implications on hierarchical galaxy formation as a whole.
By modeling the kinematics of high velocity stars, the local escape velocity of the Milky Way galaxy is found to be significantly larger then the local circular velocity (Smith et al., 2007), suggesting the existence of mass exterior to the Solar circle, possibly the dark-matter halo.
4 Spectral Analyses
4.1 Model-based vs. Empirical Approach
Spectral analyses in the model-based approach, e.g., the fitting of galaxy spectra with stellar population synthesis models (e.g., Fioc & Rocca-Volmerange, 1997; Leitherer et al., 1999; Bruzual & Charlot, 2003) and of quasar spectra with theoretical (Sigut & Pradhan, 2003) or empirical templates of iron-emissions (Vestergaard & Wilkes, 2001; Véron-Cetty et al., 2004), make the extractions of physical parameters straightforward, as the physics is prescribed by the model. However, they are hindered by the possible imperfections in models, such as the incompleteness of ingredients and the incorrect assumptions of physical conditions. Besides, they may not be the best approach in making discovery about the data.
On the contrary, without a priori descriptions the empirical approach is more favorable to making discovery in the data. For example, the constructions of composite spectra or KL eigenspectra from the data belong to this category. With the lack of model descriptions, however, interpretations are usually needed for the underlying physics. One may also need to resort to models later for estimating physical parameters.
In these regards, none of the approaches processes substantial advantage over the other, thus both could be used in a complementary fashion when studying a specific problem.
4.2 Minimization Techniques
Popular techniques used in astronomy for minimizing spectra with templates are shown in Table 2. For future analysis on complex models (e.g., as much as parameters in the PÉGASE stellar population model; or a large number of fitting components – emission and absorption lines of different widths, shapes and possible shifts from laboratory wavelengths), the Bayesian approach is promising. As it has a more logical and coherent framework in characterizing the likelihood surface defined by the data and the model, which may be degenerate.
To extract quickly physical parameters from galaxy spectra, a promising method is the Multiple Optimised Parameter Estimation and Data compression (MOPED, Heavens et al., 2000), a maximum likelihood method which reduces the number of wavelength bins in a spectra without increasing the uncertainty in the estimated parameters. It has been applied to the fast estimation of the star formation history, metallicity and dust content of galaxies (a few seconds for 17 parameters, Reichardt et al., 2001). At present, it is unknown for the scopes of probability distribution (or the complexity of the model) where this method is applicable to.
4.3 Statistical Classifications
Classification of spectra were traditionally carried out through visual inspection, often accomplished by a small number of experts. New methods are inevitable for studying large sets of data, which should be able to consider relevant information objectively and automatically, and to reduce the error rate.
One of the first works is by Connolly and his co-workers (Connolly et al., 1995) in which a linear combination of an orthogonal set eigen-functions (called “eigenspectra” by the authors) was adopted to represent each galaxy spectrum. The method used to construct the eigenspectra, namely the Karhunen-Loève (KL) transform, is a powerful and popular technique used in classification and dimensional reduction of massive data sets. The eigenspectra were shown by the authors to be applicable to classifying galaxy spectra into a sequence ranging from the old to the younger stellar populations (later known as the “eClass”). The KL transform has been applied in the spectroscopic classifications of stars (Bailer-Jones et al., 1998; Singh et al., 1998), galaxies (Connolly et al., 1995; Sodre & Cuevas, 1997; Bromley et al., 1998; Galaz & de Lapparent, 1998; Ronen et al., 1999; Folkes et al., 1999; Yip et al., 2004) and QSOs (Boroson & Green, 1992; Francis et al., 1992; Shang et al., 2003; Yip et al., 2004). This method has been extended to spectra which are “gappy”, e.g., with bad pixels or skylines (Connolly & Szalay, 1999).
The other notable method used in classification is the artificial neural network. Also called “supervised learning”, the idea behind is the users manually classify a subset of the data, and from this the neural network is “trained” to classify the remaining of the data. This method has been applied in the spectroscopic classifications of stars (von Hippel et al., 1994; Weaver & Torres-Dodgen, 1997; Bailer-Jones, 1997; Singh et al., 1998; Snider et al., 2001), galaxies (Folkes et al., 1996) and AGNs (Rawson et al., 1996).
There are many works applying other machine learning techniques to classification problems in astronomy. The decision tree induction (returns a boolean function “yes” or “no” by finding logical patterns within the input data) has been used in star-galaxy separation (Weir et al., 1995; Odewahn et al., 2004) and in morphological classification of galaxies (Owens et al., 1996). The information bottleneck method (finds the best trade-off between accuracy and compression when clustering a random variable x, given the joint probability distribution between x and an observed variable y) has been applied to galaxy spectral classification (Slonim et al., 2001).
A recent addition is a PCA-based approach which probes the correlation between nebular emissions and stellar continua of the SDSS galaxies (Győry et al., 2007), in the subspace spanned by the eigencoefficients (i.e. the expansion coefficients of a spectrum by the set of eigenspectra) of both the emission lines and the continua. This may be a promising approach for estimating statistically the line strengths given a stellar continuum.
5 Present Needs & Challenges
5.1 Modeling Galaxy
The spectrophotometry is unlikely to be perfect in both the observed and the template spectra from stellar population models. As a result, a true spectrum is changed generally to , as such
| (1) |
where is a wavelength-dependent array of values. Line-strength indices that are represented by equivalent-width (EW) are not affected, as
| (2) |
assuming the continnum flux densities is also affected according to Eqn. 1, a valid assumption for atmospheric differential refraction or instrumental effects. Other line diagnostics can be checked accordingly in a similar fashion. However, derived quantities are affected if they depend on the absolute flux scale of the spectrum, e.g., stellar mass of a galaxy from fitting stellar population models to the spectrum, synthetic magnitudes of the spectrum.
5.2 Parameterization of Star Formation History
The optimal parameterization of the star formation history of galaxies is unknown. How many parameters at maximal can we fit for an observed spectrum by templates (in this context, a mixture of simple stellar populations of arbitrarily different ages and metallicities, and an intrinsic dust reddening model) without starting to fit for the noise in the spectral flux densities? A possible approach to characterize this is to perform tests on parameter recovery: starting from a simple model, and subsequently adding more complexity (e.g., by relaxing more parameters to change).
5.3 Modeling Quasar
Quasar spectra present a challenge to modelers for a general approach because of their displayed diversity. Line-widths, as well as line-shapes, can be different on both the element-to-element and object-to-object bases. There are high-ionization broad-emission lines that may be blueshifted for as much as km s-1 (Richards et al., 2002). Further, pure emission and absorption lines are difficult to be isolated because of the “contamination” by iron emissions (as much as transitions in Fe II from UV to IR (Sigut & Pradhan, 2003), which at times form a pseudo-continuum), prominent effects in the vicinity of Mg II and H emissions for some QSOs. For BALQSOs, their features are found to span a number of higher-order eigenspectra and are not confined to only one particular mode (Yip et al., 2004). All of these factors contribute to the fact that a compact description of QSO spectra (e.g., with a handful of eigenspectra) is unlikely.
5.4 Cross-Calibration
While cross-wavelength, -catalog and -epoch analyses often provide new insights to science problems, there is no scheme yet available for calibrating generally the datasets from different categories. For example, it is not clear how to separate systematics from statistical errors, where both of them can be completely different across the catalogs. This will undoubtedly pose a challenge in designing a general data model for recording a priori the relevant parameters which are useful for hunting down the systematics, such as observational conditions or instrumental characteristics.
5.5 Parameter Estimations
Thus far, the uncertainties of estimated physical parameters of spectra quoted in literatures are usually obtained by the bootstrap or similar method (with the 1 uncertainties being most popular). However, it is not proved that such an uncertainty is equal to that obtained from error propagations of parameter uncertainty of each object in the sample, particularly under different situations of realistic S/N where the underlying likelihood surface (defined by the data and model) is expected to be modulated accordingly.
6 Spectroscopic Science & Virtual Observatory
The greatest benefit astronomers gain from using the tools provided by the VO (Szalay & Gray, 2001) is probably the unification of data access. For spectroscopic data, the standard is a XML Schema called the Spectrum Data Model, established by the International Virtual Observatory Alliance (IVOA). Such standards are invaluable for speeding up error-checking and peer communications. An unified data access is hereby made possible by the VO Registry, eliminating the need for storing locally a copy of the data by each user.
In addition, the developed tools in archiving spectra and spectral analyses are readily available to the astronomy community, particularly in archiving survey catalogs (NVO Spectrum Services, Dobos et al., 2004), multi-wavelength analyses (VOSpec, Osuna et al., 2005), and visualizations (Specview Busko, 2000). Further, all of them provide some common spectral analyses, and fitting services to spectra with templates. On the other hand, the searching and cross-matching services for multiple tables or catalogs, e.g., the SDSS CasJobs (OMullane et al., 2005) and the WESIX (Krughoff et al., 2005) would be very useful for spectral analyses in multi-epoch and -wavelengths.
A checklist of the needs for astronomers in their daily research likely includes
-
•
unique sets of data
-
•
easy uploading of user data
-
•
a complete inventory for searching available datasets
-
•
accurate documentations of schema’s and web services
-
•
an unique set of standard tools for common spectral analyses such as foreground dust dereddening, constructions of composite spectra, and simple fitting tasks
-
•
being notified of version updates
7 Acknowledgments
I thank the organizers of the Astronomical Spectroscopy & The Virtual Observatory WorkShop 2007 for inviting me to attend the meeting and giving this talk. I thank Tamás Budavári, Sébastien Heinis, Rosemary F. G. Wyse and Alex Szalay for useful discussions. I acknowledge support through grants from the W.M. Keck Foundation and the Gordon and Betty Moore Foundation, to establish a program of data-intensive science at the Johns Hopkins University.
References
- Bailer-Jones (1997) Bailer-Jones, C. A. L. 1997, PASP, 109, 932
- Bailer-Jones et al. (1998) Bailer-Jones, C. A. L., Irwin, M., & von Hippel, T. 1998, MNRAS, 298, 361
- Baldwin et al. (1981) Baldwin, J. A., Phillips, M. M., & Terlevich, R. 1981, PASP, 93, 5
- Becker et al. (2001) Becker, R. H., et al. 2001, AJ, 122, 2850
- Bell et al. (2004) Bell, E. F., et al. 2004, ApJ, 608, 752
- Belokurov et al. (2007) Belokurov, V., et al. 2007, ApJ, 654, 897
- Boroson (2002) Boroson, T. A. 2002, ApJ, 565, 78
- Boroson & Green (1992) Boroson, T. A., & Green, R. F. 1992, ApJS, 80, 109
- Brinchmann et al. (2004) Brinchmann, J., Charlot, S., White, S. D. M., Tremonti, C., Kauffmann, G., Heckman, T., & Brinkmann, J. 2004, MNRAS, 351, 1151
- Bromley et al. (1998) Bromley, B. C., Press, W. H., Lin, H., & Kirshner, R. P. 1998, ApJ, 505, 25
- Bruzual & Charlot (2003) Bruzual, G., & Charlot, S. 2003, MNRAS, 344, 1000
- Busko (2000) Busko, I. 2000, Astronomical Data Analysis Software and Systems IX, 216, 79
- Connolly & Szalay (1999) Connolly, A. J., & Szalay, A. S. 1999, AJ, 117, 2052
- Connolly et al. (1995) Connolly, A. J., Szalay, A. S., Bershady, M. A., Kinney, A. L., & Calzetti, D. 1995, AJ, 110, 1071
- Cooper et al. (2006) Cooper, M. C., et al. 2006, MNRAS, 370, 198
- Davis et al. (2003) Davis, M., et al. 2003, Proc. SPIE, 4834, 161
- Dobos et al. (2004) Dobos, L., Budavári, T., Csabai, I., & Szalay, A. S. 2004, Astronomical Data Analysis Software and Systems (ADASS) XIII, 314, 185
- Dressler (1980) Dressler, A. 1980, ApJ, 236, 351
- Dressler & Gunn (1983) Dressler, A., & Gunn, J. E. 1983, ApJ, 270, 7
- Faber et al. (2005) Faber, S. M., et al. 2005, ArXiv Astrophysics e-prints, arXiv:astro-ph/0506044
- Fan et al. (2001) Fan, X., et al. 2001, AJ, 122, 2833
- Fioc & Rocca-Volmerange (1997) Fioc, M., & Rocca-Volmerange, B. 1997, A&A, 326, 950
- Folkes et al. (1999) Folkes, S., et al. 1999, MNRAS, 308, 459
- Folkes et al. (1996) Folkes, S. R., Lahav, O., & Maddox, S. J. 1996, MNRAS, 283, 651
- Francis et al. (1992) Francis, P. J., Hewett, P. C., Foltz, C. B., & Chaffee, F. H. 1992, ApJ, 398, 476
- Galaz & de Lapparent (1998) Galaz, G., & de Lapparent, V. 1998, A&A, 332, 459
- Gómez et al. (2003) Gómez, P. L., et al. 2003, ApJ, 584, 210
- Groves et al. (2006) Groves, B. A., Heckman, T. M., & Kauffmann, G. 2006, MNRAS, 371, 1559
- Győry et al. (2007) Győry, Z. and Szalay, A. S. and Budavári, T. and Csabai, I. and Charlot, S. 2007, AJ, in press
- Hall et al. (2002) Hall, P. B., et al. 2002, ApJS, 141, 267
- Heavens et al. (2000) Heavens, A. F., Jimenez, R., & Lahav, O. 2000, MNRAS, 317, 965
- Hogg et al. (2004) Hogg, D. W., et al. 2004, ApJ, 601, L29
- Kauffmann et al. (2003) Kauffmann, G., et al. 2003, MNRAS, 341, 33
- Kauffmann et al. (2004) Kauffmann, G., White, S. D. M., Heckman, T. M., Ménard, B., Brinchmann, J., Charlot, S., Tremonti, C., & Brinkmann, J. 2004, MNRAS, 353, 713
- Kewley et al. (2006) Kewley, L. J., Groves, B., Kauffmann, G., & Heckman, T. 2006, MNRAS, 372, 961
- Krughoff et al. (2004) Krughoff, K., Connolly, A., Frieman, J., Kilper, G., Subbarao, M., & Sheldon, E. 2004, Bulletin of the American Astronomical Society, 36, 1464
- Krughoff et al. (2005) Krughoff, K. S., Connolly, A. J., Colberg, J. M., O’Mullane, W., & Williams, R. D. 2005, Astronomical Data Analysis Software and Systems XIV, 347, 355
- Lawson & Hanson (1974) Lawson, C. L. and Hanson, R. J. 1974, Solving Least Squares Problems, Prentice-Hall
- Le Fèvre et al. (2005) Le Fèvre, O., et al. 2005, Nature, 437, 519
- Le Fèvre et al. (2004) Le Fèvre, O., et al. 2004, A&A, 428, 1043
- Leitherer et al. (1999) Leitherer, C., et al. 1999, ApJS, 123, 3
- Lewis et al. (2002) Lewis, I., et al. 2002, MNRAS, 334, 673
- Lilly et al. (2006) Lilly, S. J., et al. 2006, ArXiv Astrophysics e-prints, arXiv:astro-ph/0612291
- Madgwick et al. (2003) Madgwick, D. S., Hewett, P. C., Mortlock, D. J., & Wang, L. 2003, ApJ, 599, L33
- Martínez et al. (2002) Martínez, H. J., Zandivarez, A., Domínguez, M., Merchán, M. E., & Lambas, D. G. 2002, MNRAS, 333, L31
- McLure & Dunlop (2004) McLure, R. J., & Dunlop, J. S. 2004, MNRAS, 352, 1390
- Moore (1965) Moore, G. E. 1965, Electronics, 38, 8
- Odewahn et al. (2004) Odewahn, S. C., et al. 2004, AJ, 128, 3092
- OMullane et al. (2005) OMullane, W., Li, N., Nieto-Santisteban, M., Szalay, A., Thakar, A., & Gray, J. 2005, ArXiv Computer Science e-prints, arXiv:cs/0502072
- Osuna et al. (2005) Osuna, P., Barbarisi, I., Salgado, J., & Arviset, C. 2005, Astronomical Data Analysis Software and Systems XIV, 347, 198
- Owens et al. (1996) Owens, E. A., Griffiths, R. E., & Ratnatunga, K. U. 1996, MNRAS, 281, 153
- Rawson et al. (1996) Rawson, D. M., Bailey, J., & Francis, P. J. 1996, Publications of the Astronomical Society of Australia, 13, 207
- Reichardt et al. (2001) Reichardt, C., Jimenez, R., & Heavens, A. F. 2001, MNRAS, 327, 849
- Richards et al. (2002) Richards, G. T., et al. 2002, AJ, 123, 2945
- Richards et al. (2002) Richards, G. T., Vanden Berk, D. E., Reichard, T. A., Hall, P. B., Schneider, D. P., SubbaRao, M., Thakar, A. R., & York, D. G. 2002, AJ, 124, 1
- Ronen et al. (1999) Ronen, S., Aragon-Salamanca, A., & Lahav, O. 1999, MNRAS, 303, 284
- Schneider et al. (2007) Schneider, D. P., et al. 2007, AJ, 134, 102
- Scoville et al. (2006) Scoville, N., et al. 2006, ArXiv Astrophysics e-prints, arXiv:astro-ph/0612306
- Shang et al. (2003) Shang, Z., Wills, B. J., Robinson, E. L., Wills, D., Laor, A., Xie, B., & Yuan, J. 2003, ApJ, 586, 52
- Sigut & Pradhan (2003) Sigut, T. A. A., & Pradhan, A. K. 2003, ApJS, 145, 15
- Singh et al. (1998) Singh, H. P., Gulati, R. K., & Gupta, R. 1998, MNRAS, 295, 312
- Slonim et al. (2001) Slonim, N., Somerville, R., Tishby, N., & Lahav, O. 2001, MNRAS, 323, 270
- Smith et al. (2007) Smith, M. C., Ruchti, G. R., Helmi, A., & Wyse, R. F. G. 2007, IAU Symposium, 235, 137
- Snider et al. (2001) Snider, S., Allende Prieto, C., von Hippel, T., Beers, T. C., Sneden, C., Qu, Y., & Rossi, S. 2001, ApJ, 562, 528
- Sodre & Cuevas (1997) Sodre, L., Jr., & Cuevas, H. 1997, Young Galaxies and QSO Absorption-Line Systems, 114, 149
- Steidel et al. (2004) Steidel, C. C., Shapley, A. E., Pettini, M., Adelberger, K. L., Erb, D. K., Reddy, N. A., & Hunt, M. P. 2004, ApJ, 604, 534
- Steinmetz (2003) Steinmetz, M. 2003, GAIA Spectroscopy: Science and Technology, 298, 381
- Strateva et al. (2001) Strateva, I., et al. 2001, AJ, 122, 1861
- Strauss et al. (2002) Strauss, M. A., et al. 2002, AJ, 124, 1810
- Szalay & Gray (2001) Szalay, A., & Gray, J. 2001, Science, 293, 2037
- Trager et al. (1998) Trager, S. C., Worthey, G., Faber, S. M., Burstein, D., & Gonzalez, J. J. 1998, ApJS, 116, 1
- Tremonti et al. (2004) Tremonti, C. A., et al. 2004, ApJ, 613, 898
- Vanden Berk et al. (2005) Vanden Berk, D. E., et al. 2005, AJ, 129, 2047
- Vanden Berk et al. (2006) Vanden Berk, D. E., et al. 2006, AJ, 131, 84
- Véron-Cetty et al. (2004) Véron-Cetty, M.-P., Joly, M., & Véron, P. 2004, A&A, 417, 515
- Vestergaard & Wilkes (2001) Vestergaard, M., & Wilkes, B. J. 2001, ApJS, 134, 1
- von Hippel et al. (1994) von Hippel, T., Storrie-Lombardi, L. J., Storrie-Lombardi, M. C., & Irwin, M. J. 1994, MNRAS, 269, 97
- Weaver & Torres-Dodgen (1997) Weaver, W. B., & Torres-Dodgen, A. V. 1997, ApJ, 487, 847
- Weir et al. (1995) Weir, N., Fayyad, U. M., & Djorgovski, S. 1995, AJ, 109, 2401
- Yip et al. (2004) Yip, C. W., et al. 2004, AJ, 128, 2603
- Yip et al. (2004) Yip, C. W., et al. 2004, AJ, 128, 585
- York et al. (2000) York, D. G., et al. 2000, AJ, 120, 1579
- York et al. (2006) York, D. G., et al. 2006, MNRAS, 367, 945
- Zakamska et al. (2003) Zakamska, N. L., et al. 2003, AJ, 126, 2125
| Survey | Year | a | b | c | |
|---|---|---|---|---|---|
| SDSS-Id | 2000 | 106 | 2000 | 0 0.3 | e |
| 105 | 2000 | 0 6 | f | ||
| SDSS-IIg | 2005 | 2h | 2000 | 0 6 | same as above |
| DEEP2i | 2002 | 6 | 5000 | 0.7 1.5 | |
| VVDSj | 2002 | 250 | 0.2 4.0 | ||
| 5 | 250 | 0.2 4.0 | |||
| 250 | 0.2 4.0 | ||||
| zCOSMOSk | 2005 | 2 | 600 | 0.1 1.2 | |
| 200 | 1.4 3.0 | colorl | |||
| RAVEm | 2006 | 7500 | Galactic |
Number of spectra.
Spectral resolution, .
Magnitude limit(s), for which an object with brightness higher than (or within) are included in the survey.
The Sloan Digital Sky Survey (York et al., 2000) is
currently the largest sky survey with both fiber-fed
spectroscopy and photometry.
The galaxy survey, with a completeness (Strauss et al., 2002).
The quasar (QSO) survey, with a completeness (Vanden Berk et al., 2005).
The SDSS-II comprises three surveys: the Legacy, the Sloan
Extension for Galactic Understanding and Exploration (SEGUE) and
the Supernovae surveys.
The projected number of spectra respectively for both the Legacy
and the SEGUE surveys (c.f., Kron R., in http://www.sdss.org/surveyops/SDSS-II/nsfFirstYearReview/nsf06-overview.pdf).
The DEEP Extragalactic Evolutionary Probe 2 Redshift Survey (Davis et al., 2003).
The VIMOS VLT Deep Survey (Le Fèvre et al., 2004).
The redshift survey (Lilly et al., 2006) in the
COSMOS field (Scoville et al., 2006) comprises zCOSMOS-bright
and -deep, with complementary imaging data from X-ray to radio.
This includes the BzK selection for searching star-forming
and passively-evolving galaxies in , and possibly other color selections;
with an additional magnitude cut of for the desired
continuum S/N.
The RAdial Velocity Experiment (Steinmetz, 2003). Spectra are taken in
Å, which includes the Ca-triplet.
| Method | Advantage | Dis-advantage |
| least-square fit | – simple implementation | – works well for Gaussian |
| probability distribution only | ||
| non-negative least-square fita | – each monochromatic flux from template is summed, | – still least-square fit |
| positively, hence more physical than least-square fit | ||
| Bayesian approach | – logical and coherent framework for uncertainty | – may need self implementation |
| Scheme | Advantage | Dis-advantage |
| line indicesb | – focus on, e.g., age- and metallicity-sensitive lines | – depend on prior knowledge of lines |
| whole spectrum | – contributions from all wavelength bins | – irrelevant lines may interfere |
| – still model-dependent |