The Infrared Properties of Hickson Compact Groups
Abstract
Compact groups of galaxies provide a unique environment to study the mechanisms by which star formation occurs amid continuous gravitational encounters. We present 2MASS (JHK), Spitzer IRAC (3.5-8m) and MIPS (24m) observations of a sample of twelve Hickson Compact Groups (HCGs 2, 7, 16, 19, 22, 31, 42, 48, 59, 61, 62, and 90) that includes a total of 45 galaxies. The infrared colors of the galaxies in this sample span a range of parameter space, and some trends are apparent in the data. The near-infrared colors of the sample galaxies are largely consistent with being dominated by slightly reddened normal stellar populations. There is also some evidence for a K-band excess in a few cases, which likely indicates the presence of hot dust at or near the sublimation temperature associated with AGN or star formation activity. Galaxies that have the most significant PAH and/or hot dust emission (as inferred from excess 8m flux) also tend to have larger amounts of extinction and/or K-band excess and stronger 24m emission, all of which suggest ongoing star formation activity. We separate the twelve HCGs in our sample into three types based on the ratio of the group HI mass to dynamical mass. We find evidence that galaxies in the most gas-rich groups tend to be the most actively star forming. Galaxies in the most gas-poor groups tend to be tightly clustered around a narrow range in colors consistent with the integrated light from a normal stellar population. We interpret these trends as indicating that galaxies in gas-rich groups experience star formation and/or nuclear actively until their neutral gas consumed, stripped, or ionized. The galaxies in this sample exhibit a “gap” between gas-rich and gas-poor groups in infrared color space that is sparsely populated and not seen in the Spitzer First Look Survey sample. This gap may suggest a rapid evolution of galaxy properties in response to dynamical effects. These results suggest that the global properties of the groups and the local properties of the galaxies are connected.
1 Introduction
Compact groups of galaxies provide a rich environment in which to study the effect of galaxy interactions and mergers on galaxy formation and evolution. Compact groups are among the densest concentrations of galaxies known, comparable to the centers of rich clusters (Hickson, 1982). However, they also have relatively low velocity dispersions, increasing the duration of gravitational interactions between the galaxies in these groups (Hickson et al., 1992). In fact, a large fraction of galaxies within Hickson Compact Groups (HCGs) have morphological peculiarities of some kind (Mendes de Oliveira & Hickson, 1994) or abnormal rotation curves (Rubin, Hunter, & Ford, 1991). Because of their galaxy densities and velocity dispersions, compact groups may provide local analogs to hierarchical galaxy formation in the earlier universe. Moreover, these groups provide laboratories to study a variety of physical processes, including the formation of active galactic nuclei (AGN), super star clusters, and dwarf galaxies.
It is currently unclear how the frequent tidal encounters that occur in compact groups induce or inhibit activity and transformation of the member galaxies. Studies of elliptical galaxies in HCGs indicate that interactions have modified their isophotes and/or that some ellipticals in these groups are bluer than normal (Zepf et al., 1991). Surveys of subsets of HCGs have yielded apparently contradictory results relating the role of interactions and star formation. For example, based on a sample of 95 galaxies within 31 HCGs, H emission seems to be anti-correlated with the velocity dispersion of HCGs (Severgnini & Saracco, 2001), suggesting that higher levels of star formation activity are associated with slower interactions between group members. However, based on a sample of 30 galaxies in 20 HCGs, Nishiura et al. (2000) do not find any significant correlation between the dynamical properties of a group and the presence of disturbed morphology or nuclear activity of group members.
The compact group environment may lead to exhaustion or stripping of molecular gas, or perhaps concentration of molecular gas into the nuclei of the member galaxies. Individual galaxies in HCGs as a class may be relatively deficient in both atomic and molecular gas compared to isolated spirals (Yun, 1997; Huchtmeier, 1997; Verdes-Montenegro et al., 1998, 2001), although Leon, Combes, & Menon (1998) find the molecular gas content in HCGs to be similar to that in pairs and starburst samples. Leon et al. (1998) also find enhanced H2 for the most compact groups, which suggests that the galaxy interactions drive the gas inwards. Groups that are more deficient in HI also have a higher detection rate in X-ray observations (Verdes-Montenegro et al., 2001; Ponman et al., 1996), possibly indicating that ionization via shocks, heating, or the intergalactic radiation field contributes to the lack of neutral gas observed in these systems. An example of strong large-scale shocks due to encounters between galaxies and the IGM is seen in Stephan’s Quintet (HCG92) (Appleton et al., 2006). There is also evidence for the formation of tidal dwarf galaxies in HCGs (e.g. Hunsberger, Charlton, & Zaritsky, 1998), supporting the idea that significant amounts of matter may be stripped from member galaxies during their interactions.
Based on HI observations of 72 HCGs, Verdes-Montenegro et al. (2001) propose an evolutionary scenario that is somewhat analogous to the famous “Toomre sequence” for merging galaxy pairs. First a loose group gradually contracts into a compact group (Barton, de Carvalho, & Geller, 1998). This stage is followed by a “transformation” period in which galaxy morphologies tend to evolve to earlier types, during which HI gas is extracted and dispersed, and X-ray gas is created. Throughout this scenario, the gas is actively redistributed from the relatively quiescent interstellar medium (ISM), to fuel star formation, power AGN activity, and contribute to the intercluster medium (ICM) — giving rise to a variety of observable processes.
Many of the processes that could be taking place within compact groups will have a signature in the infrared emission of the galaxies — AGN activity, star formation, and the presence of warm/cold dust should all be readily observable in the thermal infrared. Based on IRAS observations, Allam et al. (1995) and Verdes-Montenegro et al. (1998) find that compact group galaxies exhibit a normal level of infrared emission compared to control samples of isolated galaxies, which suggests that the tidal activity in these groups does not generally enhance star formation. Thermal infrared observations with the Infrared Space Observatory (ISO) were carried out on HCG 31 and HCG 92 (Xu, Sulentic, & Tuffs, 1999; Sulentic, 2001; O’Halloran, 2002; Xu et al., 2003). These observations indicate that several modes of star formation related to the compact group environment are simultaneously present in these groups (including intense star formation at collision interfaces, star formation in the tidal debris, and star formation due to galaxy interactions with the ICM), which demonstrates that in at least some HCGs the interaction of group members has affected star formation. These observations also potentially provide insight into the nature of gas deficiency in HCGs; the far-IR 60m and 100m observations of HCG 92 indicate diffuse emission from dust outside of the galaxies (e.g. Xu, Sulentic, & Tuffs, 1999), plausibly powered by stripped or tidally formed stars.
These case studies have been valuable for gaining insight into specific groups. However, compact groups present very complex environments, and studies of individual groups cannot probe the range of processes and environments that may contribute to an “evolutionary sequence”. As part of a multi-wavelength effort to study compact groups, and the variety of physical processes that take place within them, we have obtained Spitzer Space Telescope observations of a sample of twelve nearby ( km s-1) compact groups chosen to span a range in evolutionary properties. In addition to the Spitzer data, we also present the 2MASS (The Two Micron All Sky Survey, Skrutskie et al., 2006) fluxes of the galaxies in our sample. The goal of this initial paper is to present an overview of the main infrared properties of the sample.
2 Observations
| R.A. | Dec. | Galaxy Membership | Group | |||||
|---|---|---|---|---|---|---|---|---|
| ID | (km/s) | (J2000) | (J2000) | E/SO | Sp | Other | aaDynamical masses calculated from velocity dispersions and median galaxy separations in Hickson et al. (1992); Ribeiro et al. (1998); Zimer et al. (2003). HI masses are from Verdes-Montenegro et al. (2001). | type bbGroup type based on as discussed in § 2.1. |
| HCG 02 | 4309 | 00:31:30.0 | +08:25:52 | 0 | 2 | 1 | 0.960.07 | I |
| HCG 07 | 4233 | 00:39:23.9 | +00:52:41 | 0 | 4 | 0 | 0.850.06 | II |
| HCG 16 | 3957 | 02:09:31.3 | -10:09:31 | 0 | 2 | 2 | 0.900.05 | I |
| HCG 19 | 4245 | 02:42:45.1 | -12:24:43 | 1 | 1 | 1 | 0.810.10 | II |
| HCG 22 | 2686 | 03:03:31.3 | -15:40:32 | 1 | 2 | 0 | 0.840.05 | II |
| HCG 31 | 4094 | 05:01:38.3 | -04:15:25 | 0 | 2 | 5 | 1.010.07 | I |
| HCG 42 | 3976 | 10:00:21.8 | -19:38:57 | 3 | 1 | 0 | 0.750.06 | III |
| HCG 48 | 3162 | 10:37:45.6 | -27:04:50 | 2 | 2(0) ccGalaxies HCG 48b and HCG 48c have slightly discordant velocities and may not be proper group members. | 0 | 0.710.06 | III |
| HCG 59 | 4058 | 11:48:26.6 | +12:42:40 | 1 | 2 | 1 | 0.810.05 | II |
| HCG 61 | 3907 | 12:12:24.9 | +29:11:21 | 2 | 1 | 0 | 0.890.08 | I |
| HCG 62 | 4122 | 12:53:08.1 | -09:13:27 | 4 | 0 | 0 | 0.700.07 | III |
| HCG 90 | 2644 | 22:02:06.0 | -31:55:48 | 2 | 1 | 1 | 0.740.06 | III |
We selected a sample of twelve HCGs from the Hickson Compact Group catalog (Hickson et al., 1992) based on distance ( km s-1), angular extent (), and membership (at least three concordant members). The resulting sample is shown in Table 1. We include several compact groups in each of the three stages of the proposed evolutionary sequence (Verdes-Montenegro et al., 2001): pre-interaction, shocked intergroup medium, and smooth intergroup medium (see § 2.1 for explanation of evolutionary states). Nevertheless, within each of these broad categories, there is a large variety of group properties.
Spitzer observations of the twelve HCGs were obtained with the IRAC (Fazio et al., 2004) and MIPS (Rieke et al., 2004) cameras as part of a GO-1 program. The IRAC observations were taken in high dynamic range mode, with one 12 sec exposure and three 30 sec exposures for each dithered position. The total number of exposures taken for each group was either 24 (HCGs 19, 31, 59, 61, and 62) or 48 (HCGs 2, 7, 16, 22, 42, 48, 90) for each set of cameras (3.6m and 5.8m together, then 4.5m and 8.0m together), depending on the spatial extent of the group. After the basic calibrated data (BCD) were obtained, they were run through both artifact mitigation and stray light correction routines as part of the Spitzer MOPEX package (version 093005, Makovoz et al., 2006). The 30 sec exposures were then combined onto a finer grid scale using the Spitzer mosaic software, in order to better sample the point spread functions (PSFs). The resulting grids have a pixel scale of . The 12 sec exposures were used only in the case of saturation in the 30 sec exposures. MIPS 24m images were obtained with three cycles of 3 sec duration with the number of exposures ranging from two to four. The post-BCD observations were downloaded and mosaiced onto the same grid with a pixel scale of . The sensitivity limits vary slightly for each of the compact groups: for 3.6m, 4.5m, 5.8m, 8.0m, and 24m respectively, typical 3- limits are Jy, 5Jy, 30Jy, 40Jy, and 250Jy and 3- extended source sensitivity limits are MJy ster-1, 0.05 MJy ster-1, 0.2 MJy ster-1, 0.2 MJy ster-1, and 0.3 MJy ster-1.
For the purposes of comparing photometry from IRAC and 24m observations, the 2MASS and IRAC images were first convolved to the 24m PSF. Photometry was then performed with a specialized IDL routine developed by A. Reines and R. Indebetouw (see description of code in Reines et al. in prep) that detects a specified contour level in a reference image, assigns a background annulus that has the same shape as the aperture contour (but is expanded out by a specified factor), and then carries out the photometry using identical apertures and annuli at each wavelength for a given galaxy. For the photometry in this paper, apertures were determined by combining all four IRAC bands (weighted by ), and determining a contour level of 1.5-2. A background annulus was used that had inner and outer scales 2 and 2.5 the scale of the aperture. Extended source aperture corrections are necessary due to the significant contribution from scattered light, particularly in the 5.8m and 8.0m bands; these were determined following the prescription of T. Jarrett using the “average” radii of the irregular apertures used 111Further information can be found on Jarrett’s IRAC website: http://spider.ipac.caltech.edu/staff/jarrett/irac/calibration/ . Typical corrections were 7%, 3%, 33%, and 24% at 3.6m, 4.5m, 5.8m, and 8.0m, respectively, which are close to the values for an “infinite” aperture determined by T. Jarrett. Uncertainties in the flux densities greater than 10 mJy are dominated by calibration issues and are estimated to be %. Flux densities of the fainter sources are more strongly subject to statistical variations that cause the exact contour shape to change, and we estimate the total uncertainties empirically to be % for flux densities of 5-10 mJy, % for flux densities 1-5 mJy, and % for flux densities mJy (which are only


marginally detected). The uncertainties for faint objects are largely driven by surface brightness issues, where small variations in the local background can dramatically affect the measured flux densities.
2.1 Evolutionary Stages of Compact Groups in this Sample
Compact groups are complex environments with heterogeneous properties and present a challenge to any kind of morphological or evolutionary classification; placing compact groups into evolutionary stages is more complex than for the two-galaxy interactions found in the analogous Toomre Sequence. As evidence of the difficulties in classifying HCGs, Verdes-Montenegro et al. note the lack of one-to-one correspondence between the presence of tidal features and the atomic gas content of Hickson Compact Groups. Ribeiro et al. (1998) classify compact groups in three separate families including (1) “real” compact groups, (2) core halo systems, and (3) parts of loose groups; this classification only reflects the galaxy populations and space densities. Verdes-Montenegro et al. (2001) proposed an evolutionary sequence based on the content and distribution of HI gas for Hickson Compact Groups: pre-interaction, shocked intergroup medium, and smooth intergroup medium. In this scenario, the evolutionary stage of a group is postulated to be associated with the HI deficiency of the group members and the group as a whole. HI deficiency is defined as , where the “predicted” HI mass of a galaxy is determined from the typical HI mass of a field galaxy of similar Hubble type and luminosity (Haynes & Giovanelli, 1984).
We wish to classify Hickson Compact Groups in a quantifiable way while also mitigating the effects of possible morphological misclassification of galaxies in determining a group’s evolutionary state. Here we adopt a variation of the Verdes-Montenegro et al. method for classification of the Hickson Compact Groups; as a proxy for evolutionary state, we use . Using dynamical masses calculated from velocity dispersions and median galaxy separations in Hickson et al. (1992), Ribeiro et al. (1998), and/or Zimer et al. (2003) and HI masses from Verdes-Montenegro et al. (2001) (with the exception of HCG 90, for which the HI mass was provided by J. Hibbard, private communication), each group was placed in one of three categories: (I) relatively HI-rich, , (II) intermediate HI, , and (III) relatively HI poor, . The boundaries of these categories are somewhat arbitrary and were chosen to divide our sample of groups roughly in equal thirds. The resulting classifications are listed in Table 1. Only two of the groups in our sample, HCG 16 and HCG 31, were explicitly classified by Verdes-Montenegro et al.; both of these groups were identified as “phase 2” in that paper. In the classification scheme used in this paper HCG 16 and HCG 31 are both type I (relatively HI rich).

The distributions of the Hubble types (using the convention of Haynes & Giovanelli, 1984) of the constituent galaxies with respect to group type are shown in Figure 7. The histogram resulting from the total sample of galaxies in the twelve HCGs studied in this program shows a clear bimodal structure, with peaks in the relative number of galaxies around Hubble type 0 and Hubble types 6-8. Given that only twelve groups are included in this sample, this histogram is remarkably consistent with the distribution of morphological types found in all HCGs (Hickson, Kindl, & Huchra, 1988). However, it is interesting to note that this distribution is distinctly different from general samples of galaxies such as the Third Reference Catalog (RC3, e.g. van den Bergh et al., 2002), which has a uni-modal distribution that peaks around type Sbc galaxies.
In Figure 7 it is clear that early Hubble types tend to be found in groups of type III, while late Hubble types are preferentially found in groups of type I. Galaxies in type II groups are relatively evenly distributed among Hubble types. These trends suggest that the degree to which a group is relatively gas rich or gas poor may simply reflect the Hubble types of a group’s constituent galaxies. However, the physical scenario may be more subtle than this, especially given that HCGs as a class appear to be gas deficient, and the causal relationship between a group’s galaxy content and gas properties is not straight forward.
We note that of the type I and type II groups in this sample, only one of them was detected in the X-ray survey of Ponman et al. (1996) (HCG 16, which is known to contain active galaxies), while all four of the type III groups were detected (HCG 42, HCG 48, HCG 62, and HCG 90). The relative contribution to a group’s total X-ray flux from the individual galaxies from the IGM is important to distinguish in this context. For example, HCG 42 and HCG 62 have bright emission from the IGM, while the X-ray emission HCG 90 is dominated by the contribution from individual galaxies. HCG 16 also has evidence for a faint IGM in addition to the contribution from AGN activity (Belsole et al., 2003). In fact, while all of the type III groups have X-ray detections, none of the galaxies in type III groups have strong infrared emission as seen in their SEDs shown in Figures A.1-A.12. This result is consistent with what is seen in brightest cluster galaxies in clusters without strong cooling flows by Egami et al. (2006). Those clusters frequently have evidence for AGN activity that apparently injects energy into the intracluster medium and prevents cooling; the large X-ray bubbles in HCG 62 indicate similar activity (e.g. Morita et al., 2006). In the case of type III groups in this sample, they could be observed as “gas deficient” in HI simply because their intra-group gas has largely been heated and ionized. There have been several interesting suggestions that a hot cluster ICM plays an important role in the truncation of star formation activity in clusters (e.g., Poggianti et al. 2004, Moran et al. 2006).
3 Results
3.1 The Infrared Colors of Galaxies in Hickson Compact Groups
The infrared colors of galaxies in the Hickson Compact Groups in this sample span a wide range of parameter space. Here we discuss trends and correlations that are apparent in this data set. Spitzer IRAC three-color (3.6m, 4.5m, and 8m) images are shown in Figures 1-6. The infrared colors of the galaxies in this sample are shown in Figures 8-13.
The near- to mid-IR colors of a source will largely be dependent on the temperature of the dust, the relative strength of the underlying stellar blackbody emission, and polycyclic aromatic hydrocarbon (PAH) emission, which can contribute significantly to three of the four IRAC bands (Draine & Li, 2006). The near-IR 2MASS observations at the J, H, and K-bands will largely be dominated by stellar blackbody emission with a possible contribution from very hot dust near the sublimation temperature ( K). Of the four IRAC bands, the only band that is not subject to a possible strong contribution by PAH emission is the 4.5m band. The strongest PAH contribution is expected in the 8.0m band. Emission in the 24m band is dominated by thermal emission from dust.
These three dominant components of emission in the infrared can, to some extent, be disentangled by examining the spectral energy distributions of galaxies. A source with emission dominated by hot dust will result in a K-band “excess”, and a rising continuum from 3.6m to 24m. A source with strong PAH emission will exhibit a falling spectral energy distribution from 3.6m to 4.5m and a rising spectral energy distribution from 4.5m to 8.0m. A source that is dominated by stellar light will have a spectral energy distribution that falls continuously from the near-IR to 24m with the Rayleigh-Jeans tail of the stellar blackbody emission.
3.1.1 IRAC colors

Figure 8 shows the IRAC colors of the galaxies, which we have separated into four quadrants that are divided by lines delineating whether the spectral energy distribution of a source is rising or falling with increasing wavelength for a given flux density ratio. Galaxies with emission dominated by stellar light with little dust or PAH emission are expected to be located in the lower left quadrant. For reference, we show an ellipse that indicates the region in this color space that would be occupied by unreddened main-sequence and giant stars along with a reddening vector that corresponds to .
Galaxies with active star formation and/or AGN activity are largely expected to be located on the top portion of this plot (e.g. Lacy et al., 2004); contributions to their SEDs from PAH emission or hot dust will result in stronger emission at 8m than at 4.5m. In order to differentiate the galaxies that fall in the top or bottom of this plot (reflecting the ratio of flux densities in the 8.0m and 4.5m bands) in Figures 9 and 10, we consistently use and symbols, respectively, to represent them. For comparison, we plot the galaxies from the KISS survey of star-forming galaxies as diamonds (Rosenberg et al., 2006), and the Spitzer First Look Survey (FLS) as dots (Lacy et al., 2004). The color selection criteria for AGN defined by Lacy et al. (2004) are indicated by a shaded area; while a significant fraction of the galaxies in the KISS sample are in this region of color space, only a handful of the galaxies in this sample fall in that area, including HCG 7A, HCG 7D, HCG 22C, HCG 31G, HCG 59A, and HCG 90A. However, the integrated colors of galaxies can obscure low-level AGN activity, and several of the galaxies in this sample are consistent with hosting AGN based on their nuclear colors (Gallagher et al., in prep).
The galaxies that fall in the lower left quadrant (e.g. dominated by stellar emission) are tightly clustered near the stellar ellipse. By contrast, the galaxies that fall in the upper right quadrant exhibit a significant spread in their colors, which is consistent with variable contributions from hot dust and PAH emission, plausibly reflecting different levels of star formation and/or AGN activity in the galaxies. As expected, the KISS sample is almost exclusively located in the upper portion of this plot.
A major difference between the IRAC colors of galaxies in this sample in and the FLS sample of Lacy et al. (2004) is the lack of a vertical plume in our data (as seen in Fig. 8). Lacy et al. attribute the galaxies in this plume to occupy this area of color space because they are at redshifts where the 6.2m PAH feature has shifted out of the 5.8m band and into the 8.0m band. The galaxies in the sample of HCGs presented here do not have redshifts sufficient to cause this effect (by definition, the sample was selected to have velocities km s-1).
There are a few curious features in the HCG galaxy distribution shown in Fig. 8, which are anomalous when compared to the FLS galaxy sample of Lacy et al. (2004). First, the HCG galaxies follow a relatively narrow finger along the upper edge of the AGN-starburst range of FLS galaxies. The narrowness of this trend suggests a reasonably tight relationship between PAH emission and dust emission in the HCG sample. Our comparison between the HCG galaxies and the FLS galaxies indicates an interesting dex offset between this finger and the one in the FLS plot. The vertical offset suggests that the HCG galaxies have stronger PAH emission in the 8.0m band than typical galaxies in the FLS. This could be due to generally elevated star formation and/or dust content. However, another very plausible explanation is simply that the bulk of the 8m PAH feature has red-shifted out of the 8m band for a significant fraction of the galaxies in the FLS, which would only require a moderate redshift of .
We also note that the gap that we see in our colors in Fig. 8 is not present in the FLS sample (Lacy et al., 2004, Figure 1). This sample of HCGs has a relative lack of galaxies that fall in the color space between systems dominated by stellar light and systems with significant hot dust and/or PAH contributions. This “gap” is not apparent in the FLS sample, which could be masked by the shifting of the 6.2m PAH feature between bands, as discussed above. However, this gap is also not seen in the galaxies of the SINGS sample, which are not at significant redshifts. The nature of this gap will be discussed further in the context of evolutionary stages in § 3.2.
3.1.2 Pan-Infrared colors

Figure 9 shows a color combination spanning the K-band to 24m. As in Figure 8, we have separated this color space into four quadrants with lines delineating whether the spectral energy distribution of a source is rising or falling with increasing wavelength for a given flux density ratio. All of the galaxies fall in the lower two quadrants. There is a clear trend in this color space for the sources identified in Figure 8 as having significant PAH emission and/or hot dust at 8m (indicated with the symbols) to also have relatively strong 24m emission in this plot. There is also a slight trend in the data for galaxies that have relatively strong thermal dust emission, as manifest in a higher log ratio, to also have relatively high ratios of log, which provides further evidence for a hot dust contribution.
3.1.3 2MASS colors

Figure 10 shows the near-IR colors of the galaxies in this sample of HCGs. As in Figures 8 and 9, the ellipse indicates the region of color space occupied by unreddened main-sequence and giant stars, and a reddening vector for is shown. The J-H and H-K colors of nearly all of the galaxies in the sample are consistent with being dominated by normal stellar populations that are either slightly reddened or alternatively affected by RGB and AGB star contributions to the integrated near-IR colors. The marginally outlying points may reflect an infrared excess due to a hot dust contribution. There is a trend in the near-IR colors for the sources identified in Figure 8 as having significant PAH emission at 8m (indicated with the symbols) to also have larger amounts of reddening and/or hot dust contributions. In addition these sources exhibit a much larger scatter in their near-IR colors than the sources identified in Figure 8 as having relatively weak PAH and/or hot dust emission (indicated with the symbols).
3.2 The Relationship Between Infrared Properties and Evolutionary State


In order to assess whether there are any trends in the infrared
properties of HCG galaxies with evolutionary state, we have divided
our sample into three types as discussed in § 2.1:
(I) ,
(II) ,
(III).
In other
words, type I groups are relatively the most gas-rich by mass, and
type III groups are relatively the most gas-poor by mass. In
Figures 11-13 these types are respectively
shown as stars, triangles, and squares. It is important to note that
these types are based on the properties of the group, whereas
the data points are individual galaxies within a group of a
given type. In other words, we are attempting to probe whether the
local properties of a member galaxy are related to the global
properties of the group in which it resides.
The infrared colors of the constituent galaxies appear to be related to the type of group in which they reside, and Figure 11 reveals a few striking trends. First, the HI gas-deficient group galaxies (type III) are relatively tightly clustered near the nexus of stellar colors, which is expected if there is little star formation, reddening, or AGN activity. The only outliers are known AGN galaxies in HCG 90 (galaxies A and D). The galaxies in more gas-rich groups span a much larger range in colors, with type I groups extending toward much redder colors, indicating higher levels of star formation and AGN activity overall. It is particularly noteworthy that the galaxies in this sample appear to follow a sequence in the infrared color-color space, with a relative gap in the galaxy population found at moderate colors (, and ).
This “sequence” and “gap” are more significant in comparison to the FLS galaxies and SINGS galaxies, which do not appear to exhibit such a gap. We note that this gap is reminiscent of the so-called “green-valley” that is apparent in color-magnitude diagrams of galaxy samples such as that presented by Hogg et al. (2004). This gap may also reflect the bimodal structure of the distribution of Hubble types seen in Fig. 7. If this gap in the HCG galaxies distribution is dynamical in nature, it suggests that star formation and AGN activity in HCG galaxies responds to the dynamical processes taking place on rapid timescales.
Trends similar to those in Fig. 11 are seen in Figure 12, with the median color of galaxies in type I, type II, and type III groups slightly offset. The near-IR colors alone, as shown in Figure 13, do not reveal any strong trends with group type. However, it is interesting to note that the outlying sources are either from groups of type I or type II, or known AGN galaxies (HCG 90A and HCG 90D).
The 24m luminosity of the member galaxies also exhibits a slight trend with group type, as shown in Figure 14. Galaxies in gas-rich groups of type I have the highest average 24m luminosity, while galaxies in gas-poor groups of type III have the lowest average 24m luminosity. This trend is in accord with type I groups hosting the most actively star-forming galaxies. Smith et al. (2007) examined 24m emission of the Arp interactive and field spiral samples of galaxies, but see little statistical evidence for a difference between those two populations. This is not necessarily inconsistent with the trends seen here, as our sample of compact groups contains many early type galaxies, which the Smith et al. (2007) sample was not designed to investigate.

4 Summary
We present new Spitzer observations of a sample of twelve Hickson Compact Groups comprising 45 galaxies and combine these with existing 2MASS survey observations. The goal of this project is to examine the relationship between the compact group environments and various physical processes. The main results of this paper are summarized below.
The amount of PAH emission, reddening, and 24m emission in each galaxy appear to be related; these observables tend to be similarly strong or weak for a given galaxy, reflecting the amount of recent star formation activity. Galaxies that strongly exhibit these features, also have much greater scatter in their colors, plausibly reflecting variable contributions to the integrated light from AGN and starburst activity; galaxies dominated by stellar light with little evidence for recent starburst and/or AGN activity have a much smaller range of infrared colors. The near-infrared (J,H,K) colors of the member galaxies are largely consistent with being dominated by slightly reddened normal stellar populations.
We separate the compact groups into three types based on the ratio of their dynamical and HI masses, with type I being the most gas-rich and type III being the most gas-poor. An analysis of morphological types indicates that late-type galaxies are preferentially found in type I groups, and early-type galaxies are preferentially found in type III groups. However, the causal relationship that underlies these trends is not clear. The near-IR colors do not show any strong trends with group type, although the outlying points with a K-band excess tend to be galaxies in type I and type II groups. Galaxies in type I groups tend to be the most actively star forming as manifest in their thermal-IR colors, with type II also showing a moderate level of activity, and type III groups are relatively quiescent. This result could be interpreted as type I groups actively consuming their gas (and forming stars), while type II groups may be generally somewhat further along in this process. Galaxies in type III groups tend to be relatively tightly clustered around the locus of colors for normal stellar populations, with the few outliers known to be active galaxies. The sensitivity of thermal infrared colors to neutral gas content suggests that the gas content of a Hickson compact group is at least as important as the neutral gas distribution in promoting or inhibiting star formation. Clearly both gas content and gas distribution are important to a group’s evolutionary state, although it is not yet clear how independent or related these parameters are.
The group type also appears to be reflected in the 24m luminosity of the member galaxies. Galaxies in groups of type I have the highest average 24m luminosity, while galaxies in groups of type III have the lowest average 24m luminosity. This trend is in accord with the most gas-rich groups hosting the most actively star-forming galaxies. Of the type I and type II groups in this sample, only one of them has an X-ray detection (HCG 16, which is known to contain active galaxies as well as faint X-ray emission from the IGM Belsole et al., 2003), while all four of the gas-poor groups have been detected in the X-ray (HCG 42, HCG 48, HCG 62, and HCG 90 Ponman et al., 1996). These results are consistent with the hypothesis that the missing HI gas in the most “deficient” groups may have been converted to X-ray emitting hot gas.
There are striking trends seen in this study between the ratio for an entire Hickson Compact Group and the infrared colors of the individual member galaxies, which suggest that the constituent galaxies in Hickson Compact Groups are related to the type of group in which they reside. However it is not clear from these observations whether the “gas-richness” of a group simply reflects its fraction of late-type galaxies, or whether the gas-richness of a group affects the constituent galaxy types. Clearly the morphology of the gas within a group must have a role, as pointed out by Verdes-Montenegro et al. (2001).
The galaxy sample here has characteristics that are distinctly different from the sample of galaxies in the Spitzer First Look Survey. Most notably, Hickson Compact Group galaxies exhibit a “gap” in infrared color space that is sparsely populated. This gap may suggest a rapid evolution of galaxy properties in response to dynamical effects in HCGs.
| HCG | J | H | K | 3.6m | 4.5m | 5.8m | 8.0m | 24m | |
|---|---|---|---|---|---|---|---|---|---|
| Galaxy | Morph | (mJy) | (mJy) | (mJy) | (mJy) | (mJy) | (mJy) | (mJy) | (mJy) |
| 2a | SBd | 27.9 | 37.0 | 24.7 | 15.1 | 10.7 | 21.3 | 54.1 | 115 |
| 2b | cI | 21.9 | 23.2 | 20.9 | 14.5 | 10.6 | 29.0 | 88.0 | 351 |
| 2c | SBc | 12.6 | 13.7 | 12.7 | 6.7 | 4.6 | 6.8 | 16.9 | 21.5 |
| 7a | Sb | 124 | 155 | 13. | 70.3 | 46.3 | 76.1 | 161 | 303 |
| 7bddThese galaxies were not cleanly seperated at the 1 contour level, and photometry was carried out using apertures defined by higher contour levels. | SB0 | 67.4 | 81.8 | 68.8 | 31.9 | 20.1 | 16.7 | 10.7 | 12.7 |
| 7c | SBc | 58.9 | 67.1 | 54.9 | 29.0 | 18.9 | 26.1 | 76.3 | 76.0 |
| 7dddThese galaxies were not cleanly seperated at the 1 contour level, and photometry was carried out using apertures defined by higher contour levels. | SBc | 31.5 | 34.1 | 29.7 | 11.1 | 7.5 | 13.1 | 19.6 | 12.0 |
| 16addThese galaxies were not cleanly seperated at the 1 contour level, and photometry was carried out using apertures defined by higher contour levels. | SBa | 151 | 186 | 159 | 85.6 | 57.1 | 100 | 279 | 409 |
| 16bddThese galaxies were not cleanly seperated at the 1 contour level, and photometry was carried out using apertures defined by higher contour levels. | Sab | 90.4 | 109 | 91.8 | 43.0 | 26.8 | 22.4 | 24.8 | 22.5 |
| 16c | Im | 73.7 | 90.9 | 82.9 | 65.9 | 48.1 | 177 | 576 | 1412 |
| 16d | Im | 63.3 | 81.7 | 72.0 | 47.7 | 40.3 | 105 | 338 | 1785 |
| 19a | E2 | 43.2 | 53.2 | 40.6 | 19.9 | 12.1 | 7.8 | 5.6 | 3.3 |
| 19b | Scd | 10.3 | 11.2 | 11.8 | 5.8 | 3.8 | 6.7 | 19.7 | 24.1 |
| 19c | Sdm | 5.8 | 8.3 | 5.1 | 2.7 | 1.8 | 2.1 | 5.1 | 6.4 |
| 22a | E2 | 305 | 371 | 297 | 142 | 84.5 | 53.8 | 38.2 | 13.9 |
| 22b | Sa | 20.6 | 26.4 | 20.5 | 9.3 | 5.8 | 3.3 | 2.5 | 1.1 |
| 22c | SBc | 24.0 | 25.2 | 20.5 | 11.6 | 7.8 | 12.2 | 18.7 | 29.4 |
| 31aceddThese galaxies were not cleanly seperated at the 1 contour level, and photometry was carried out using apertures defined by higher contour levels. | (pec) | 20.1 | 22.5 | 17.9 | 13.4 | 10.1 | 24.3 | 72.5 | 463 |
| 31bddThese galaxies were not cleanly seperated at the 1 contour level, and photometry was carried out using apertures defined by higher contour levels. | Sm | 3.9 | 4.1 | 3.5 | 1.8 | 1.4 | 1.5 | 4.3 | 16.6 |
| 31f | (Im) | 0.4 | 0.4 | 0.1 | 0.1 | 0.1 | 0.2 | 2.8 | |
| 31g | Im | 7.9 | 8.8 | 7.9 | 3.7 | 2.4 | 4.7 | 8.1 | 38.9 |
| 31q | (Im) | 1.2 | 1.5 | 0.9 | 0.5 | 0.3 | 0.3 | 0.5 | 0.7 |
| 42addThese galaxies were not cleanly seperated at the 1 contour level, and photometry was carried out using apertures defined by higher contour levels. | E3 | 373 | 451 | 372 | 177 | 108 | 76.8 | 40.1 | 33.6 |
| 42b | SB0 | 46.1 | 56.0 | 46.6 | 22.5 | 13.8 | 7.6 | 6.1 | 4.5 |
| 42cddThese galaxies were not cleanly seperated at the 1 contour level, and photometry was carried out using apertures defined by higher contour levels. | E2 | 58.0 | 70.9 | 55.4 | 27.2 | 17.0 | 10.8 | 6.6 | 2.8 |
| 42d | E2 | 8.0 | 9.1 | 8.1 | 3.4 | 2.1 | 1.1 | 0.8 | 0.4 |
| 48a ddThese galaxies were not cleanly seperated at the 1 contour level, and photometry was carried out using apertures defined by higher contour levels. | E2 | 306 | 367 | 297 | 142 | 88.3 | 75.4 | 44.0 | 16.1 |
| 48b d,ed,efootnotemark: | Sc | 42.1 | 47.0 | 37.7 | 19.5 | 14.6 | 23.5 | 69.1 | 81.9 |
| 48c eeGalaxies HCG 48b and HCG 48c may not be proper group members (see Ribeiro et al., 1998). | S0a | 16.2 | 21.3 | 18.6 | 7.9 | 4.9 | 3.3 | 2.1 | 0.8 |
| 48d | E1 | 8.8 | 10.4 | 8.1 | 3.9 | 2.6 | 1.4 | 1.0 | 0.4 |
| 59addThese galaxies were not cleanly seperated at the 1 contour level, and photometry was carried out using apertures defined by higher contour levels. | Sa | 22.5 | 23.4 | 19.4 | 12.1 | 10.2 | 14.6 | 38.9 | 453 |
| 59b | E0 | 10.5 | 12.1 | 10.2 | 4.3 | 2.8 | 1.7 | 1.1 | 0.6 |
| 59c | Sc | 3.6 | 4.2 | 3.0 | 1.7 | 1.1 | 1.4 | 3.3 | 3.6 |
| 59dddThese galaxies were not cleanly seperated at the 1 contour level, and photometry was carried out using apertures defined by higher contour levels. | Im | 2.6 | 4.4 | 3.4 | 1.8 | 1.2 | 1.8 | 4.4 | 12.7 |
| 61a | S0a | 141 | 188 | 145 | 68.2 | 42.1 | 26.8 | 26.0 | 20.5 |
| 61c | Sbc | 70.5 | 105 | 90.4 | 52.7 | 37.1 | 77.8 | 226 | 357 |
| 61d | S0 | 33.7 | 43.9 | 33.3 | 15.8 | 10.0 | 5.8 | 4.9 | 2.5 |
| 62addThese galaxies were not cleanly seperated at the 1 contour level, and photometry was carried out using apertures defined by higher contour levels. | E3 | 157 | 184 | 155 | 73.7 | 45.4 | 31.4 | 21.9 | 9.4 |
| 62bddThese galaxies were not cleanly seperated at the 1 contour level, and photometry was carried out using apertures defined by higher contour levels. | S0 | 64.0 | 76.9 | 63.5 | 29.3 | 17.7 | 11.5 | 8.4 | 3.6 |
| 62cddThese galaxies were not cleanly seperated at the 1 contour level, and photometry was carried out using apertures defined by higher contour levels. | S0 | 32.6 | 37.1 | 27.9 | 13.0 | 7.4 | 3.9 | 3.1 | 2.1 |
| 62d | E2 | 8.0 | 9.2 | 7.9 | 3.7 | 2.3 | 1.6 | 1.0 | 1.9 |
| 90a | Sa | 243 | 318 | 288 | 176 | 147 | 190 | 328 | |
| 90bddThese galaxies were not cleanly seperated at the 1 contour level, and photometry was carried out using apertures defined by higher contour levels. | E0 | 182 | 220 | 179 | 78.8 | 46.6 | 31.0 | 25.8 | 18.3 |
| 90cddThese galaxies were not cleanly seperated at the 1 contour level, and photometry was carried out using apertures defined by higher contour levels. | E0 | 164. | 198 | 155 | 74.0 | 44.5 | 27.6 | 21.7 | 9.1 |
| 90dddThese galaxies were not cleanly seperated at the 1 contour level, and photometry was carried out using apertures defined by higher contour levels. | Im | 152. | 271 | 218 | 96.7 | 61.8 | 54.5 | 121 | 209 |
Appendix A NOTES ON INDIVIDUAL HICKSON COMPACT GROUPS
A.1 HCG 2
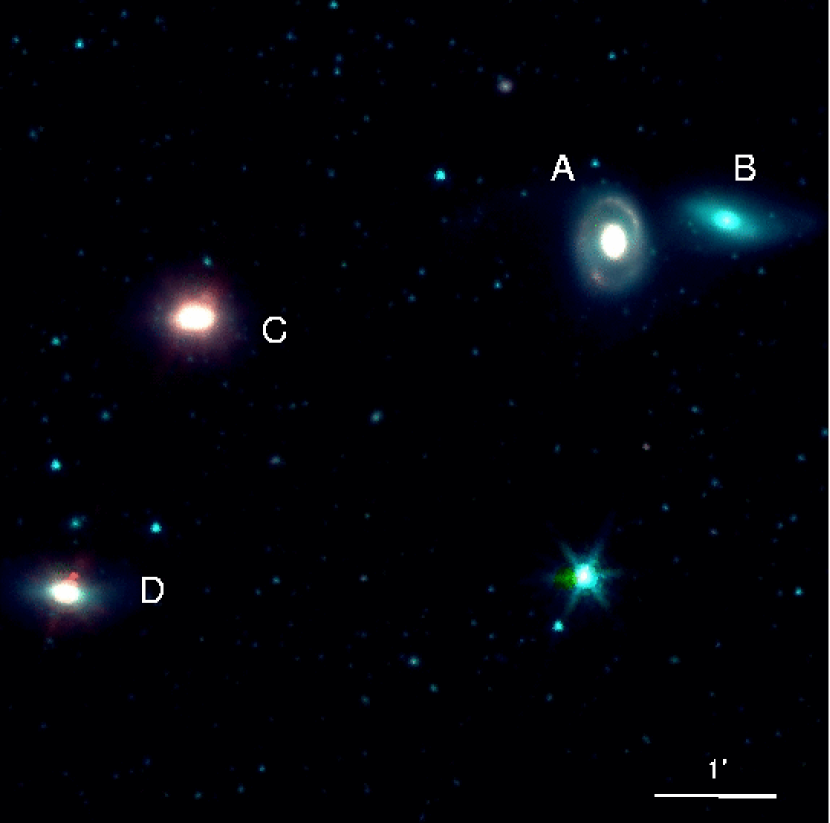
The spectral energy distributions for the galaxies in HCG 2 are shown in Figure 15. This group is classified as type I according to , indicating it is relatively gas-rich. Galaxy A hosts a number of bright star forming knots as evident by their 4.5m, 8.0m, and 24m emission. Galaxy B (MRK 552) is compact, but luminous in the infrared and the dominant source of 24m emission in the group. Galaxy C has a hint of low-level star formation to the west of its nuclear region. Galaxy D is a background source. All three have similar infrared SED’s that are typical of star-forming galaxies.
A.2 HCG 7
The spectral energy distributions for the galaxies in HCG 7 are shown in Figure 16. This group is classified as type II according to , indicating a moderate amount of gas is present in the group. Galaxy A (NGC 192) has a disturbed morphology with substantial infrared emission throughout. The nuclear region of galaxy A is a luminous 24m source. Galaxy B (NGC 196) is dominated by stellar light with little evidence of recent star formation. Galaxy C (NGC 201) has elevated 4.5m and 8.0m emission throughout the spiral arms, and the nuclear region stands out at 24m, possibly indicating low level AGN activity. Galaxy D (NGC 197) is slightly disturbed and appears to have a modest level of star formation.
A.3 HCG 16
The spectral energy distributions for the galaxies in HCG 16 are shown in Figure 17. This group is classified as type I according to , indicating it is relatively gas-rich. Ribeiro et al. (1998) observe this group to be a corehalo system, suggesting the compact group is part of a larger collapsing structure. Galaxies A (NGC 835, MRK 1021) and B (NGC 833) have extended tidal features visible in the 3.6m and 4.5m images without associated longer wavelength emission, suggesting very little star formation has been triggered in the tidal tails. Galaxy A does have a moderate level of star formation activity, but galaxy B is dominated by stellar light. Galaxies C (NGC 838, MRK 1022) and D (NGC 839) are quite luminous in the infrared, causing saturation and artifacts in the long exposure IRAC images; both have significant levels of 24m emission consistent with originating from nuclear point sources. Galaxies A, B, and D have previously been identified as active galaxies in this group (Ribeiro et al., 1996; Coziol et al., 1998; Turner et al., 2001). Mendes de Oliveira et al. (1998) conclude that both galaxies C and D have recently undergone major merger events based on their kinematics, double nuclei, and high infrared luminosities, which is consistent with these Spitzer results.
A.4 HCG 19
The spectral energy distributions for the galaxies in HCG 19 are shown in Figure 18. This group is classified as type II according to , indicating a moderate amount of gas present in the group. Galaxy A is dominated by stellar light. Galaxy B has moderate star formation activity throughout, and hosts a number of compact star forming knots in the distorted spiral arms. Galaxy C is quite diffuse, with a hint of elevated star formation on its south-west edge (facing the group). Galaxy D is a background object.
A.5 HCG 22
The spectral energy distributions for the galaxies in HCG 22 are shown in Figure 19. This group is classified as type II according to , indicating a moderate amount of gas present in the group. HCG 22 may be associated with a larger structure (Rood & Struble, 1994), although Ribeiro et al. (1998) identify it as a “real” compact group. Galaxies A (NGC 1199) and B (NGC 1190) are dominated by stellar light with little long wavelength emission. Galaxy C (NGC 1189) has extended clumpy star formation throughout its spiral arms with remarkably little associated stellar light, which is striking in the color images. Galaxies D (NGC 1191) and E (NGC 1192) are background objects.
A.6 HCG 31
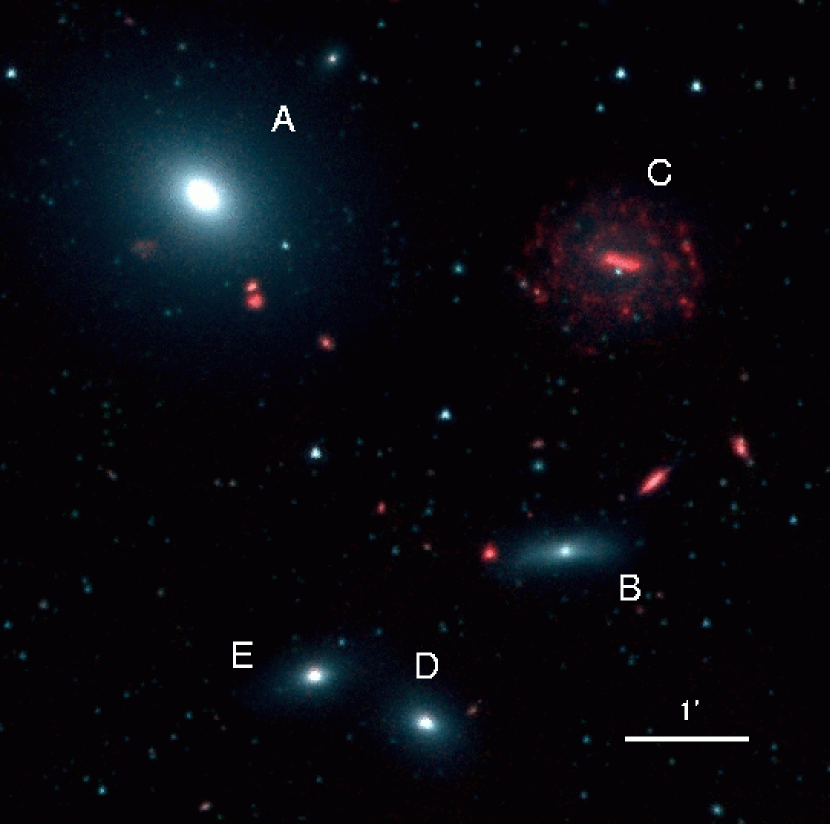
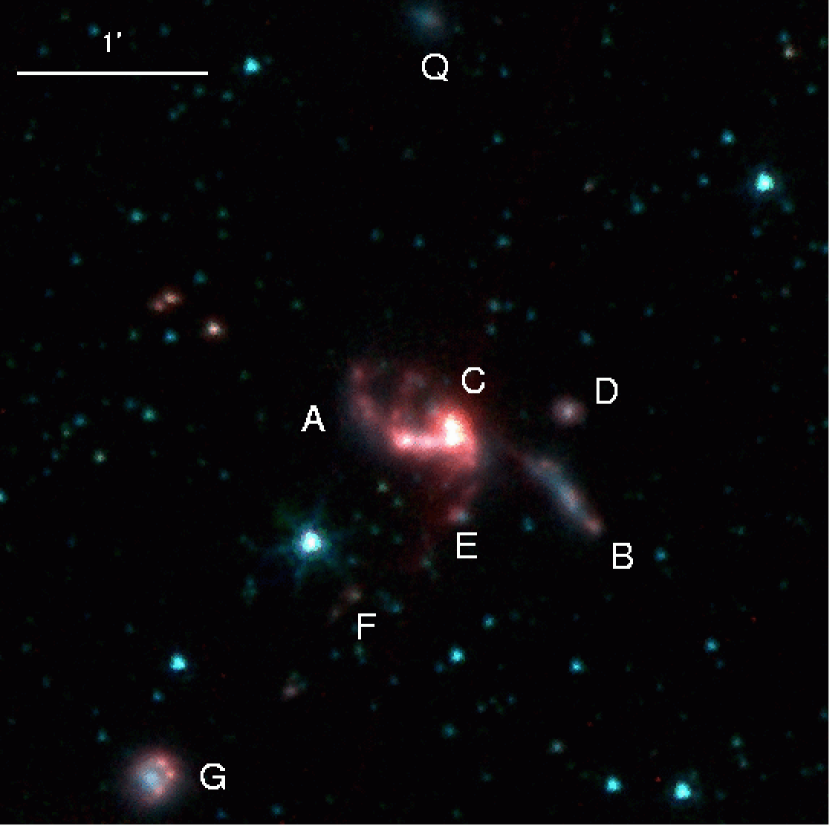
The spectral energy distributions for the galaxies in HCG 31 are shown in Figure 20. This group is classified as type I according to , indicating it is relatively gas-rich. HCG 31 is a highly disturbed with elevated levels of infrared emission throughout most the group. Due to the close interaction between galaxies A, C, and E, they were not separable at low contour levels and their photometry was combined into a single data point. Galaxy F was not detected in the 2MASS images at J,H, and K-bands, and galaxy Q was not detected at K-band. Galaxies A and C (collectively NGC 1741, MRK 1089) are undergoing the strongest interaction, and the location of their collision is a strong 24m source. Galaxy B has moderate infrared emission clumped in on the edges of its disk and nuclear region. Galaxy D is a background source. Galaxies E and F are possible tidal dwarfs, and have moderate levels of star formation. Galaxy F, in particular, is relatively luminous at 24m given its small size and faint near-IR and optical emission. Galaxy G (MRK 1090) has several star forming knots with moderate infrared emission on its north-west edge (facing the group). These results are generally consistent with conclusions based on optical observations of this group (e.g. Johnson et al., 1999; Johnson & Conti, 2000). Galaxy Q has been recently classified as a group member (Verdes-Montenegro et al., 2005), but appears to be dominated by stellar light and is not particularly disturbed in these infrared images.
A.7 HCG 42
The spectral energy distributions for the galaxies in HCG 42 are shown in Figure 21. This group is classified as type III according to , indicating that the group is relatively gas-poor. Ribeiro et al. (1998) identify HCG 42 as being part of a loose group. Galaxy A is also known as NGC 3091, and galaxy B is also known as NGC 3096. The galaxies in HCG 42 are all dominated by stellar light with little evidence for recent star formation activity. The lack of 24m emission from any of the group members suggests little AGN activity as well. A number of luminous infrared sources are apparent in the background of this group.
A.8 HCG 48
The spectral energy distributions for the galaxies in HCG 48 are shown in Figure 22. This group is classified as type III according to , indicating that the group is relatively gas-poor. HCG 48 is embedded in the larger galaxy group Abell 1060, and the kinematical analysis of Ribeiro et al. (1998) indicates that this group is divided into three sets of objects at slightly different velocities; galaxies A and D are associated, but galaxies B and C appear to be in different subgroups, in which case the reality of HCG 48 as a compact group is in question. We include these photometric measurements of galaxies A, B, C, and D in Table 2 for completeness, but exclude the data points from galaxies B and C in Figures 8-13. Galaxies A, C, and D are dominated by stellar light with little sign of recent star formation or AGN activity. Galaxy B has infrared emission from throughout the galaxy and moderate 24m emission associated with the nuclear region.
A.9 HCG 59
The spectral energy distributions for the galaxies in HCG 59 are shown in Figure 23. This group is classified as type II according to , indicating a moderate amount of gas present in the group. Galaxy A (IC 737) is point-like and quite luminous in the thermal infrared. Galaxy B (IC 736) is dominated by stellar light. Galaxy C has moderate infrared emission and appears to be slightly disturbed. Galaxy D is diffuse and highly disturbed, with clumps of infrared emission on its southern and northern edges. Galaxy E is a background object.
A.10 HCG 61
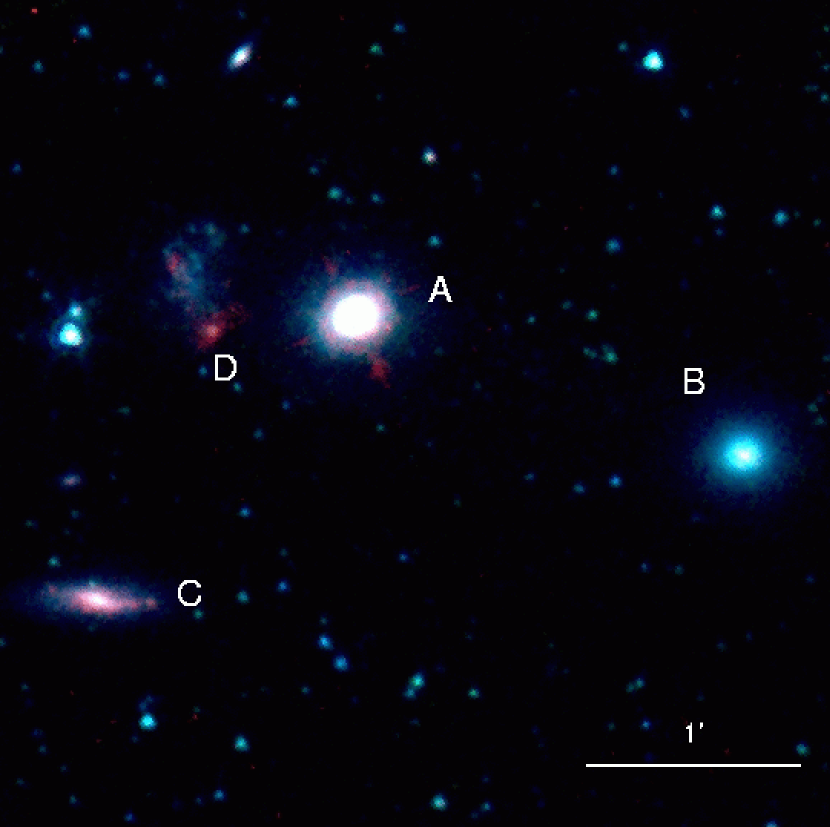
The spectral energy distributions for the galaxies in HCG 61 are shown in Figure 24. This group is classified as type I according to , indicating it is relatively gas-rich. Galaxies A (NGC 4169) and D (NGC 4174) are dominated by stellar light. Galaxy B (NGC 4173) is a foreground object. Galaxy C (NGC 4175) has a disturbed morphology near the nuclear region and has moderately strong nuclear 24m emission. Galaxies A and C have been identified as active galaxies (White et al., 1997).
A.11 HCG 62
The spectral energy distributions for the galaxies in HCG 62 are shown in Figure 25. This group is classified as type III according to , indicating that the group is relatively gas-poor. Ribeiro et al. (1998) identify HCG 62 as being part of a loose group. Galaxies A (NGC 4778) and B (NGC 4776) are strongly interacting, but are dominated by stellar light with little recent star formation activity, although galaxy B has a modest amount of 24m emission associated with its nuclear region. The kinematical properties of galaxy A (NGC 4778), including nuclear counter-rotation suggest that it may have undergone a minor merger (Spavone et al., 2006), although based on the relative lack of infrared luminosity, these Spitzer observations imply any such merger had little effect on star formation, perhaps indicating that the gas in these galaxies was already depleted. Galaxies C (NGC 4761) and D (NGC 4764) are also dominated by stellar light, with little evidence for recent activity.
A.12 HCG 90
The spectral energy distributions for the galaxies in HCG 90 are shown in Figure 26. This group is classified as type III according to , indicating that the group is relatively gas-poor. Ribeiro et al. (1998) identify HCG 90 as being part of a loose group. Due to the close interaction between galaxies B and D, they were not separable at low contour levels and their photometry was combined into a single data point. Galaxy D fell off the detector in the 24m observations, and is therefore lacking this data point. Galaxy A (NGC 7172) is somewhat disturbed and has clumpy infrared emission throughout the galaxy. Galaxies B (NGC 7176) and C (NGC 7173) are dominated by stellar light, with little evidence for recent activity. Galaxy D (NGC 7174) is fairly disturbed, with a spur of infrared emission originating from its western edge. The nuclear region of galaxy D is also a luminous 24m source. These results are consistent with the kinematic H observations of Plana et al. (1998), who conclude that galaxy D is a warm-gas reservoir in the group. Galaxies A and D have been identified as active galaxies by Coziol et al. (1998), and these are the outlying type III galaxies in Figs. 11-13.


References
- Allam et al. (1995) Allam, S., Assendorp, A.R. Longo, G., and Richter, G. 1995, P&SS, 43, 1371
- Appleton et al. (2006) Appleton, P.N., Xu, K.C., Reach, W., Dopita, M.A., Gao, Y., Lu, N., Popescu, C.C., Sulentic, J.W., Tuffs, R.J., Yun, M.S. 2006, ApJL, 639, 51
- Barton, de Carvalho, & Geller (1998) Barton, E.J., de Carvalho, R.R., & Geller, M.J. 1998, AJ, 116, 1573
- Belsole et al. (2003) Belsole, E., Sauvageot, J.-L., Ponman, T. J., Bourdin, H. 2003, A&A, 398, 1
- Bernardi et al. (2002) Bernardi, M., Alonso, M.,V., da Costa, L.N., Willmer, C.N.A., Wegner, G., Pellegrini, P.S., Rité, C., Maia, M.A.G. 2002, AJ123, 2990
- Bosma & Freeman (1993) Bosma, A. & Freeman, K.C. 1993, AJ, 106, 1394
- Coziol et al. (1998) Coziol, R. & Ribeiro, A.L.B., de Carvalho, R.R., & Capelato, H.V. 1998, ApJ, 493, 563
- de Carvalho et al. (1997) de Carvalho, R.R., Ribeiro, A.L.B., Capelato, H., & Zepf, S.E. 1997, ApJS, 110, 1
- Draine & Li (2006) Draine, B. T., & Li, A. 2006, ArXiv Astrophysics e-prints, arXiv:astro-ph/0608003
- Egami et al. (2006) Egami, E. et al. 2006, ApJ, 647, 922
- Fazio et al. (2004) Fazio, G. G., et al. 2004, ApJS, 154, 10
- Garcia et al. (1994) Garcia, A.M., Bottinelli, L., Garnier, R., Gouguenheim, L., Paturel, G. 1994, A&AS, 107, 265
- Haynes & Giovanelli (1984) Haynes, M. P. & Giovanelli, R. 1984, 89, 758
- Hickson (1982) Hickson, P. 1982, ApJ, 255, 382
- Hickson, Kindl, & Auman (1989) Hickson, P., Kindl, E. & Auman, J.R. 1989, ApJS, 70, 687
- Hickson, Kindl, & Huchra (1988) Hickson, P., Kindl, E., & Huchra, J.P. 1988, ApJ, 331, 64
- Hickson et al. (1989) Hickson, P., Menon, T.K., Palumbo, G.G.C., & Persic, M. 1989, ApJ, 341, 679
- Hickson et al. (1992) Hickson, P., Mendes de Oliveira, C., Huchra, J.P., & Palumbo, G.G. 1992, ApJ, 399, 353
- Hogg et al. (2004) Hogg, D.W. et al. 2004, ApJL, 601, 29
- Huchtmeier (1997) Huchtmeier, W.K. 1997, A&A, 325, 473
- Hunsberger, Charlton, & Zaritsky (1998) Hunsberger, S.D., Charlton, J.C., & Zaritsky, D. 1998, ApJ, 505, 536
- Johnson & Conti (2000) Johnson, K.E. & Conti, P.S. 2000, AJ, 119, 214
- Johnson et al. (1999) Johnson, K.E., Vacca, W.D., Leitherer, C., Conti, P.S., & Lipscy, S.J. 1999, AJ, 117, 1708
- Kaneda, Onaka, & Sakon (2005) Kaneda, H., Onaka, T., Sakon, I. 2005, ApJ 632, 83
- Lacy et al. (2004) Lacy, M. et al. 2004, ApJS, 154, 166
- Leon, Combes, & Menon (1998) Leon, S., Combes, F., & Menon, T.K. 1998, A&A, 330, 37
- Makovoz et al. (2006) Makovoz, D., Roby, T., Khan, I., Booth, H. 2006, Proceedings of the SPIE, Volume 6274
- Mendes de Oliveira & Hickson (1994) Mendes de Oliveira, C. & Hickson, P. 1994, ApJ, 427, 684
- Mendes de Oliveira et al. (1998) Mendes de Oliveira, C., Plana, H., Amram, P., Bolte, M., Boulesteix, J. 1998, ApJ, 507, 691
- Moran et al. (2006) Moran, S.M., Ellis, R.S., Treu, T., Salim, S., Rich, R.M., Smith, G.P., Kneib, J.-P. 2006, ApJ, 641, 97
- Morita et al. (2006) Morita, U., Ishisaki, Y., Yamasaki, N. Y., Ota, N., Kawano, N., Fukazawa, Y., & Ohashi, T. 2006, PASJ, 58, 719
- Nishiura et al. (2000) Nishiura, S., Shimada, M., Ohyama, Y., Murayama, T., Taniguchi, Y. 2000, AJ, 120, 1691
- O’Halloran (2002) O’Halloran, B., Metcalfe, L., McBreen, B., Laureijs, R., Leech, K., Delaney, M., Watson, D., & Hanlon, L. 2002, ApJ, 575,747
- Plana et al. (1998) Plana, H., Mendes de Oliveira, C., Amram, P., & Boulesteix, J. 1998, AJ, 116, 2123
- Poggianti et al. (2004) Poggianti, B.M., Bridges, T.J., Komiyama, Y., Yagi, M., Carter, D., Mobasher, B., Okamura, S., Kashikawa, N. 2004, ApJ, 601
- Ponman et al. (1996) Ponman, T.J., Bourner, P.D.J., Ebeling, H., & Bohringer, H. 1996, MNRAS, 283, 690
- Rieke et al. (2004) Rieke, G. H., et al. 2004, ApJS, 154, 25
- Rosenberg et al. (2006) Rosenberg, J.L., Ashby, M.L.N., Salzer, J.J., & Huang, J.-S. 2006, ApJ, 636, 742
- Ribeiro et al. (1996) Ribeiro, A.L.B., de Carvalho, R.R., Coziol, R., Capelato, H.V., Zepf, S.E. 1996, ApJL, 463, 5
- Ribeiro et al. (1998) Ribeiro, A.L.B., de Carvalho, R.R., Capelato, H.V., & Zepf, S.E. 1998, ApJ, 497, 72
- Rood & Struble (1994) Rood, H.J. & Struble, M.F. 1994, PASP, 106, 413
- Rubin, Hunter, & Ford (1991) Rubin, V.C., Hunter, D.A., & Ford, W.K. 1991, ApJS, 76, 153
- Severgnini & Saracco (2001) Severgnini, P. & Saracco, P. 2001, Ap&SS, 276, 749
- Skrutskie et al. (2006) Skrutskie, M.F. et al. 2006, AJ, 131, 1163
- Smith et al. (2007) Smith, B.J., Struck, C., Hancock, M., Appleton, P.N., Charmandaris, V., Reach, W.T. 2007, AJ, 133, 791
- Spavone et al. (2006) Spavone, M., Iodice, E., Longo, G., Paolillo, M., & Sodani, S. 2006, A&A, 457, 493
- Stein (1996) Stein, P. 1996, A&AS, 116, 203
- Sulentic (2001) Sulentic, J.W., Rosado, M., Dultzin-Hacyan, D., Verdes-Montenegro, L. Trinchieri, G., Xu, C., & Pietsch, W. 2001, AJ 122, 2993
- Turner et al. (2001) Turner, M.J.L. et al. 2001, A&A, 365, 110
- van den Bergh et al. (2002) van den Bergh, S., Abraham, R.G., Whyte, L.F., Merrifield, M.R., Eskridge, P.B., Frogel, J.A., & Pogge, R. 2002, AJ, 123, 2913
- Verdes-Montenegro et al. (2005) Verdes-Montenegro, L., Del Olmo, A., Yun, M.S., Perea, J. 2005, A&A, 430, 443
- Verdes-Montenegro et al. (2001) Verdes-Montenegro, L., Yun, M.S., Williams, B.A., Huchtmeier, W.K., del Olmo, A., & Perea, J. 2001, A&A 377, 812
- Verdes-Montenegro et al. (1998) Verdes-Montenegro, L., Yun, M.S., Perea, J., del Olmo, A., & Ho, P.T.P. 1998, ApJ, 497, 89
- White et al. (1997) White, R.L., Becker, R.H., Helfand, D.J., & Gregg, M.D. 1997, ApJ, 475, 479
- Xu et al. (2003) Xu, C.K., Lu, N., Condon, J.J., Dopita, M., & Tuffs, R.J. 2003, ApJ, 595, 665
- Xu, Sulentic, & Tuffs (1999) Xu, C., Sulentic, J.W., & Tuffs, R. 1999, ApJ, 512, 178
- Yun (1997) Yun, M.S., Verdes-Montenegro, L., del Olmo, A., & Perea, J. 1997, ApJ, 475, 21
- Zepf et al. (1991) Zepf, S. E., Whitmore, B. C., & Levison, H. F. 1991, ApJ, 383, 524
- Zimer et al. (2003) Zimer, M.E., Zabludoff, A.I., & Mulchaey, J.S. 2003, Ap&SS, 285, 37