Anomalous metallic state of Cu0.07TiSe2: an optical spectroscopy study
Abstract
We report an optical spectroscopy study on the newly discovered superconductor Cu0.07TiSe2. Consistent with the development from a semimetal or semiconductor with a very small indirect energy gap upon doping TiSe2, it is found that the compound has a low carrier density. Most remarkably, the study reveals a substantial shift of the ”screened” plasma edge in reflectance towards high energy with decreasing temperature. This phenomenon, rarely seen in metals, indicates either a sizeable increase of the conducting carrier concentration or/and a decrease of the effective mass of carriers with reducing temperature. We attribute the shift primarily to the later effect.
pacs:
78.20.-e, 74.25.Gz, 72.80.GaCharge density waves (CDW) and superconductivity are two important broken symmetry states in solids. The interplay between the two states has been a topic of central interest in condensed matter physics. Among various CDW materials, layered 1-TiSe2 is particularly interesting. The compound shows a lattice instability around 200 K, below which it enters into a commensurate CDW phase associated with a () superlatticeWilson1 ; Wilson2 ; Salvo . Unlike the case of most CDW materials, the CDW transition in this compound is not driven by Fermi surface nesting. The ground state is believed to be either a semimetal or a semiconductor with a very small indirect gapBachrach ; Traum ; Anderson ; Pillo ; Kidd ; Rossnagel ; Cui ; Li . It has recently been reported that, upon controlled intercalation of Cu into 1-TiSe2 to yield CuxTiSe2, the CDW transition is continuously suppressed, and a superconducting state emerges near x=0.04, with a maximum Tc of 4.15 at x=0.08Morosan . This is the first superconducting system realized in the 1T structure CDW-bearing family. The CDW-superconductivity phase diagram developed for CuxTiSe2 is analogous to the antiferromagnetism-superconductivity phase diagram found for the high-temperature superconductors. The system offers a good opportunity to study the evolution of competing electronic states from CDW to superconductivity.
Recently, high quality single crystals have been successfully grown for the system. A detailed study of the superconducting properties has been performed on Cu0.07TiSe2 single crystalsMorosan2 . It is of interest to investigate the electronic properties of the doped metallic phase. In this letter, we report the first optical study on the superconducting compound Cu0.07TiSe2. Consistent with the development from a semimetal or semiconductor with a very small indirect energy gap upon doping, the study reveals that the compound has a low carrier density. Most remarkably, a substantial shift of the plasma edge in reflectance towards high energy with decreasing temperature is observed. This phenomenon, rarely seen in metals, indicates either a sizeable increase of the conducting carrier concentration or/and a decrease of the effective mass of carriers with reducing T. We conclude that the shift is mainly due to the later effect.
Superconducting single crystals of Cu0.07TiSe2 (T4K) with optically flat surfaces were grown via chlorine vapor transport, as described previouslyMorosan2 . The frequency-dependent reflectance spectra R() at different T were measured by a Bruker IFS 66 v/s spectrometer in the range from 50 to 25,000 cm-1 and a grating-type spectrometer from 20,000 to 50,000 cm-1 . The sample was mounted on an optically black cone on the cold-finger of a He flow cryostat. An in situ gold (50 15,000 cm-1) and aluminum (9,000 50,000 cm-1) overcoating technique was employed for reflectance measurements. The Kramers-Kronig transformation of R() was used to obtain the other optical response functions. A Hagen-Rubens relation was used for low frequency extrapolation, and a constant extrapolation for high-frequency to 300,000 cm-1 followed by a function of was used for the higher energy side.
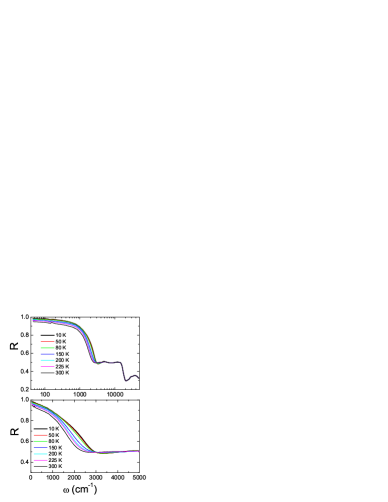
Fig. 1 shows the reflectance spectra at different temperatures: (a) R() spectra over very broad energy scale from 50 to 50,000 cm-1 on a logarithmic scale; (b) the spectra in an expanded plot over the frequency range from 50 cm-1 to 5,000 cm-1 . The R() values at low are rather high and increase further with decreasing T. This is a typical metallic response. With increasing , R() drops quickly to a minimum value near 3,000 cm-1 , usually referred to as the ”screened” plasma edge.Li The relatively low edge position reveals a low carrier density. Most surprisingly, the plasma edge was found to display a substantial shift towards higher frequencies (i.e. a blueshift) with decreasing T. Above the edge frequency, the reflectance becomes roughly T-independent. Near 15,000 cm-1 , there is another edge structure in R(), which does not originate from the free-carrier plasmon, but is caused by an interband transition. Besides these features, a phonon structure near 140 cm-1 can be clearly observed at high T. The feature weakens at low T due to increased screening by free carriers.
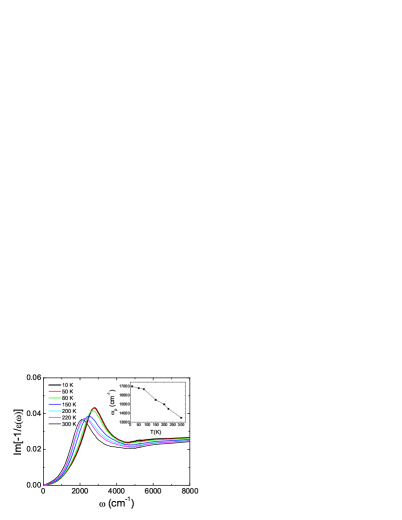
The formation of the plasma edge and its evolution with T is also reflected in the energy loss function, , as shown in Fig. 2. In the energy loss function, the screened plasma frequency () corresponds to the peak position, while the carrier damping (or scattering rate) is linked to the peak width. We can see clearly that, as T decreases from 300 K to 10 K, the major change is the blueshift of the screened plasma frequency.
To analyze the variation of the carrier density and its damping quantitatively, we fit the experimental reflectance to a simple Drude-Lorentz model:Degiorgi2
| (1) |
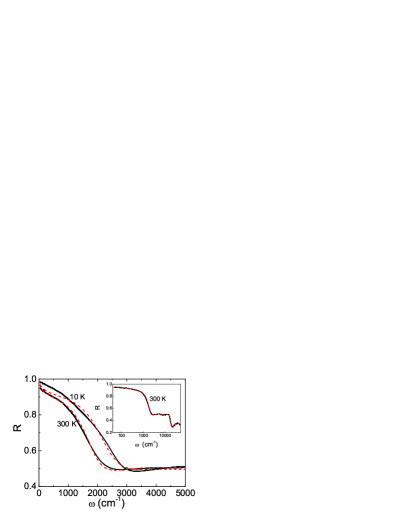
The model includes a Drude term and two Lorentz terms, which approximately capture the contributions by free carriers and interband transitions. A comparison of the measured and calculated curves at 300 K and 10 K is shown in Fig. 3. In the inset, the experimental and calculated spectra at 300 K are displayed over broad frequency range. We find that this simple model can reasonably reproduce the curves. This is the case particularly for the spectrum at 300 K. At 10 K, the calculated curve deviates from the experimental spectrum at low . This is understandable, considering that a constant parameter for scattering rate, 1/ in the Drude term, is used for fitting. In reality, the carrier scattering rate (damping) may be -dependent. The unscreened plasma frequencies, of the Drude term, obtained at different T are shown in the inset of Fig. 2. The plasma frequency increases steadily from 13,500 cm-1 to 17,000 cm-1 with decreasing T, roughly a 20 increase. The scattering rate keeps roughly constant with 1/800-850 cm-1 . In the analysis, the two Lorentz terms modelling the interband transitions are centered at 6,500 cm-1 and 14,500 cm-1 , respectively. The epsilon infinity obtained is =18. Note that the value of the unscreened plasma frequency is fairly large, this is mainly due to the very small value of the effective mass. An estimation of the effective mass will be given below.
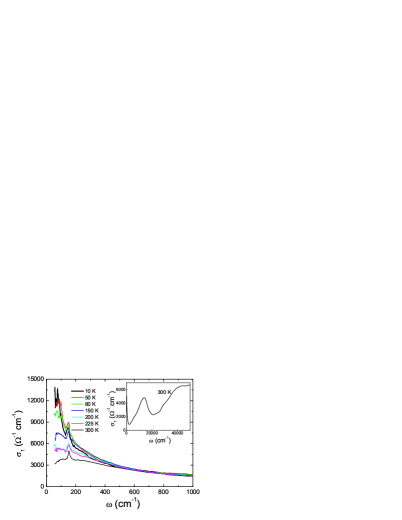
Figure 4 shows the optical conductivity ) below 1,000 cm-1 at different T. A Drude-like conductivity is present at low , and its spectral weight (i.e. the area under the ) curve) increases with decreasing temperature. This is expected, as the spectral weight of Drude-like conductivity is linked to effective conducting carrier density, consistent with the T-dependent evolution of both the reflectance and energy loss function spectra presented above. The inset shows the room-T ) over a broad energy range. Besides the Drude component at low frequency, there exist several interband transition structures. The interband transition near 6,500 cm-1 appears as a weak shoulder of the prominent peak near 14,500 cm-1 . Stronger structures also appear at frequencies above 20,000 cm-1 . All these features can be attributed to interband transitions from occupied Se 4p bands to unoccupied parts of Ti 3d bands in different momentum directions in K-spaceZunger ; Reshak .
From the data presented above, we can see that the most striking property of this doped CDW material is the blueshift of the plasma frequency with decreasing T. Such a phenomenon is rarely seen in metals. To our knowledge, europium hexaboride (EuB6) is the only example known to date showing a similar blueshift of the plasma edgeDegiorgi . However, EuB6 enters into an ferromagnetically ordered state below T16 K: the blueshift of the plasma edge occurs only when the compound is cooled through the ferromagnetic transition. Moreover, the plasma frequency in EuB6 shifts to higher energy when a magnetic field is applied. Thus it is believed that the effect is related to the reduced scattering by spin ordering, or undressing effect as explained by Hirsch.Hirsch Cu0.07TiSe2 is, however, a superconductor and does not have any magnetic ordering.
It is well known that the plasma frequency is determined by the charge carrier density and the effective mass. In the case of a single band, , the observed blueshift indicates either a sizeable increase of carrier density or/and a reduction of the effective mass of the conducting charge carriers. However, it is unlikely that the carrier density changes with T. The carrier density is a quantity controlled by the valence electrons offered by constituent atoms, which should not change with T if the crystal structure does not undergo a symmetry breaking transition that could lead to a change of the number of electrons per unit cell. One exception is a metal or semimetal with very low Fermi temperature () due to a small band crossing EF near its top or its bottom; in that case the carrier number could be changed by thermal activationHalperin . However, the number of such thermally activated carriers can only decrease with decreasing T, opposite to the trend observed here. Very recently, Hall effect measurements have been reported for Cu-doped TiSe2 crystals.Wu Indeed, it was found that the Hall coefficient RH changes with T only for lightly Cu-doped samples, where CDW transitions exist. For the heavily Cu-doped samples, such as superconducting Cu0.07TiSe2, RH is T-independent, which therefore rules out the possibility of a T-dependent carrier density.
As the carrier density does not change with T, we are left with the possibility that the effective mass of charge carriers decreases with decreasing T. From our observed plasma frequencies and the Hall coefficient resultsWu , we estimate that a mass reduction, from m∗=0.55me to 0.35 me, occurs in Cu0.07TiSe2 on cooling from 300 to 10 K. This behavior is in sharp contrast to many so-called strongly correlated electron systems that show an enhanced carrier effective mass at low T due to a many-body renormalization effectDegiorgi2 ; Wang . In order to get insight into this issue, it is necessary to examine the evolution of the band structure with Cu intercalation. The parent compound 1T-TiSe2 is a well known CDW material. Its ground state is revealed to be either a low carrier density semimetal or a semiconductor with a very small indirect gapZunger ; Bachrach ; Traum ; Anderson ; Pillo ; Kidd ; Rossnagel ; Cui ; Li . With the intercalation of Cu1+ into the structure, extra electrons are doped into the system. Within a rigid band picture, this will raise the chemical potential. Indeed, recent ARPES experiments indicate that Cu-intercalation places the bottom of the Ti-3d electron band near the L-point further below EFQian ; Zhao . This electron band dominates the electronic properties, in agreement with the negative Hall and Seebeck coefficients seen in transport experimentsMorosan ; Wu .
It is noted that the electrons near L-points couple strongly with lattice.Holt Then, a T-dependent electron-phonon coupling may cause a change of carrier effective mass. As the phonon number decreases with decreasing T, a reduced scattering of electrons from phonons (i.e. a mass reduction) is expected. In early studies on nontransition metals, such as Zn, a temperature shift of the mass renormalization arising from the electron-phonon interaction was observedSabo and well explained theoretically by Allen and Cohen.Allen However, this ordinary electron-phonon interaction has only a very small effect on the mass shift. It can not explain the substantial change observed here. In fact, the L phonons are linked to the structural instability in the parent and slightly Cu-intercalated compounds. If strong phonon softening takes place at low T, one would expect to see an enhanced incoherent low-energy quasiparticle, opposite to the ordinary effect. Indeed, even for the present x=0.07 compound without a static CDW instability, recent ARPES experiments indicate that the low-T EDC (energy distribution curve) quasiparticle peak of the L pocket at a fixed k-point near EF does not become sharper after removing thermal effects.Qian2 Thus, a naive picture for a reduced electron-phonon interaction is not applicable here.
We propose following mechanism, which involves a T-induced band effect, for the mass change in this compound. We note that, for a system with a constant carrier density, the chemical potential is not fixed but shifts up with decreasing T when the Fermi energy of the system is not high. Assuming a degenerate electron gas for the metallic phase, the chemical potential has the following relation with T, . For a usual metal, the Fermi temperature is very high, and the T-induced change in in the range 0-300 K is negligible. However, for the present case, the Fermi energy is rather low, about 80-100 meV at 300 K.Qian2 Then we expect to have an upward shift of chemical potential by about 5-10 for T decreasing from 300 K to 0 K. If the effective mass of electrons is different along the dispersive band, a change of effective mass at EF could be caused by a chemical potential shift. As the L point is linked to the lattice instability, the electrons at the L point experience the strongest scattering. Away from the L point, along the dispersive band, the scattering would be significantly reduced. Indeed, from the ARPES experiment the EDC width at the L point (the band minimum) is much broader than other points away from the L point along the dispersive band.Qian ; Zhao Thus an upward shift of chemical potential with decreasing T, driving the Fermi crossing point further away from the L point, would lead to a relatively smaller effective mass at EF.
To summarize, we performed optical spectroscopy study on a newly discovered superconductor Cu0.07TiSe2. The study reveals it to be a low-carrier density metal, consistent with the development from a semimetal or semiconductor with a small indirect gap upon doping. Surprisingly, the data reveal a substantial shift of the plasma edge in reflectance towards high energy with decreasing T. This phenomenon, rarely seen in metals, indicates either a sizeable increase of the conducting carrier concentration or/and a decrease of the effective mass of carriers with reducing T. Our analysis indicates that the blueshift of the plasma frequency in optics is mainly caused by the later effect.
We acknowledge very helpful discussions with Z. Q. Wang, L. Yin, D. L. Feng, Q. H. Wang and Lu Yu. This work is supported by National Science Foundation of China, the Knowledge Innovation Project of Chinese Academy of Sciences, and the Ministry of Science and Technology of China (973 projects). MZH and RJC acknowledge partial support through NSF(DMR-0213706) and U.S.DOE/DE-FG-02-05ER46200.
References
- (1) J. A. Wilson and A. D. Yoffe, Adv. Phys. 18, 193 (1969).
- (2) J. A. Wilson, F. J. Di Salvo, and S. Mahajan, Adv. Phys. 24, 117 (1975).
- (3) F. J. Di Salvo, D. E. Moncton, and J. V. Waszczak, Phys. Rev. B 14, 4321 (1976).
- (4) R. Z. Bachrach, M. Skibowski, and F. C. Brown, Phys. Rev. Lett. 37, 40 (1976).
- (5) M. M. Traum, G. Margaritondo, N. V. Smith, J. E. Rowe, and F. J. Di Salvo, Phys. Rev. B 17, 1836 (1978).
- (6) O. Anderson, R. Manzke, and M. Skibowski, Phys. Rev. Lett. 55, 2188 (1985).
- (7) Th. Pillo, J. Hayoz, H. Berger, F. Levy, L. Schlapbach, and P. Aebi, Phys. Rev. B 61, 16213 (2000).
- (8) T. E. Kidd, T. Miller, M. Y. Chou, and T.-C. Chiang, Phys. Rev. Lett. 88, 226402 (2002).
- (9) K. Rossnagel, L. Kipp, and M. Skibowski, Phys. Rev. B 65, 235101 (2002).
- (10) X. Y. Cui, H. Negishi, S. G. Titova, K. Shimada, A. Ohnishi, M. Higashiguchi, Y. Miura, S. Hino, A. M. Jahir, A. Titov, H. Bidadi, S. Nigishi, H. Namatame, M. Taniguchi, and M. Sasaki, Phys. Rev. B 73, 085111 (2006).
- (11) G. Li, W. Z. Hu, D. Qian, D. Hsieh, M. Z. Hasan, E. Morosan, R. J. Cava, N. L. Wang, cond-mat/0703167, Phys. Rev. Lett. (in-press).
- (12) E. Morosan, H. W. Zandbergen, B. S. Dennis, J. W. G. Bos, Y. Onose, T. Klimczuk, A. P. Ramirez, N. P. Ong and R. J. Cava, Nature Phys. (London) 2, 544 (2006).
- (13) E. Morosan, Lu Li, N. P. Ong, and R. J. Cava, Phys. Rev. B 75, 104505 (2007).
- (14) L. Degiorgi, Rev. Mod. Phys. 71, 687 (1999).
- (15) A. Zunger and A. J. Freeman, Phys. Rev. B 17, 1839 (1978).
- (16) A. H. Reshak and S. Auluck, Phys. Rev. B 68, 245113 (2003).
- (17) L. Degiorgi, E. Felder, H. R. Ott, J. L. Sarrao, and Z. Fisk, Phys. Rev. Lett. 79, 5134 (1997). S. Broderick, B. Ruzicka, L. Degiorgi, H. R. Ott, J. L. Sarrao, and Z. Fisk, Phys. Rev. B 65, 121102 (2002). G. Caimi, A. Perucchi, L. Degiorgi, H. R. Ott, V. M. Pereira, A. H. Castro Neto, A. D. Bianchi, and Z. Fisk, Phys. Rev. Lett. 96, 016403 (2006).
- (18) J. E. Hirsch, Phys. Rev. B 62, 14131 (2000).
- (19) B. I. Halperin and T. M. Rice, Rev. Mod. Phys. 40, 755 (1968).
- (20) G. Wu, H. X. Yang, L. Zhao, X. G. Luo, T. Wu, G. Y. Wang and X. H. Chen, cond-mat/0703645 (Phys. Rev. B, in-press).
- (21) N. L. Wang, J. J. McGuire, T. Timusk, R. Jin, J. He, and D. Mandrus, Phys. Rev. B 66, 014534 (2002).
- (22) D. Qian, D. Hsieh, L. Wray, E. Morosan, N. L. Wang, Y. Xia, R. J. Cava, and M. Z. Hasan, Phys. Rev. Lett. 98, 117007 (2007).
- (23) J. F. Zhao, H. W. Ou, G. Wu, B. P. Xie, Y. Zhang, D. W. Shen, J. Wei, L. X. Yang, J. K. Dong, X. H. Chen, and D.L. Feng, cond-mat/0612091 (unpublished).
- (24) M. Holt et al., Phys. Rev. Lett. 86, 3799 (2001).
- (25) Jesse J. Sabo, Jr, Phys. Rev. B 1, 1325 (1970); S. Auluck, Phys. Rev. B 9, 5334 (1974).
- (26) P. B. Allen and M. L. Cohen, Phys. Rev. B 1, 1329 (1970).
- (27) D. Qian, et al. unpublished.