THERMINATOR simulations and PHENIX images of a heavy tail of particle emission in 200 GeV Au+Au collisions
Abstract
Correlation between emitted particles from a thermalized medium carry important information about the space-time extent and the dynamics of the particle emitting source. Pion emission source functions have been measured in PHENIX using an imaging technique, and it has been found that it contains a heavy (power-law) tail. It leads us to the assumption that there is a halo of secondary pions, surrounding the core system that undergoes the hydrodynamical evolution. THERMINATOR, a Monte Carlo event generator designed for studies in relativistic heavy-ion collisions is used to model and investigate the influence of resonance decays on the tail of particle emission source. It lacks the implementation of rescattering, which, as we have learnt from previous Hadron Rescattering Code simulations, is a possible explanation of the power-law tail. Our studies also have shown that none of the pion sources alone are responsible for the tail: either the resonance decays or rescattering or a combination of these effects is a possible cause of the heavy tail.
1 Introduction
Correlation between identical pions emitted from a thermalized source with similar momenta is due to the bosonic nature of the pions. The phenomenon is often referred to as Bose-Einstein Correlation (BEC). The correlation functions carry important information about the space-time extent and the dynamics of the particle emitting source. R. Hanbury Brown and R. Q. Twiss used the bosonic correlation of particles to measure the angular diameter of distant stars [1]. BEC, or the HBT effect has become an important tool in high energy physics. In most heavy ion experiments there is enough statistics to measure the two- and three-particle correlation function of charged pions. We define the correlation function as
| (1) |
Here and are the four-momenta of the emitted particles, is the single particle momentum distribution, is the two-particle momentum distribution. To raise the statistics, one integrates over some components of , . From the experimental point of view the adopted definition is
| (2) |
the number of pairs with relative momentum from the same event divided by the number from mixed events. This is measured directly in experiments, and it must not to be confused with the ideal Bose-Einstein correlation function without any final state effects, . In our notation is the invariant relative momentum of the pair, which is equal to in the pairs c.m.s. frame. The definition of is: .
In the approximate case when multi-particle correlation effects are negligible, the BEC has good theoretical description even in the case when final state interactions (FSI) play important role. The two-particle correlation function of the pions can be calculated from the source function as follows [2]:
| (3) |
where is the symmetrized final state two-particle outgoing wave function. In case of Coulomb-interaction, this has an analytic form [3, 4]. With the imaging method (by inverting this integral equation) one can determine the source function. If we assume spherical symmetry, then depends only on .
2 PHENIX Source Imaging
Emission source functions have been extracted from correlation functions constructed from charged pions produced at mid-rapidity in Au+Au collisions at [5]. A model-independent imaging technique developed by Brown and Danielewicz [6] has been carried out (See Fig. 1). The source parameters extracted from low PHENIX data give the indication of a long tail, which differs from that of a Gaussian distribution.
![[Uncaptioned image]](/html/0706.4409/assets/x1.png)
|
|
The aim of this talk was to present our investigations carried out with THERMINATOR and HRC Monte Carlo simulatons, that concluded in possible kinematic explanations of the long-range components of the radial source function seen in PHENIX.
3 Hadron Rescattering
It has been shown [7, 8] that calculations based on a hadronic rescattering model agree reasonably well with experimental results on single particle spectra, elliptic flow, HBT radii in Au+Au collisions at RHIC energies. The model we use here to compare PHENIX data with is Tom Humanic’s Hadronic Rescattering Calculations. The model deals with the 8 most abundant resonances and simulates their decays and rescattering.
Simulated source of charged pions is discussed in three groups, determined by time of creation. The core consists of the primordial particles and the decay products of the short lived resonances. The secondary pion sources of long lived resonances are referred to as the halo, while the decay products of the meson make up a separate class (see Table 1).
| Group | Lifetime | Components in HRC |
|---|---|---|
| core | primordial , | |
| omega | ||
| halo |
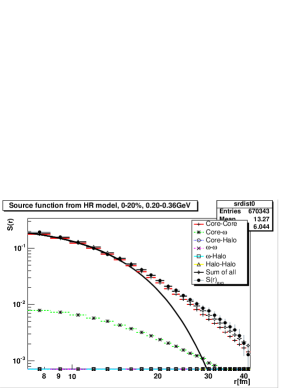
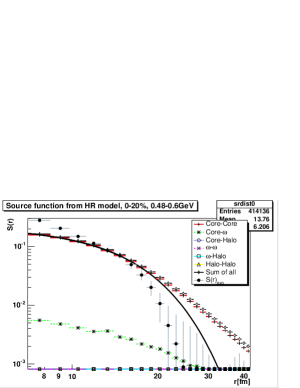
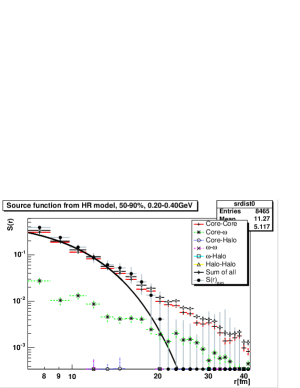
On Fig. 2, note the excellent agreement between PHENIX data and HRC simulation in the central, low case. The agreement is also acceptable in the full range for the peripheral low case. However, HRC fails to describe the dependence of the source.
Further investigations have shown that the does not account for the heavy tail in the simulation. Core-core pairs themselves have a power-law tail in the distribution. In the HRC code, rescattering goes on until it self-quenches. The mean free path increases strongly as the system expands, and rescattering in such a time dependent mean free path system corresponds to an anomalous diffusion. Anomalous diffusion is known to lead to power-law tailed distribution, as stated by a generalization of the Central Limit Theorem [9, 10].
4 Single Freezeout with THERMINATOR
THERMINATOR—A Thermal Heavy Ion Generator [11], based on the Cracow Single Freezeout Model [12] was used for the following simulations. In this model, freezeout of the partonic matter occurs on a single space-time surface, governed by universal thermodynamic parameters. Particle distribution is determined by the thermodynamical equilibrium. Particles propagate freely and the decay of 385 resonances is fully implemented. In opposition to the HRC simulation, rescattering effects are neglected here.
4.1 PHENIX source simulated
THERMINATOR simulation provides a flat rapidity distribution. Several checks were done to verify that a realistic distribution and spectrum of particles is generated.
Centrality can not be directly set in THERMINATOR, but through the parameters and , where stands for a radius of a boost invariant axially symmetric cylinder, while denotes the proper time of a simultaneous freezeout and hadronization [13]. Although fitted parameters for the spectra of all four RHIC experiments including PHENIX were published, PHENIX spectra is not well described by THERMINATOR, being primarily developed for, and tuned to STAR. Thus we used the parameters corresponding to STAR spectrum fits. This indicates that THERMINATOR might be able to show much better agreement with data with further tuning. The central data region has been reproduced using simulated events from the three most central regimes in proportion to their span. The regime was substituted with equal number of events simulated in the regimes of and .
A separate set of events were simulated for each centrality bin of 5% for central, and 10% for peripheral collisions. Then these sets were concatenated to make up the wider regimes of PHENIX data. THERMINATOR was able to reproduce the centrality dependence of the data. It is also capable to describe the dependence to a much higher accuracy than HRC does, although there is a significant discrepancy at the higher region. (See Fig. 3).
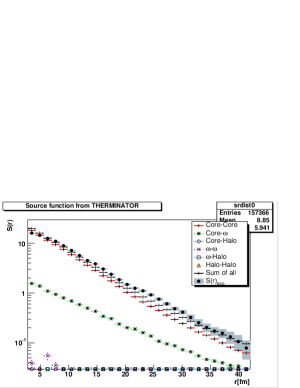
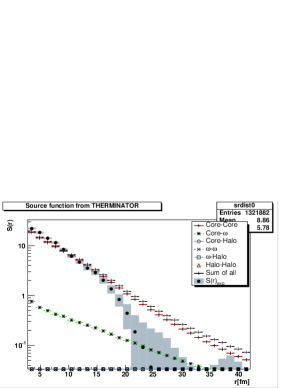
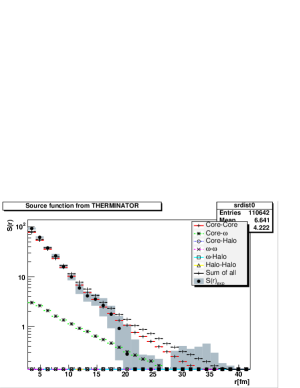
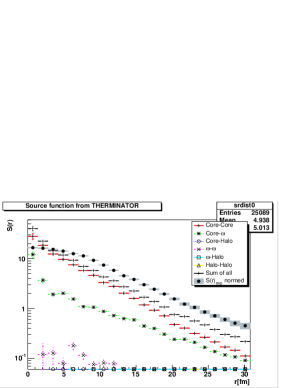
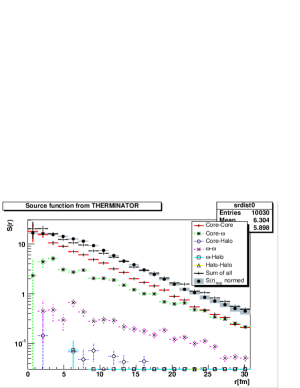
It must be noted that there is a significant excess in the simulated at small values. Our studies have shown that neither the primordial nor the resonance particles are responsible for it alone, but the peak vanishes if all the core particles and the short lived () resonances are excluded from the source (see Fig. 4). This can be explained with the freezeout that occurs in a single surface in this model, and the lack of rescattering.
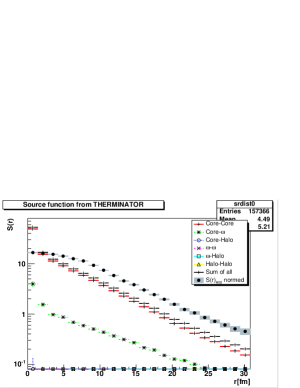
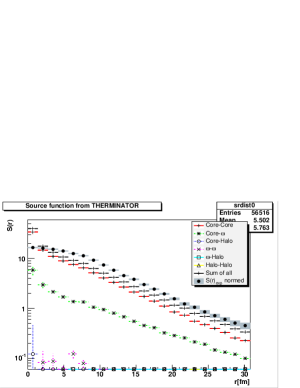
Further simulations indicate that rescattering and resonance decay create very different sources for different particles ( and ).
A study of direction-dependent PHENIX pion-pair source functions using THERMINATOR Blast Wave and Single Freezeout and models has been carried out by P. Chung et al. [14] and concluded that these models, although they do well in the ”sideways” and ”long” directions, fail in the ”outward” direction (in the terms of the Bertsch-Pratt parametrization [15]).
4.2 Discussion of results
THERMINATOR is a simple model that shows a high power in the description of particle spectra of the large heavy ion experiments. Although there is no rescattering implemented in this model, it reproduces the PHENIX image with the observed heavy power-law tail for the lower events with a higher accuracy than HRC—although it still slightly overpredicts the tail for the high regime, and fails for because of its inherent limitations.
The relatively good agreement including the reproduction of the long-range tail can be understood by taking into account that the high number of resonances provide us with an almost-continuum distribution of lifetimes, increasing virtually to infinity. This results in an approximate power-law-like final distribution [16] just as anomalous diffusion does [9]. However, THERMINATOR fails to describe correctly the intercept and the HBT radii and [17]. So it is questionable that resonance decays alone were sufficient to describe the experimentally seen structure of source as Bialas had proposed.
5 Conclusions
Source images of PHENIX data have been studied with two fundamentally different, simple models. Both were able to reproduce the observed 1D images to a certain level, but had their limits. The different kinematic mechanisms give similar shapes, that are determined by the same underlying mathematical principle (a generalization of the Central Limit Theorem), and so that any of them can be a potential explanation of the measured heavy power-law tails.
-
1.
HRC simulations describe low PHENIX image, but do not have the right dependence, as for higher values, the simulated 12 still has the large tail, but not the PHENIX data. The reason for the heavy tail is rescattering, change of mean free path and thus anomalous diffusion.
-
2.
THERMINATOR simulations provide a reasonable reproduction of the and centrality dependent behaviour of the 1D PHENIX image. The heavy tail in those simulations can be explained by the large number of resonances in that model. This produces an effect that is similar to the anomalous diffusion.
-
3.
However, THERMINATOR fails to describe the direction-dependently parametrized PHENIX source functions, suggesting that resonance decays alone are not a sufficient explanation of the measured structure of the source.
-
4.
Measurement of images for and could distinguish between rescattering and resonance decay effects.
References
- [1] R. Hanbury Brown and R. Q. Twiss, Nature 178, 1046 (1956).
- [2] S. E. Koonin, Phys. Lett. B70, 43 (1977)
- [3] A. Messiah, “Quantum Mechanics. Vol. 2”, De Gruyter, Berlin (1979).
- [4] E. O. Alt, T. Csörgő B. Lörstad and J. Schmidt-Sørensen, arXiv:hep-ph/0103019.
- [5] S. S. Adler et al. (PHENIX Collaboration), Phys.Rev.Lett.98:132301 (2007) [arXiv:nucl-ex/0605032].
- [6] D. A. Brown et al., Phys. Lett. B398, 252 (1997).
- [7] T. J. Humanic, Nucl. Phys. A 715, 641 (2003) [arXiv:nucl-th/0205053].
- [8] T. J. Humanic, Phys. Rev. C 73, 054902 (2006) [arXiv:nucl-th/0602027].
- [9] R. Metzler and J. Klafter, Physics Reports 339, 1-77.
- [10] M. Csanád and T. Csörgő, arXiv:hep-ph/0702032
- [11] A. Kisiel, T. Taluc, W. Broniowski, W. Florkowski, Comp. Phys. Comm. 174 (2006) 669 [arXiv: nucl-th/0504047v2].
- [12] W. Broniowski and W. Florkowski, Phys. Rev. Lett. 87 (2001) 272302 [arXiv: nucl-th/0106050].
- [13] A. Baran, W. Broniowski, W. Florkowski, Acta Phys. Polon. B35 (2004) 779 [arXiv: nucl-th/0305075].
- [14] P. Danielewicz, ”Analysis of Emission Shapes”, talk on the 23rd Winter Workshop on Nuclear Dynamics
- [15] S. Pratt, Phys. Rev. D 33, 72 (1986).
- [16] A. Bialas, Acta Phys. Polon. B 23, 561 (1992).
- [17] W. Florkowski, W. Broniowski, A. Kisiel, J. Pluta, arXiv:nucl-th/0609054v1